
Abstract
Objectives
The area under a receiver operating characteristic (ROC) curve (the AUC) is used as a measure of the performance of a screening or diagnostic test. We here assess the validity of the AUC.
Methods
Assuming the test results follow Gaussian distributions in affected and unaffected individuals, standard mathematical formulae were used to describe the relationship between the detection rate (DR) (or sensitivity) and the false-positive rate (FPR) of a test with the AUC. These formulae were used to calculate the screening performance (DR for a given FPR, or FPR for a given DR) for different AUC values according to different standard deviations of the test result in affected and unaffected individuals.
Results
The DR for a given FPR is strongly dependent on relative differences in the standard deviation of the test variable in affected and unaffected individuals. Consequently, two tests with the same AUC can have a different DR for the same FPR. For example, an AUC of 0.75 has a DR of 24% for a 5% FPR if the standard deviations are the same in affected and unaffected individuals, but 39% for the same 5% FPR if the standard deviation in affected individuals is 1.5 times that in unaffected individuals.
Conclusion
The AUC is an unreliable measure of screening performance because in practice the standard deviation of a screening or diagnostic test in affected and unaffected individuals can differ. The problem is avoided by not using AUC at all, and instead specifying DRs for given FPRs or FPRs for given DRs.
Introduction
The performance of screening or diagnostic tests in distinguishing affected from unaffected individuals is best assessed in terms of the detection rate (DR) (or sensitivity) for a given false-positive rate (FPR) (sometimes given as its complement, specificity). For example, a test that has a 50% DR for a 5% FPR is one in which 50% of affected individuals and 5% of unaffected individuals are screen-positive. Often, the relationship between the DR and the FPR is displayed as a plot (called a receiver operating characteristic [ROC] curve), with DR on one axis and FPR on the other, each on a scale from 0-100%. The diagonal represents a useless test (eg. 40% DR for a 40% FPR), and increasingly discriminatory tests are represented as curves that increasingly bow upwards towards the top left hand corner if the false-positive rate is on the horizontal axis. The area under this curve (so-called AUC or C-statistic) is commonly used as a summary estimate of test performance, taking values from 0.5 (useless test) to 1.0 (a perfectly discriminatory test).
Although the AUC statistic is widely used, there is little awareness of its shortcomings or, in the absence of an ROC plot, its translation into a meaningful measure of test performance. For example, an AUC of 0.75 is unlikely to be meaningful in terms of its translation to a DR for a given FPR. If additional tests are combined and the AUC increases to, for example, 0.8, it is difficult to judge by how much the test performance improves. It has also been pointed out that AUC values can yield misleading results if ROC curves cross. 1
Given an AUC, DRs for specified FPRs or FPRs for specified DRs depend on the means and the standard deviations of the screening test within affected and unaffected individuals. Sometimes, the standard deviations are the same, or similar. For example, the standard deviations of the second trimester biochemical Down’s syndrome screening marker alphafetoprotein. 2 In practice, the standard deviation is often wider in affected individuals than in unaffected individuals, perhaps because of the added variance of being affected on top of the usual population variance. For example, in antenatal screening for Down’s syndrome, the standard deviation of the ultrasound marker nuchal translucency in affected fetuses is approximately double that in unaffected fetuses, 2 and in adults aged 40 or more with familial hypercholesterolaemia, the standard deviation of low density lipoprotein cholesterol is approximately 50% higher than in unaffected individuals. 3
These considerations prompted us to examine the relationship between AUC and test performance expressed in terms of DRs for specified FPRs, and FPRs for specified DRs, based on equal and greater standard deviations in affected individuals than in unaffected individuals.
Methods
The DR can be expressed as a function of the FPR and the means and standard deviations of the test values in affected and unaffected individuals, if the distributions of a screening or diagnostic test variable are Gaussian. We show this in the statistical appendix, following the same mathematical basis described by Marzban in 2004. 4 We adopted the following approach. The test cut-off value was expressed as a function of the DR and the mean and standard deviation in affected individuals. Similarly, the test cut-off value was expressed as a function of the FPR and the mean and standard deviation in unaffected individuals. These two functions were then equated, so that the DR was specified in terms of the means and standard deviations of test values in affected and unaffected individuals and the corresponding FPR (eliminating the cut-off level). This gives the equation for the ROC curve. The AUC is the probability that a randomly selected affected individual will have a higher screening test value than a randomly selected unaffected individual. It can be expressed as a function of the means and standard deviations of the test values in affected and unaffected individuals. For a given AUC and a given standard deviation of the test values in affected individuals relative to that of the test values in unaffected individuals, this function can be algebraically rearranged so that the difference in means between affected and unaffected test values as a multiple of the standard deviation of unaffected test values can be made the subject of the function. In this way, the equation of the ROC curve was determined, from which DRs for specified FPRs (5%, 10%, and 15%) and FPRs for specified DRs (50%, 70% and 90%) were estimated, first assuming the standard deviations in affected and unaffected individuals were equal, and then assuming that the standard deviation in affected individuals was 50% greater and twice that in unaffected individuals.
Results
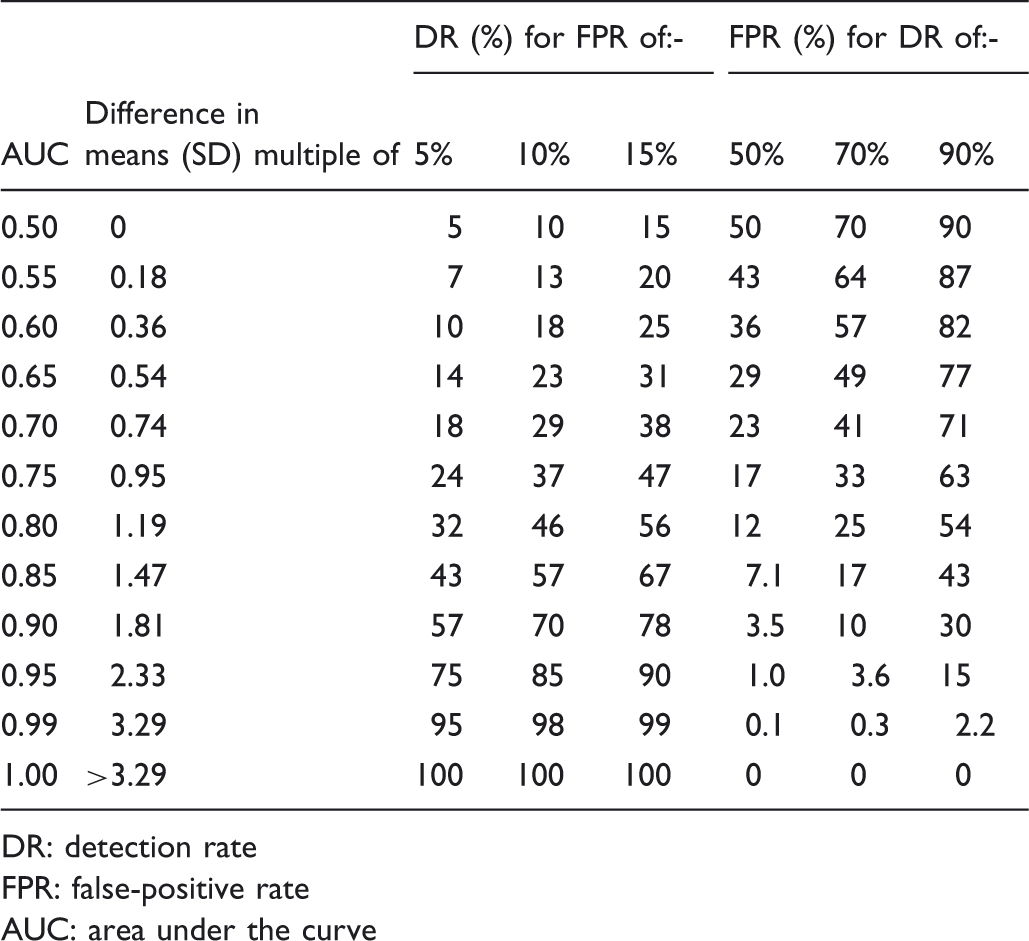
Table 1 shows the DR for three specified FPRs, and the FPR for five specified DRs, according to increasing AUC values from 0.50 to 1.00, with equal standard deviations in affected and unaffected individuals. The table also shows the differences in means expressed in multiples of the standard deviation according to AUC values. A reasonably good screening test would be expected to have at least a 75% DR for a 5% FPR, as is the case, for example, with antenatal screening tests for open neural tube defects and Down’s syndrome. This would require AUC values of 0.95 or better. The table shows that AUC increments (for example, 0.05 as shown in Table 1) have a large impact at high AUC values, but a small impact at low values. This is illustrated in figure 1, which shows the DR plotted against AUC for a 5% FPR and a 10% FPR for a test with equal standard deviations in affected and unaffected individuals. The plots become steeper as the AUC increases.
Detection rate plotted against area under the receiver operating characteristic curve (AUC) according to false-positive rate (FPR). Equal standard deviations in affected and unaffected individuals. Detection rates for specified false-positive rates and false-positives rates for specified detection rates according to AUC with equal standard deviations of the test result in affected and unaffected individuals. Differences in means between affected and unaffected individuals are expressed in multiples of the standard deviation individuals (SD). DR: detection rate FPR: false-positive rate AUC: area under the curve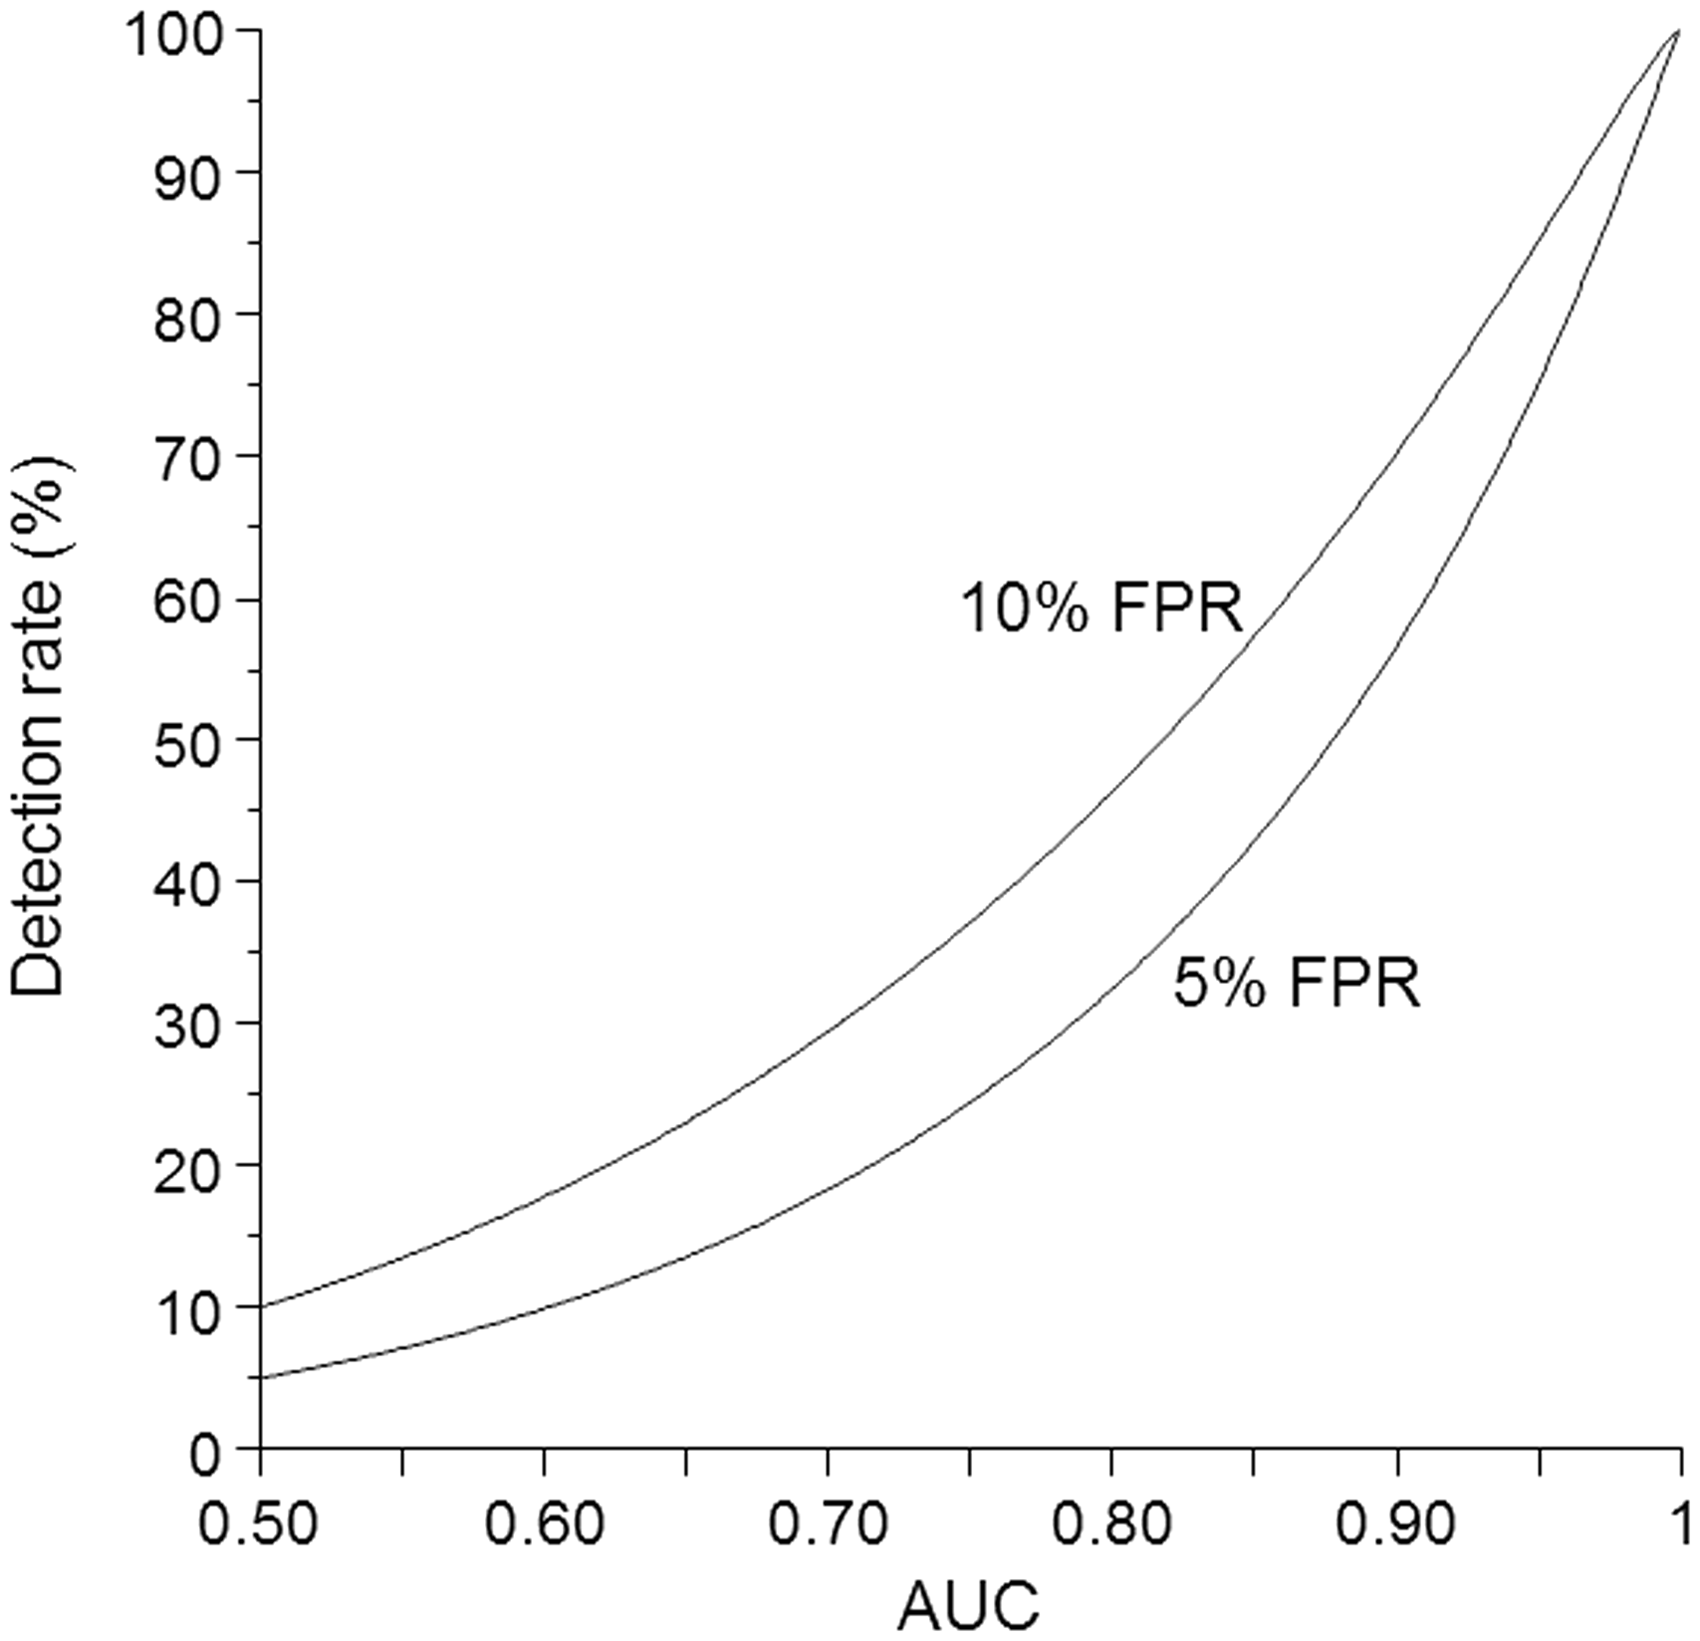
Detection rates for specified false-positive rates and false-positives rates for specified detection rates according to AUC with the standard deviation in affected individuals 50% greater than standard deviation in unaffected individuals. Differences in means between affected and unaffected individuals are expressed in multiples of the standard deviation in unaffected individuals (SDU).
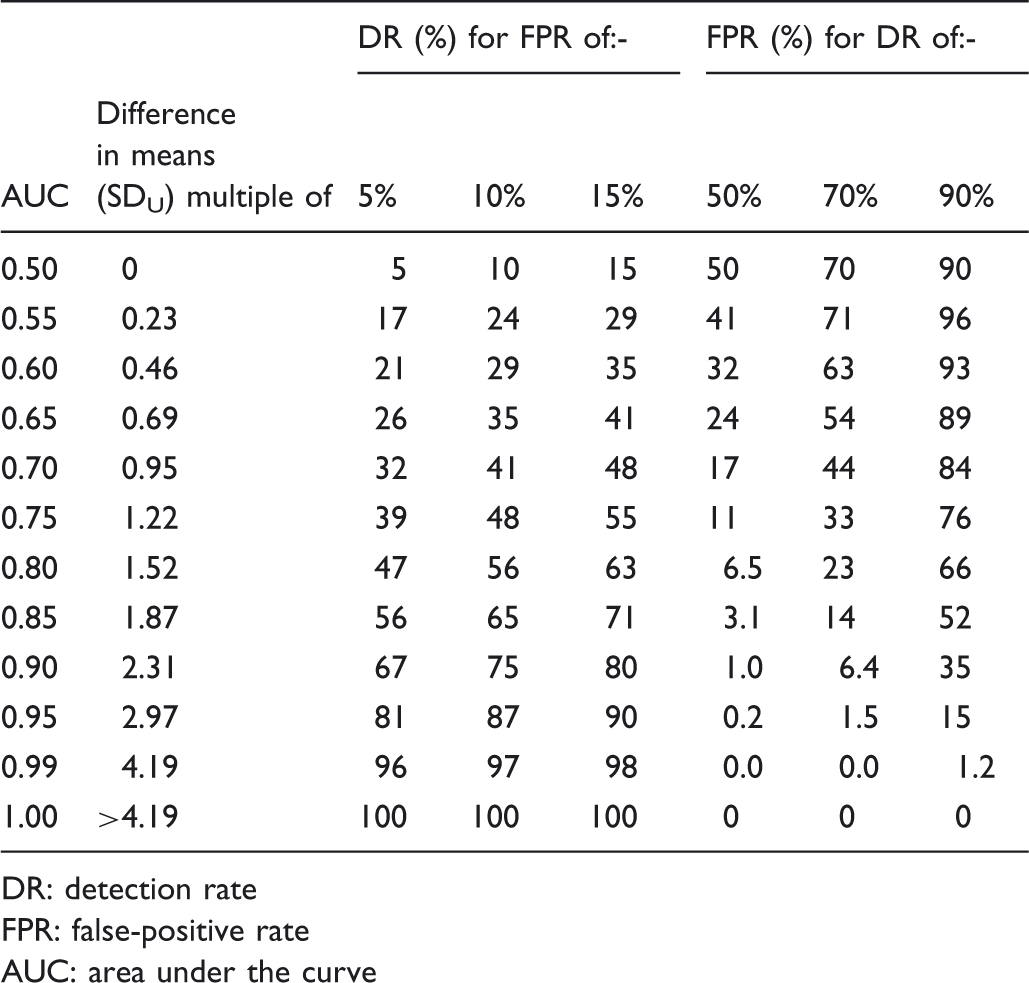
DR: detection rate
FPR: false-positive rate
AUC: area under the curve
Detection rates for specified false-positive rates and false-positives rates for specified detection rates according to AUC With the standard deviation in affected individuals 100% greater than standard deviation in unaffected individuals. Differences in means between affected and unaffected individuals are expressed in multiples of the standard deviation in unaffected individuals (SDU).
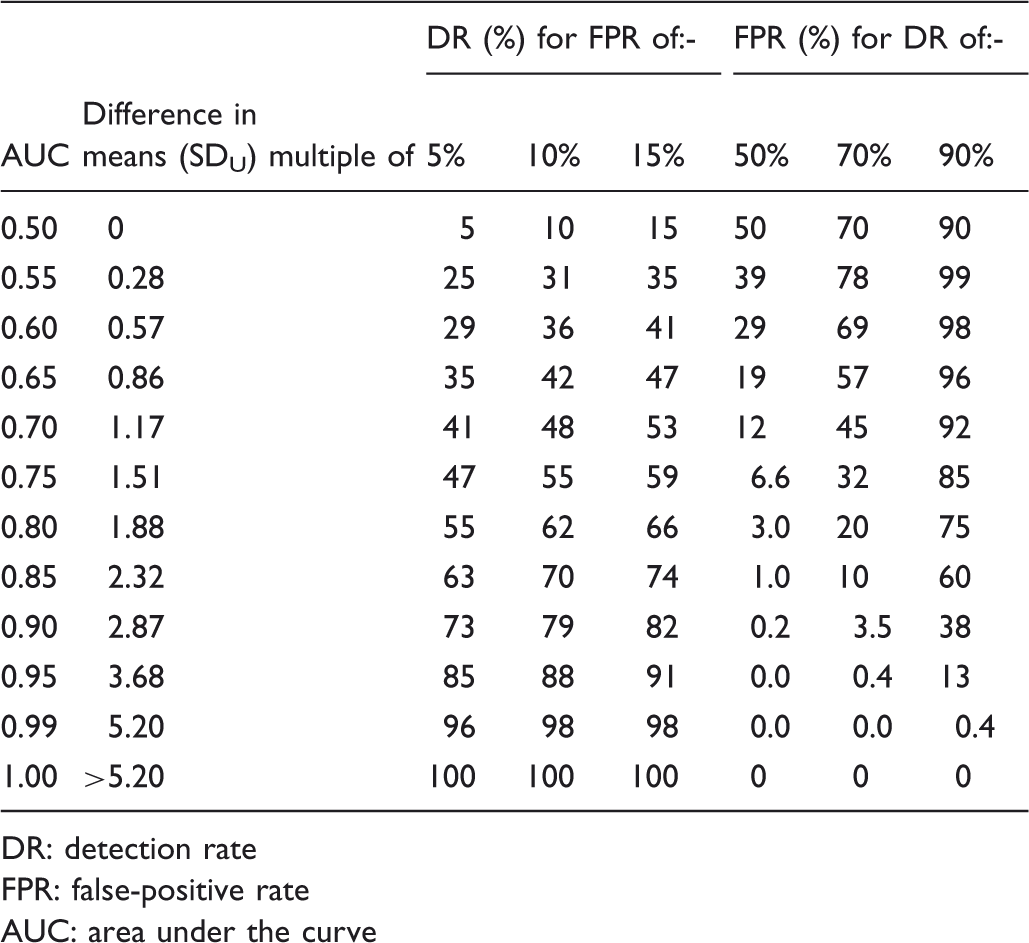
DR: detection rate
FPR: false-positive rate
AUC: area under the curve
Figure 2 shows the ROC curves reflecting the data corresponding to tables 1, 2, and 3. All the areas under the curves are identical (AUC 0.75), but the shapes are different, with a steeper curve at low FPRs and shallower curves at higher FPRs as the standard deviations increase in affected individuals. The overlapping relative distributions are also shown. The figure illustrates that to maintain a constant AUC, with different standard deviations, the difference in mean values between affected and unaffected individuals must vary. The same AUC then describes three different screening or diagnostic tests, with different screening performances. With different standard deviations in affected and unaffected individuals, the ROC curve crosses the diagonal, with the anomalous implication that at very high FPRs the FPR is greater than the DR. This arises because with different standard deviations the overlapping relative distributions cross at two points. This is unlikely to be true, and assessing whether it is, is likely to be difficult because there are usually too few data on affected individuals with test values in the lower tail for tests in which high values are associated with the disorder.
Receiver operating characteristic curves, all with an area under the curve of 0.75 with corresponding overlapping Gaussian distributions in affected and unaffected individuals according to size of affected standard deviation (SDA) relative to unaffected standard deviation (SDU).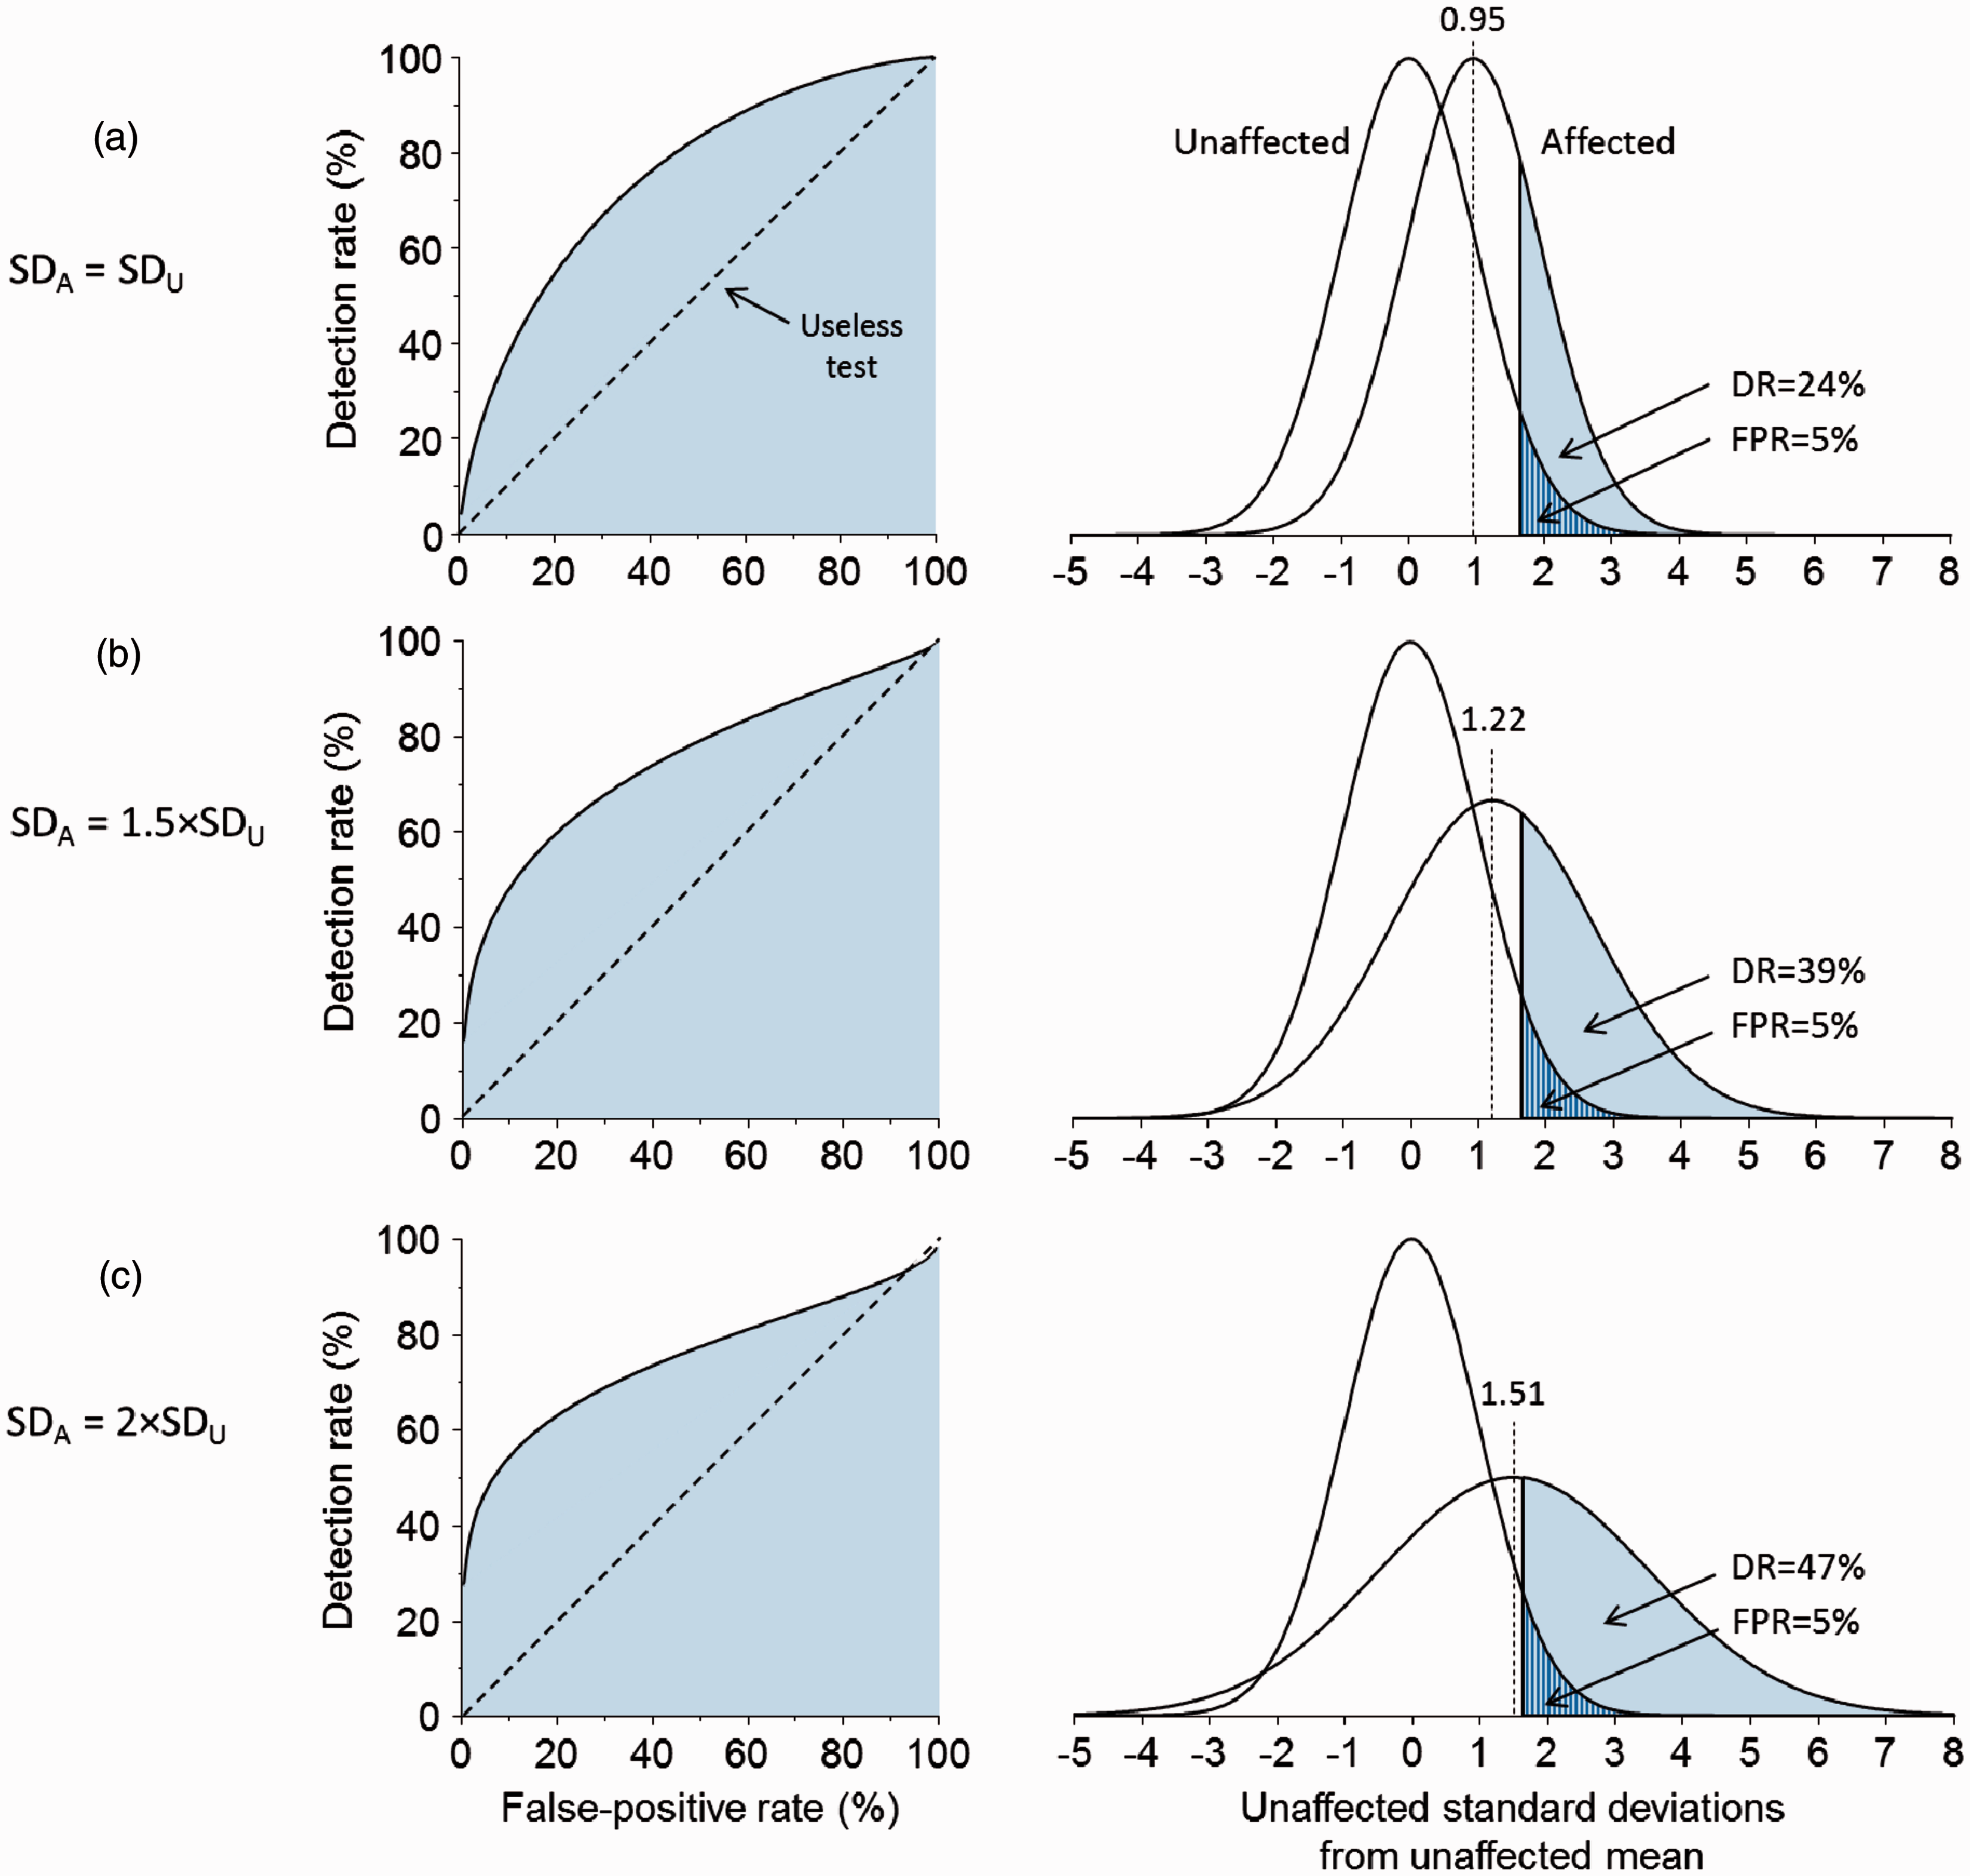
Discussion
While the plots of the DR against FPRs (ROC curves) are useful, the AUC is not. Not only do given AUC increments have larger effects on test performance as AUC values approach 1.0 (as others have shown 5 ), but the same AUC value can reflect different screening performances, caused both by variations in the mean value of test results in affected and unaffected individuals, and by differences in the standard deviations. Thus an AUC of 0.75 will have a DR of 24% for a 5% FPR and a DR of 47% for a 15% FPR if the test results in affected and unaffected individuals have the same standard deviations, but the same AUC yields DRs of 39% and 55% respectively for the same FPRs if the standard deviations in affected individuals were 1.5 times greater. Two tests with the same AUC can have different DRs for the same FPR. In addition, for the AUC to remain the same, with different standard deviations in affected and unaffected individuals, the difference between the mean values in affected and unaffected individuals would have to be different, effectively describing a screening test with different distribution parameters. It is mathematically impossible to have a constant AUC, and a constant difference between means, but different standard deviations.
Comparisons of the AUC between different screening or diagnostic tests, as are often made, may be meaningless. A larger AUC does not necessarily mean a better test at realistic FPRs, which usually need to be low to be acceptable, especially if the intervention consequent on a positive test result may be harmful (for example miscarriage from an amniocentesis in antenatal screening for Down’s syndrome). This weakness of AUCs is illustrated, for example, using an AUC of 0.7 with equal standard deviations of test values in affected and unaffected individuals. This yields an 18% DR for a 5% FPR (Table 1), but a lower AUC of 0.65 yields a higher DR of 26% for the same 5% FPR when the standard deviation of test values is 50% greater in affected individuals than in unaffected individuals (Table 2).
Sometimes, the effect of adding test markers needs to be assessed, for example, to compare the test performance of markers A and B with marker A. In this situation, as with the comparison of different markers (eg. A versus B), it is best to report DRs for given FPRs or vice versa.
Our results apply to single continuous markers, and to test results expressed as risk estimates, as is the case with multiple marker screening 2 , in the same way that they apply to test values themselves.
In summary, the AUC statistic, as used to summarize the performance of screening or diagnostic tests, is an unreliable measure of test performance, and should be abandoned. If ROC curves are used, direct estimates of DRs for given FPRs should be given, or vice versa, and when comparing screening or diagnostic tests, DRs at given FPRs or FPRs at given DRs in the range of DRs or FPRs likely to be used in practice should be compared, without reference to the AUC.
Footnotes
Funding
This research received no specific grant from any funding agency in the public, commercial, or not-for-profit sectors.