
Abstract
We explored the use of soft and flexible graphene (Gr)-reinforced polydimethylsiloxane (PDMS; Gr-PDMS) and Gr-carbon nanotube (CNT)-reinforced PDMS (Gr-CNT-PDMS) as nanocomposites (NCPs) in wearable electronic applications and investigated their mechanical and electrical properties. Specifically, we evaluated the mechanical reinforcement of the NCPs by performing Shore scleroscope hardness and machine-washing tests and evaluated their electrical properties by using a four-point probe. The results revealed that as the Gr or CNT concentrations increased, the NCPs’ hardness and surface resistance increased and decreased, respectively. Scanning electron microscopy revealed the formation of layered polymeric structures in the Gr-PDMS NCPs, contributing to the increase in hardness and decrease in surface resistance. Furthermore, bending tests revealed that changes in resistance were positively correlated with the Gr concentration. PDMS with low Gr concentrations exhibited no substantial changes in surface resistance after bending tests. However, for PDMS, as the Gr concentration increased (>5 wt.%), the cross-sectional morphology observed after 500 bending cycles differed substantially from that before observed bending tests. Additionally, the influence of one-dimensional (CNT) and two-dimensional (Gr) nanomaterials on the mechanical and electrical properties of the flexible PDMS samples was investigated. The aim of this study is to highlight the importance of considering the properties of different nanomaterials in developing high-performance NCPs for wearable electronics.
Keywords
Introduction
Advancements in soft electronic materials and sensing technology have fostered considerable growth and maturity in wearable and soft sensing technologies. 1 Wearable and soft sensing devices have an extensive range of applications, and they can convert physiological signals into electrical signals that can be interpreted by humans, thereby enabling the effective monitoring of human health. Furthermore, these devices have considerable potential for use in biomedicine and soft electronic skin applications. 2 Numerous polymers can be employed as substrate materials for sensors, including polyester, polyimide, polyethylene terephthalate, polyurethane, and polydimethylsiloxane (PDMS). Among these materials, PDMS is prominent because of its exceptional transparency, biocompatibility, elasticity, and stretchability, in addition to its ease of integration with doped conductive materials. 3 Therefore, PDMS is extensively used in soft electronic applications. Doped conductive materials—including carbon-based materials, metal nanowires, and metal nanoparticles—constitute the core components of soft electronic devices and impart unique electronic and mechanical properties to such devices. In particular, carbon-based materials such as graphene (Gr) and carbon nanotubes (CNTs) exhibit remarkable mechanical and electrical properties are thus extensively used in the production of flexible pressure-sensitive strain sensors.3–19
The integration of Gr or CNTs with polymers to form composites has been a topic of interest in recent years due to their unique properties. Especially, the effect of bubble-based degradation on the properties of single-wall carbon nanotube (SWCNT)/epoxy resin composites was investigated. 20 A new method based on vacuum shock was presented, which improved the electrical conductivity and electromagnetic wave absorption properties of the composite. Also the epoxy-based nanocomposites (NCPs) containing highly and randomly aligned SWCNTs were fabricated by the vacuum shock technique. 21 The electrification of SWCNTs led to a significant improvement in electrical conductivity and electromagnetic interference shielding of the nanocomposites. The graphene oxide (GO) and GO-octadecyl amine (GO-ODA) were also incorporated into epoxy resin to enhance chemical resistance, hardness, roughness, and hydrophobicity of the nanocomposites. 22 The study found that GO-ODA can be used as an efficient filler to develop effective hydrophobic polymeric shields against chemical degradation. The combination of hybrid polymeric platforms with laser-assisted reduced GO to create a high-performance hybrid NCPs as a battery and supercapacitor device have been demostrated. 23 By modifying the drawbacks of polymeric configurations with silver nanowires, the resulting configurations exhibit boosted cyclic stability, specific capacitance, and energy density. The application of Gr derivatives (GO and reduced GO) could also be used in antibody mounting capability and detection. 24 Those demostrations show the potential of Gr- and CNT-based composites in enhancing the properties and performance of polymeric and carbonaceous materials in various applications.
The mechanical properties of polymer NCPs with carbon nanotubes (CNTs) and Gr nano-platelets were investigated. 25 Poly lactic acid/polyolefin elastomer NCPs were fabricated by mixing nanocomposites 1-3 wt.% CNTs into the polymer matrix. The addition of CNTs and significantly increased the impact strength and deformation at break by 128% and 75%, respectively. Multi-Walled Carbon Nanotubes (MWCNTs) doped polyurethane (PU) polymer NCPs using a two-step method that involved solution mixing and compression molding were also investigated. 26 The uniform dispersion of MWCNTs in the PU matrix by this method significantly improved the elastic modulus and hardness by 124% and 53%, respectively, for the 10 wt% PU/MWCNTs composite, as well as the compressive modulus by 52% for the 10 wt% composite. Both studies demonstrated the potential of carbon-based nanomaterials to enhance the mechanical properties of polymer composites.
Scholars have explored the application of CNTs in soft electronics. For example, Wang et al. 27 placed a single-walled CNT film between two layers of flexible PDMS film to create a highly sensitive, stable, and flexible sensor. The advantages of the created sensor are its capacity for low pressure detection (with a resolution of <0.6 Pa), fast response (within <10 ms), and high stability (over 67,500 cycles); in addition, the sensor can detect physiological activity signals with high sensitivity. Moreover, scholars have explored the application of Gr materials in soft electronic sensing. For example, Jeong et al. 28 used Gr foam as an active material to develop highly stretchable and sensitive flexible strain sensors; the sensors were noted to exhibit 70% stretching deformation and high stability, in addition to exhibiting strain coefficients ranging between 15% and 29% when different concentrations of Gr were added. Additionally, to overcome limitations attributable to poor adhesion of CNTs with PDMS, Jian et al. 29 presented a method of integrating CNTs and Gr to fabricate a CNT/Gr hybrid film; specifically, they first coated a surface of aligned CNTs with copper foil and then grew Gr on the copper foil through chemical vapor deposition, thus yielding the hybrid film. They used the fabricated hybrid film as the sensing element in a flexible strain sensor and reported excellent stability and sensitivity.
The process of manufacturing inks for textiles involves challenges related to tasks such as ensuring the adhesion of the ink to the textile substrate, maintaining uniformity and continuity of printing, and maintaining the conductive features of yarn after washing. 30 Moreover, traditional metal wires break easily during bending tests because of metal fatigue and thus lose the ability to transmit signals. Conductive materials coated on the surface of traditional metal wires also peel off easily during washing tests, thereby losing conductivity. 31 The aim of this study was to explore the use of soft and flexible Gr-reinforced PDMS (Gr-PDMS) and Gr-CNT-reinforced PDMS (Gr-CNT-PDMS) as NCPs for wearable electronics. The mechanical and electrical properties of the NCPs were evaluated through Shore scleroscope hardness and machine-washing tests, and four-point probe testing. The results showed that the hardness of the Gr-PDMS NCPs increased with the concentration of Gr added, and this could be attributed to dispersion strengthening. As the Gr concentration increased, the surface resistance of PDMS decreased, with the largest decrease occurring when the concentration of Gr added was between 1% and 20%. The surface resistance of the Gr-PDMS NCPs depended on the Gr concentration, decreasing as the Gr concentration increased. SEM revealed an increase in hardness and decrease in surface resistance, which could be attributed to the formation of layered polymeric structures. The mechanical bending tests also showed that changes in resistance were positively correlated with the Gr concentration. As the Gr concentration increased (>5 wt.%), the cross-sectional morphology of PDMS observed after 500 bending test cycles was notably different from that observed before the bending tests. Furthermore, the influence of CNTs and Gr on the mechanical and electrical properties of the flexible PDMS was investigated. The results indicated that the hardness of Gr-CNT-PDMS increased with the concentration of CNTs added, and the rate of increase was higher than that observed when the same proportion of Gr was added. The study highlights the potential of these materials as conductive coatings for wearable electronics, providing better strength and flexibility than traditional metal wires.
Materials and methods
Materials and morphology characteristics
Gr powder (UHPEx-2) and –COOH functionalized single walled-double walled CNTs were purchased from Jimei Material Co. The CNTs was produced by CVD and further functionlized using a discharge process which provides the ease of dispersion in the host matrix. The crystal structure and layer thickness of Gr was veriufied by a transmission electron microscopy (TEM) using a JEOL JEM-2100 TEM system (JEOL, Tokyo, Japan), and a noncontact Fizeau laser interferometer (ZYGO Verifire™ ATZ, AMETEK Taiwan Corp., LTD, Hsinchu, Taiwan). Scanning electron microscopy (SEM) was conducted using a JEOL JSM-7800 F field-emission SEM (JEOL, Tokyo, Japan).
Fabrication of Gr-PDMS and Gr-CNT-PDMS NCPs
A high-pressure homogenizer (YOSHIDA KIKAI; L-ES) was used to disperse the Gr or Gr/CNT powder in toluene at a pressure of 75 MPa and flow rate of 100 mL/min in 10 cycles. The A component of AB-type (Dow Corning® SYLGARD PDMS 184) PDMS was mixed with toluene and diluted to 50% concentration by using the aforementioned high-pressure homogenizer (YOSHIDA KIKAI; L-ES) at a pressure of 20 MPa and flow rate of 100 mL/min in 10 cycles; this dilution was conducted to prevent the A component from being unevenly distributed when mixed with Gr subsequently. The high-pressure homogenized Gr slurry and diluted A component were mixed using a double-stage high-pressure homogenizer (YOSHIDA KIKAI; L-ED) at a pressure of 100 MPa and flow rate of 100 mL/min in 10 cycles. In the last two cycles, the B component of AB-type PDMS was added to the mixture. After the mixing process, the slurry was poured into stainless steel plates coated with a release agent and allowed to cure for 24 h.
Machining washing process for NCPs
The mechanical reinforcement of the NCPs was evaluated through machine-washing tests. Considering the lack of standard test specifications for machine-washing tests for PDMS, we conducted our machine-washing tests by adopting the American Association of Textile Chemists and Colorists (AATCC)-provided AATCC-135 test specification for water-washing tests. The machine-washing tests involved the following steps: (1) A sample was collected and weighed; if its weight was less than 1.8 kg, cloth with a predetermined weight was added to ensure that the sample’s weight reached 1.8 kg. (2) A washing machine was filled with room-temperature (25°C) water up to the middle level. (3) Neutral detergent (92 g) was dissolved in warm water and then added to the washing machine. (4) The test sample was then placed in the washing machine. (5) The machine was subsequently activated to wash the sample under standard machine settings. (6) Once the washing process was completed, the test sample was collected from the machine and placed in a dryer operating at a drying temperature to 60°C, and the sample was dried for 1 h. (7) After the drying process, the test sample was removed from the dryer and returned to the washing machine to repeat steps 2–6. Overall, 1, 2, 5, 10, 50, and 100 washing and drying cycles were performed. The dried test sample was placed in a dust-free room (temperature 20°C; humidity 50%) for 4 h, and the change in resistance was then measured and recorded.
Characteristics of mechanical properties
The mechanical properties of the derived Gr-PDMS and Gr-CNT-PDMS NCPs were evaluated through Shore scleroscope hardness tests. The Shore scleroscope is typically used to measure the hardness of rubber, foam, and plastic in accordance with the regulations stipulated in the American Society for Testing and Materials (ASTM) D2240 standard; this standard is used for evaluating rubber sample hardness through the use of a durometer. The Shore scleroscope includes a steel pin with a certain shape. To measure the hardness of a sample, the sample is placed on a solid plane, and the scleroscope is held steady so that its pin makes contact with the sample at a point that is least 12 mm away from the edge of the sample. Thus, the pin is pressed vertically toward the surface of the sample under a test force. When the pin makes full contact with the surface of the sample, the depth L of the indentation created by the pin tip relative to the pressed plane is measured, and the reading is recorded within 1 s; L is proportional to the Shore hardness. A higher L value indicates a lower Shore hardness level. In this study, we measured the Shore hardness of PDMS samples with different Gr concentrations; for each sample, we conducted these hardness measurements at five different points (five points on the front side and back side of each sample) at least 6 mm apart (at least 15 mm apart for porous materials) and then took their average.
Characteristics of electrical properties
The electrical properties of the Gr-PDMS and Gr-CNT-PDMS NCPs were evaluated using a four-point probe. Four-point probes are extensively used to measure the resistance of thin films. Typically, four-point probes are arranged on the same straight line, and the surface resistance of the film (ρ) under evaluation can be obtained using the following formula: ρ = Rs × T = [C.F. × (V/I)] × T, where ρ denotes resistivity (μΩ-cm), Rs denotes sheet resistance (Ω), T denotes thickness (cm), C.F. denotes the correction factor (4.532 in this study), V denotes the DC voltage (determined through a voltage probe), and I denotes the fixed DC (determined through a current probe).
Results and discussion
Morphology of layered gr structure
Samples of well-dispersed Gr in PDMS slurry were collected and examined through TEM to assess their appearance and electron diffraction patterns. Figure 1(a) depicts the TEM micrograph of the samples, indicating that the Gr particles had a size of 1.5–2 μm and had complete edges with no holes at the center. Figure 1(b) presents the electron diffraction pattern of the samples; the samples had a complete hexagonal structure with no diffraction rings or other diffraction points, confirming that the Gr structure was complete and that the number of layers was small. Figure 1(c) depicts the white light interferometry image of the samples, indicating that the of the Gr structure was approximately 3 nm and that the Gr structure had eight to nine layers (the thickness of each layer was approximately 0.335 nm). (a) TEM image, (b) electron diffraction pattern, and (c) white light laser interferometry image of uniformly dispersed Gr particles in PDMS slurry at high pressure.
Mechanical properties of Gr-PDMS NCPs
Figure 2(a) illustrates the measurement results. As the Gr concentration increased, the hardness of the Gr-PDMS NCPs increased. This phenomenon is similar to the dispersion strengthening of metallic materials and is explained as follows. In a metallic material, uniformly distributed second-phase particles can impede dislocations and thereby increase the strength of the material. The increase in strength is associated with a decrease in the material’s susceptibility to plastic deformation and an increase in hardness. Accordingly, in our Gr-PDMS NCPs, the uniformly dispersed second phase (i.e., Gr) may have anchored PDMS chains, creating a bond between one end of a PDMS chain and the edge of the Gr structure. Moreover, Gr is typically stronger than PDMS chains and is thus less susceptible to deformation, which impairs the extension, torsion, and deformation of PDMS chains. Therefore, increasing the Gr concentration could reduce the extent to which PDMS chains could be extended, twisted, and deformed, resulting in increased material hardness. Gr also has a sheet-like structure; hence, the distance between PDMS chains decreases with a decrease in interlayer distance, thus resulting in higher apparent strength. Because of such dispersion strengthening, the uniformity of the second phase (i.e., Gr) is crucial for hardness enhancement. The coefficient of variation (CV) can be used to evaluate the homogeneity of a high-pressure homogenization product. The CV is calculated by dividing the standard deviation by the mean; it is a dimensionless measure and can thus be used to compare multiple sets of data. Figure 2(b) presents the CV as a function of Gr concentration, as assessed in this study. The CV was negatively correlated with the Gr concentration; specifically, the CV decreased as the Gr concentration increased, indicating that the degree of dispersion of Gr in PDMS increased with the Gr concentration. When the Gr concentration was 1%–10%, the CV did not exhibit a gradual decreasing trend; instead, it exhibited an upward trend. During the dispersion and mixing processes, we observed an increase in temperature and paste viscosity, which could be attributed to the high specific surface area of the Gr powder. When the Gr concentration exceeded 0.5%, during the dispersion and mixing processes, the Gr powder particles aggregated together, resulting in an increase in the overall viscosity of the paste. In the high-pressure homogenization process, after the viscosity increased, the frictional force between the paste and stainless steel pipe and diamond nozzle increased, resulting an increase in temperature. Therefore, the effects of dispersion and mixing decreased, which explains the high CV values. Accordingly, adjusting the proportion of toluene or reducing the pressure and increasing the number of cycles may improve the mixing uniformity. (a) Shore hardness and (b) CV values derived for Gr-PDMS NCPs as a function of Gr concentration.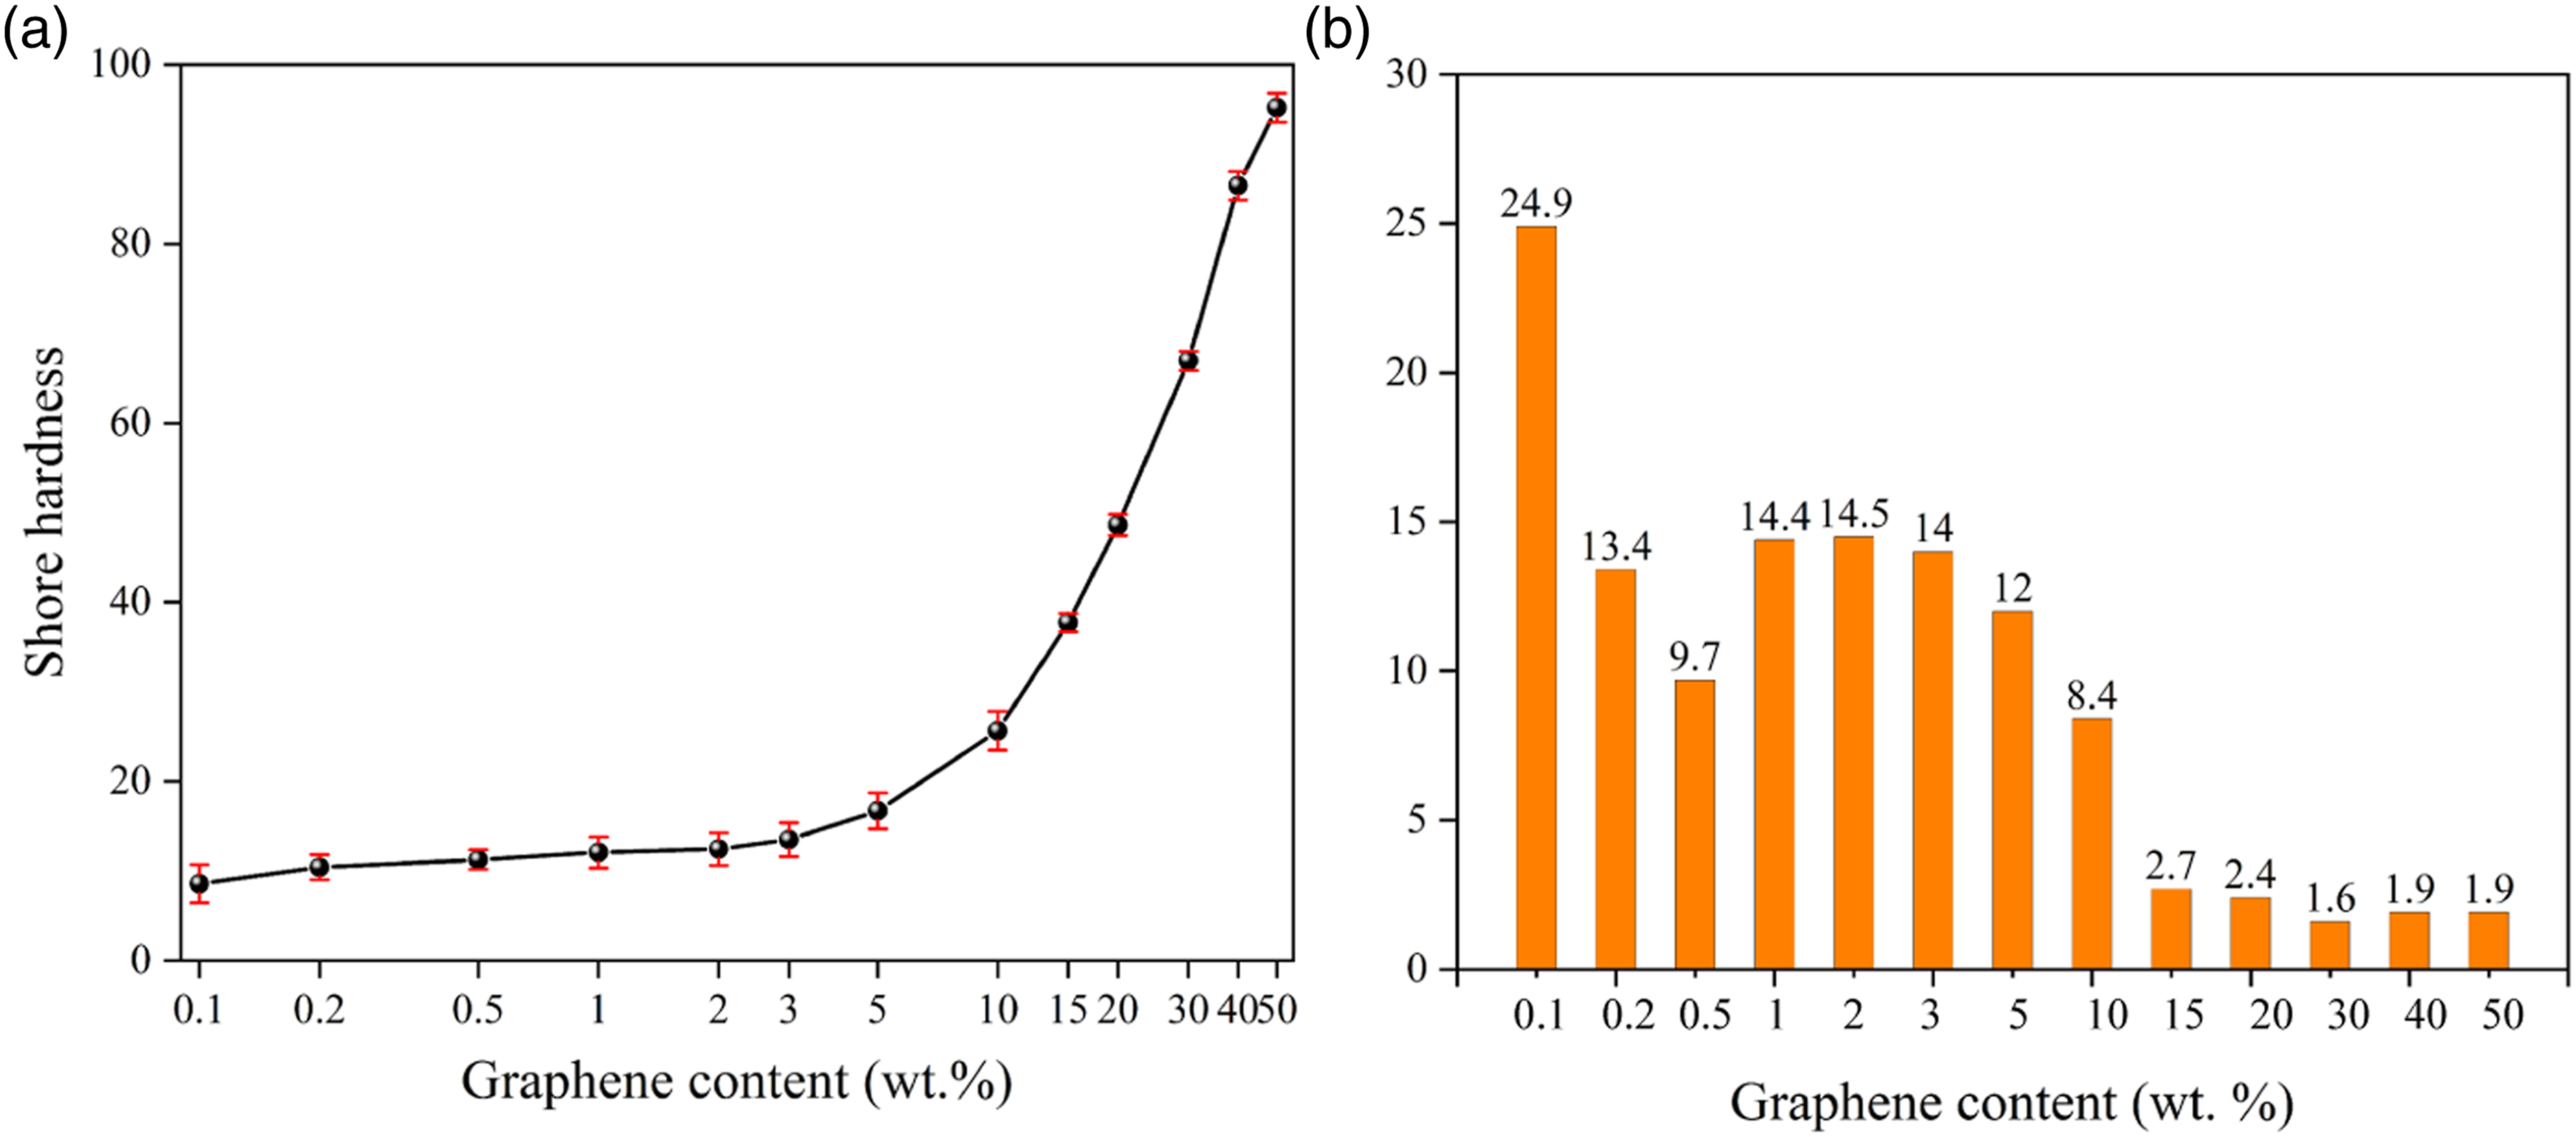
Electrical properties of Gr-PDMS NCPs
In this study, we used four metal probes to establish contact with the film surface and then recorded the voltage between the middle two probes by using a potentiometer. Figure 3(a) displays the relationship between the applied Gr concentration and the surface resistance of the Gr-PDMS NCPs. As the Gr concentration increased, the surface resistance of the Gr-PDMS NCPs decreased; the most notable decrease occurred when the Gr concentration was 1%–20%. This decrease in resistance occurred in four stages. In the first stage, when the Gr concentration was between 0.1% and 0.2%, Gr did not form a connected network in PDMS, and the resistance did not change substantially. In the second stage, when the Gr concentration was between 0.2% and 3%, Gr formed a connected network in PDMS, mainly through a point or line contact between the edges of the Gr structure. In the third stage, when the Gr concentration was between 3% and 20%, the point or line contact of the connected network formed by Gr in PDMS transformed into a surface contact, leading to a rapid decrease in resistance. Finally, in the fourth stage, when the Gr concentration was between 20% and 50%, the connected network formed by Gr in PDMS approached saturation, resulting in no substantial change in resistance. (a) Surface resistance and (b) CV values derived for Gr-PDMS NCPs as a function of Gr concentration.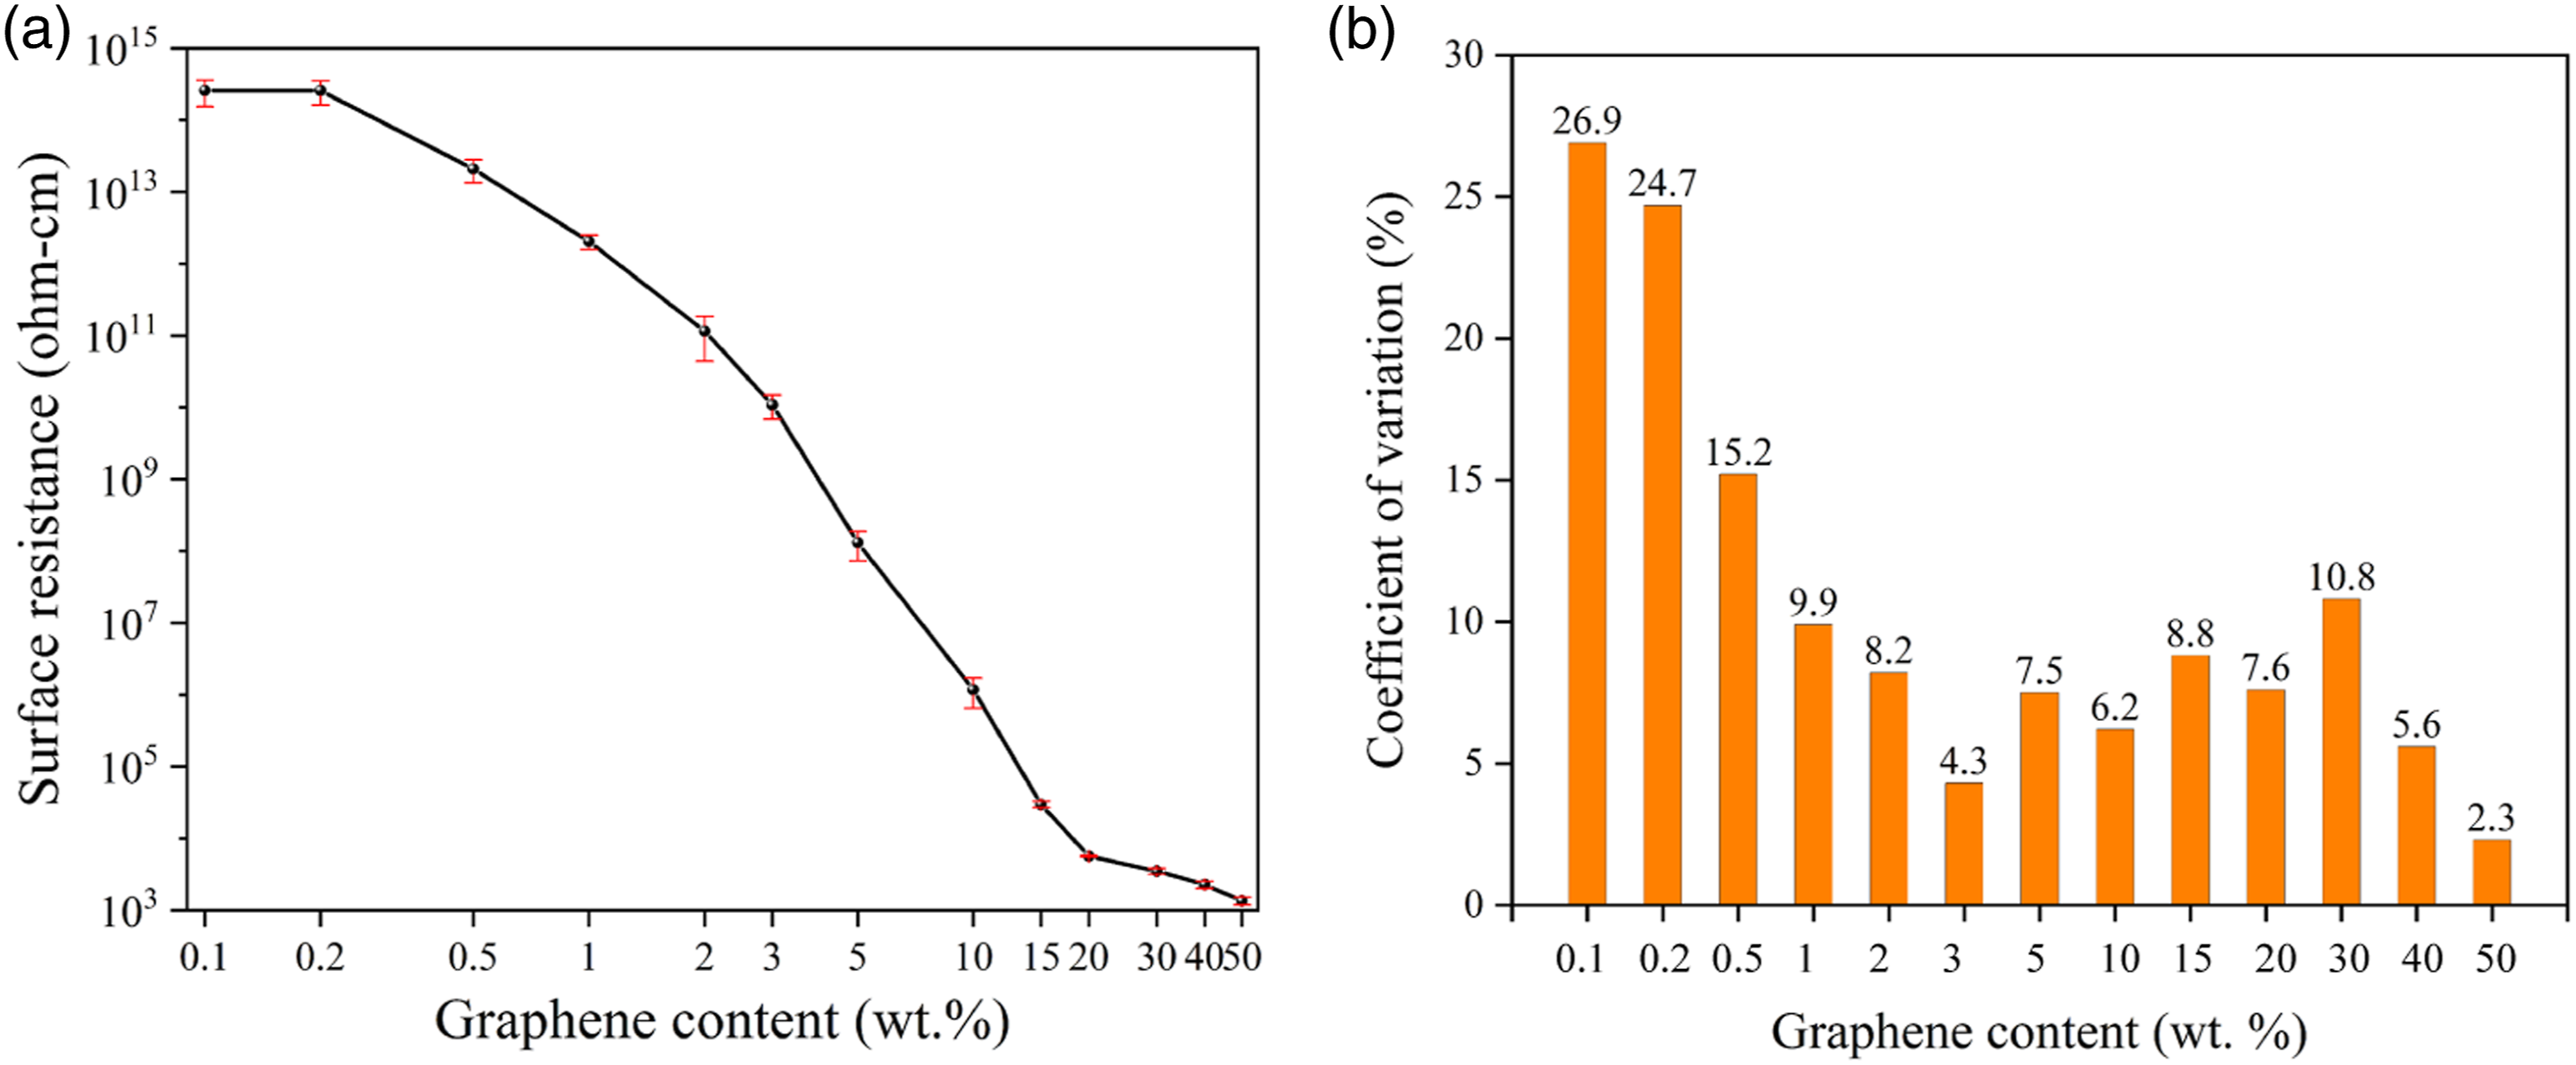
The resistance ratios observed for the various Gr concentrations in the PDMS matrix were related to the dispersion uniformity of Gr. We conducted CV evaluations by using the four-point probe at five different points for each sample (five points on the front side and back side of each sample). Figure 3(b) illustrates the CV evaluation results. The CV values observed for the Gr-PDMS NCPs with 1%–30% Gr were mostly within 10%, except for those observed for the first block (i.e., those with 0.1%–0.5% Gr), indicating a uniform distribution of Gr on the Gr-PDMS NCP sample surface. The density of Gr is typically lower than that of PDMS. Hence, in this study, when the Gr/PDMS slurry was dispersed, mixed, and poured onto a stainless steel plate for curing, the slurry reached a non-sticky state (i.e., no surface sticking) in the first hour, but complete PDMS curing required 24 h. Furthermore, Gr formed layers in the Gr-PDMS NCPs, thus explaining why the CV values were mostly within 10%.
Cress-sectional morphology of Gr-PDMS NCPs
Figure 4 depicts cross-sectional SEM images of the morphology of the PDMS samples with different Gr concentrations. Previous study used density functional theory simulations to investigate and identify the interfacial interaction between CNT and polymer matrix.
32
Here we observed the a typical polymer structure with a linkage morphology of the PDMS sample without Gr exhibited. However, when 2 wt.% Gr was added, the PDMS sample exhibited a slightly flaky structure. Increasing the Gr concentration resulted in a more apparent formation of laminar structures within the PDMS matrix. The formation of laminar structures within PDMS upon incorporation of a high loading of graphite flakes can be attributed to several factors. Firstly, the high aspect ratio of the graphite flakes may lead to their preferential alignment within the PDMS matrix during the mixing process. Secondly, the strong van der Waals interactions between the graphite flakes may promote their aggregation and subsequent layer-by-layer stacking within the polymer matrix. Additionally, the low surface energy of the graphite flakes may hinder their uniform dispersion throughout the PDMS, leading to the formation of large clusters and ultimately, the laminar structures. These factors collectively contribute to the observed formation of laminar structures within the PDMS upon high loading of graphite flakes. The laminar structure provides a plausible explanation for the increase in hardness and decrease in surface resistance observed for the PDMS samples as the Gr concentration increased. In particular, the formation of layered polymeric structures engendered by the addition of Gr reinforced the PDMS matrix and contributes to its mechanical and electrical properties. Cross-sectional SEM images of PDMS with different Gr concentrations.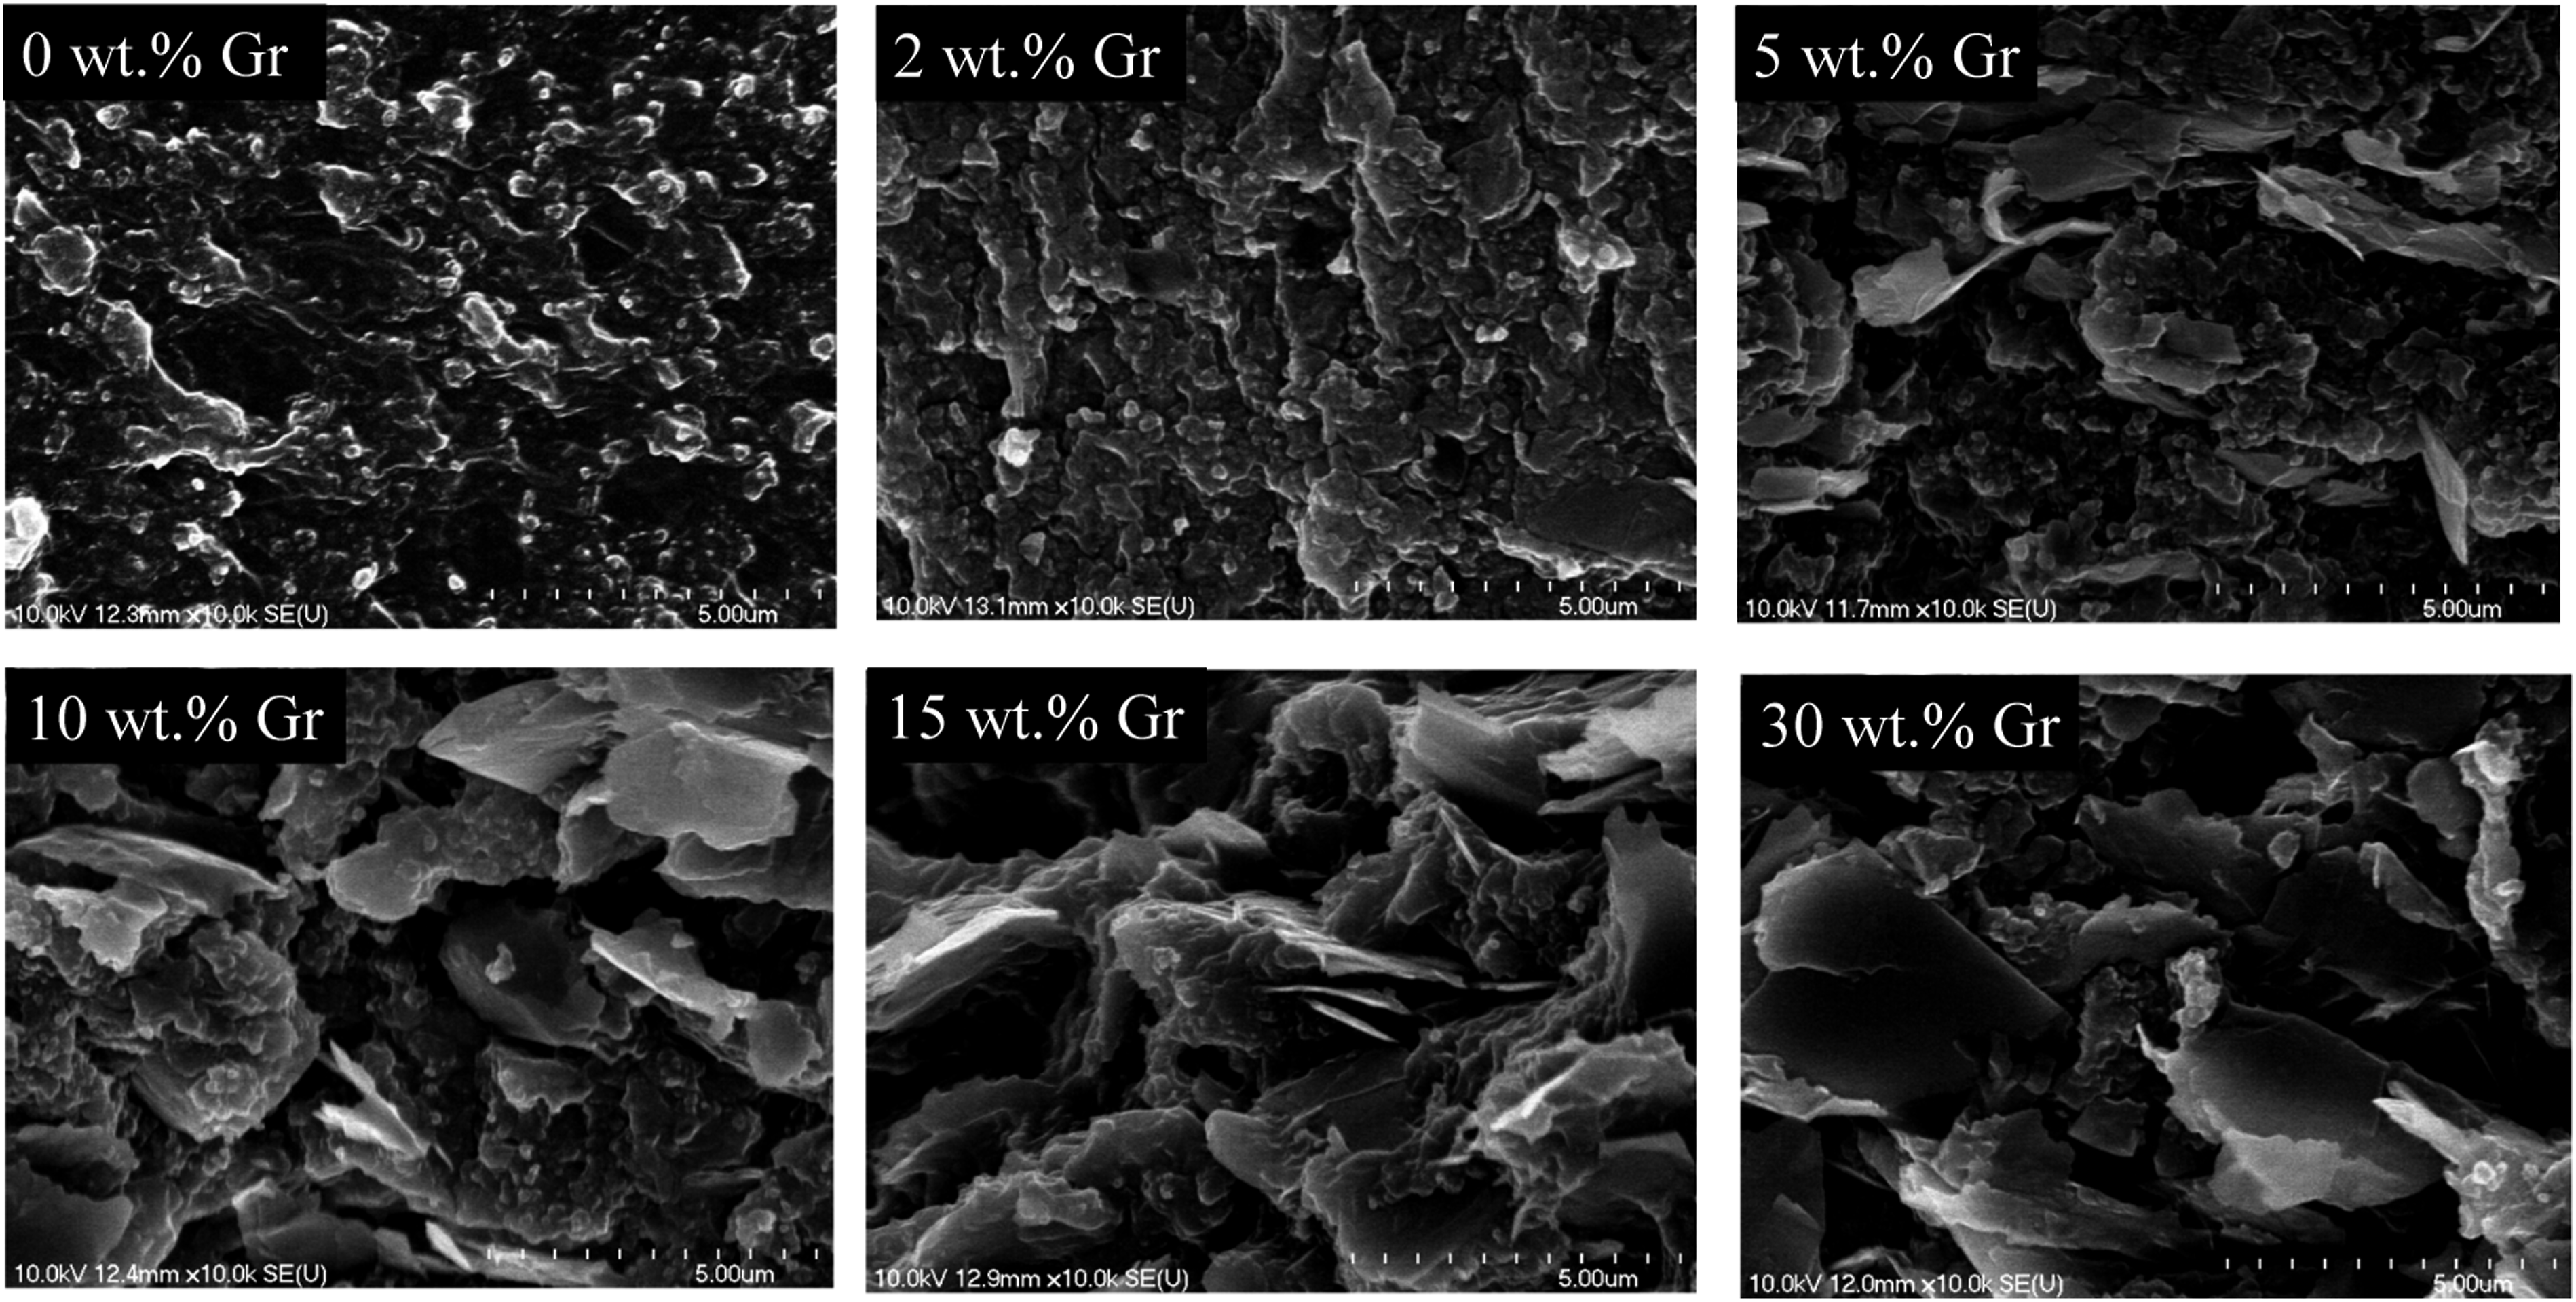
Mechanical, electrical and morphology of Gr-PDMS NCPs after bending and machine washing
We performed a 180° bending test on our PDMS samples with different Gr concentrations. During the test, we first fixed the Gr-PDMS NCP samples on a 2-mm-thick acrylic pedestal and then performed the bending test at a radius of curvature of 2 mm. We performed several bending cycles and assessed the changes in resistance after the cycles. Figure 5(a) displays the test results. The changes in resistance were positively correlated with the Gr concentration. Specifically, increasing the Gr concentration engendered increased changes in resistance. In addition, increasing the number of bending cycles resulted in increased changes in resistance. When the Gr concentration was small, the Gr-PDMS NCPs were relatively soft (as determined by Shore hardness values); moreover, their deformation was mainly absorbed by the PDMS substrate, and the adhesion at the Gr and PDMS interface was strong. However, as the Gr concentration increased, the spacing between the Gr edges decreased, signifying that both Gr and PDMS started to absorb the deformation of the samples; at this point, the interface between Gr and PDMS was under tension. When the tensile force exceeded the bonding force between Gr and PDMS, the two separated, resulting in the formation of a gap between them; in other words, the overlapping Gr and Gr particles separated, causing an increase in the resistance. Because of the Gr defects, the tension at the interface ruptured the Gr structure, causing a further increase in resistance. We calculated the changes in resistance before and after the machine washing of the Gr-PDMS NCP samples by using the following formula: ΔR/Ro, where the ΔR denotes the resistance difference before and after machine washing and Ro denotes the initial resistance of the NCP samples before washing. Figure 5(b) presents the changes in resistance as a function of washing cycles. The changes in resistance before and after machine washing increased with the number of cycles. This is because Gr on the surface of the Gr-PDMS NCPs gradually separated from PDMS as the number of cycles increased, resulting in an increase in the measured surface resistance. The changes in resistance occurred in three stages. In the first stage, the Gr concentration was 0.1%–0.5%, and the quantity of Gr particles on the surface was thus small. Because resistance is primarily dependent on PDMS, the change in resistance was small. In the second stage, the Gr concentration was 0.5%–5%. With the increase in the Gr concentration, more Gr particles were present on the surface of PDMS; these particles were increasingly detached from the surface as the number of washing cycles increased, thus increasing the change in resistance. The level of change was higher than that observed in the first stage. In the third stage, the Gr concentration was 10%–50%, and the corresponding change in resistance after washing was even higher. This is because the spacing of Gr particles was considerably small, which resulted in the overlap of particles; consequently, Gr particle detachment during washing resulted in surface exposure. As the number of washing cycles increased, the underlying Gr particles detached, forming a thin layer of Gr-PDMS NCPs on the surface, which thus increased the change in resistance. Changes in resistance in Gr-PDMS NCPs with different Gr concentrations after various cycles of (a) machine bending and (b) machine washing.
Figure 6 depicts cross-sectional SEM images that we captured before and after conducting bending tests on PDMS samples with varying Gr concentrations. The cross-sectional morphology of the PDMS samples containing 1 wt.% Gr did not change substantially after the bending tests, indicating that the surface resistance of PDMS with low Gr concentration does not change substantially after bending. However, for samples with higher Gr concentrations (>5 wt.%), the cross-sectional morphology observed after 500 bending cycles was substantially different from that observed before the bending tests. In particular, the lamellar structure of PDMS with high Gr concentrations was visibly disrupted after the bending tests, leading to an increase in the surface resistance of PDMS. Cross-sectional SEM images of PDMS samples with 1 wt.% Gr and 20 wt.% Gr before and after bending tests.
Mechanical, electrical and morphology of Gr-CNT-PDMS NCPs before and after bending and machine washing
On the basis of the aforementioned findings, we selected the PDMS sample with 15% Gr to investigate the influence of one-dimensional (CNT) and two-dimensional (Gr) nanomaterials on the characteristics of flexible PDMS. We processed this sample by using the same preparation and characterization techniques as those used for the aforementioned samples. Specifically, we added different concentrations of CNTs to the PDMS sample with 15% Gr and then measured the corresponding Shore hardness. Figure 7(a) illustrates the measurement results. As the CNT concentration increased, the hardness of the Gr-CNT-PDMS samples also increased; the rate of increase was higher than that observed when the same proportion of Gr was added. The hardness of 15% Gr-PDMS with 5% CNTs was 2.5 times higher than that of 20% Gr-PDMS NCPs. This can be attributed to the entwining and linking of CNTs in the PDMS substrate, resulting in a faster increase in hardness than that in the pure Gr-doped PDMS substrate. Additionally, we calculated CV values to evaluate the dispersion uniformity of the CNTs. Figure 7(b) displays the calculation results. The CV values ranged from 2% to 5%, indicating that the CNTs were favorably dispersed in the PDMS substrate as their concentration increased. Figure 7(c) presents the surface resistance of the Gr-CNT-PDMS NCPs, indicating that their resistance increased with the proportion of CNTs; hence, the addition of CNTs can improve both the mechanical and electrical properties of flexible PDMS. Compared with the Gr-PDMS samples, the Gr-CNT-PDMS NCPs exhibited a higher rate of decrease in resistance when the same proportion of Gr was added. For example, the surface resistance of the PDMS sample with 15% Gr and 5% CNTs was lower than that of the PDMS with 20% Gr by approximately 34%. This can be attributed to the establishment of new conductive paths between Gr and CNTs in the Gr-CNT-PDMS NCPs, resulting in a faster decrease in resistance than that observed in the pure Gr-doped PDMS NCPs. Figure 7(d) shows the CV values derived for the CNT-Gr-PDMS NCPs, indicating that the dispersion of the CNTs in the PDMS matrix was superior to that observed in the Gr-PDMS NCPs. The CV values ranged from 2% to 5%, signifying good dispersion of CNTs. (a) Shore hardness and (b) corresponding CV values derived for CNT-Gr-PDMS NCPs as a function of CNT concentration; (c) surface resistance and (d) corresponding CV values derived for CNT-Gr-PDMS NCPs as a function of CNT concentration.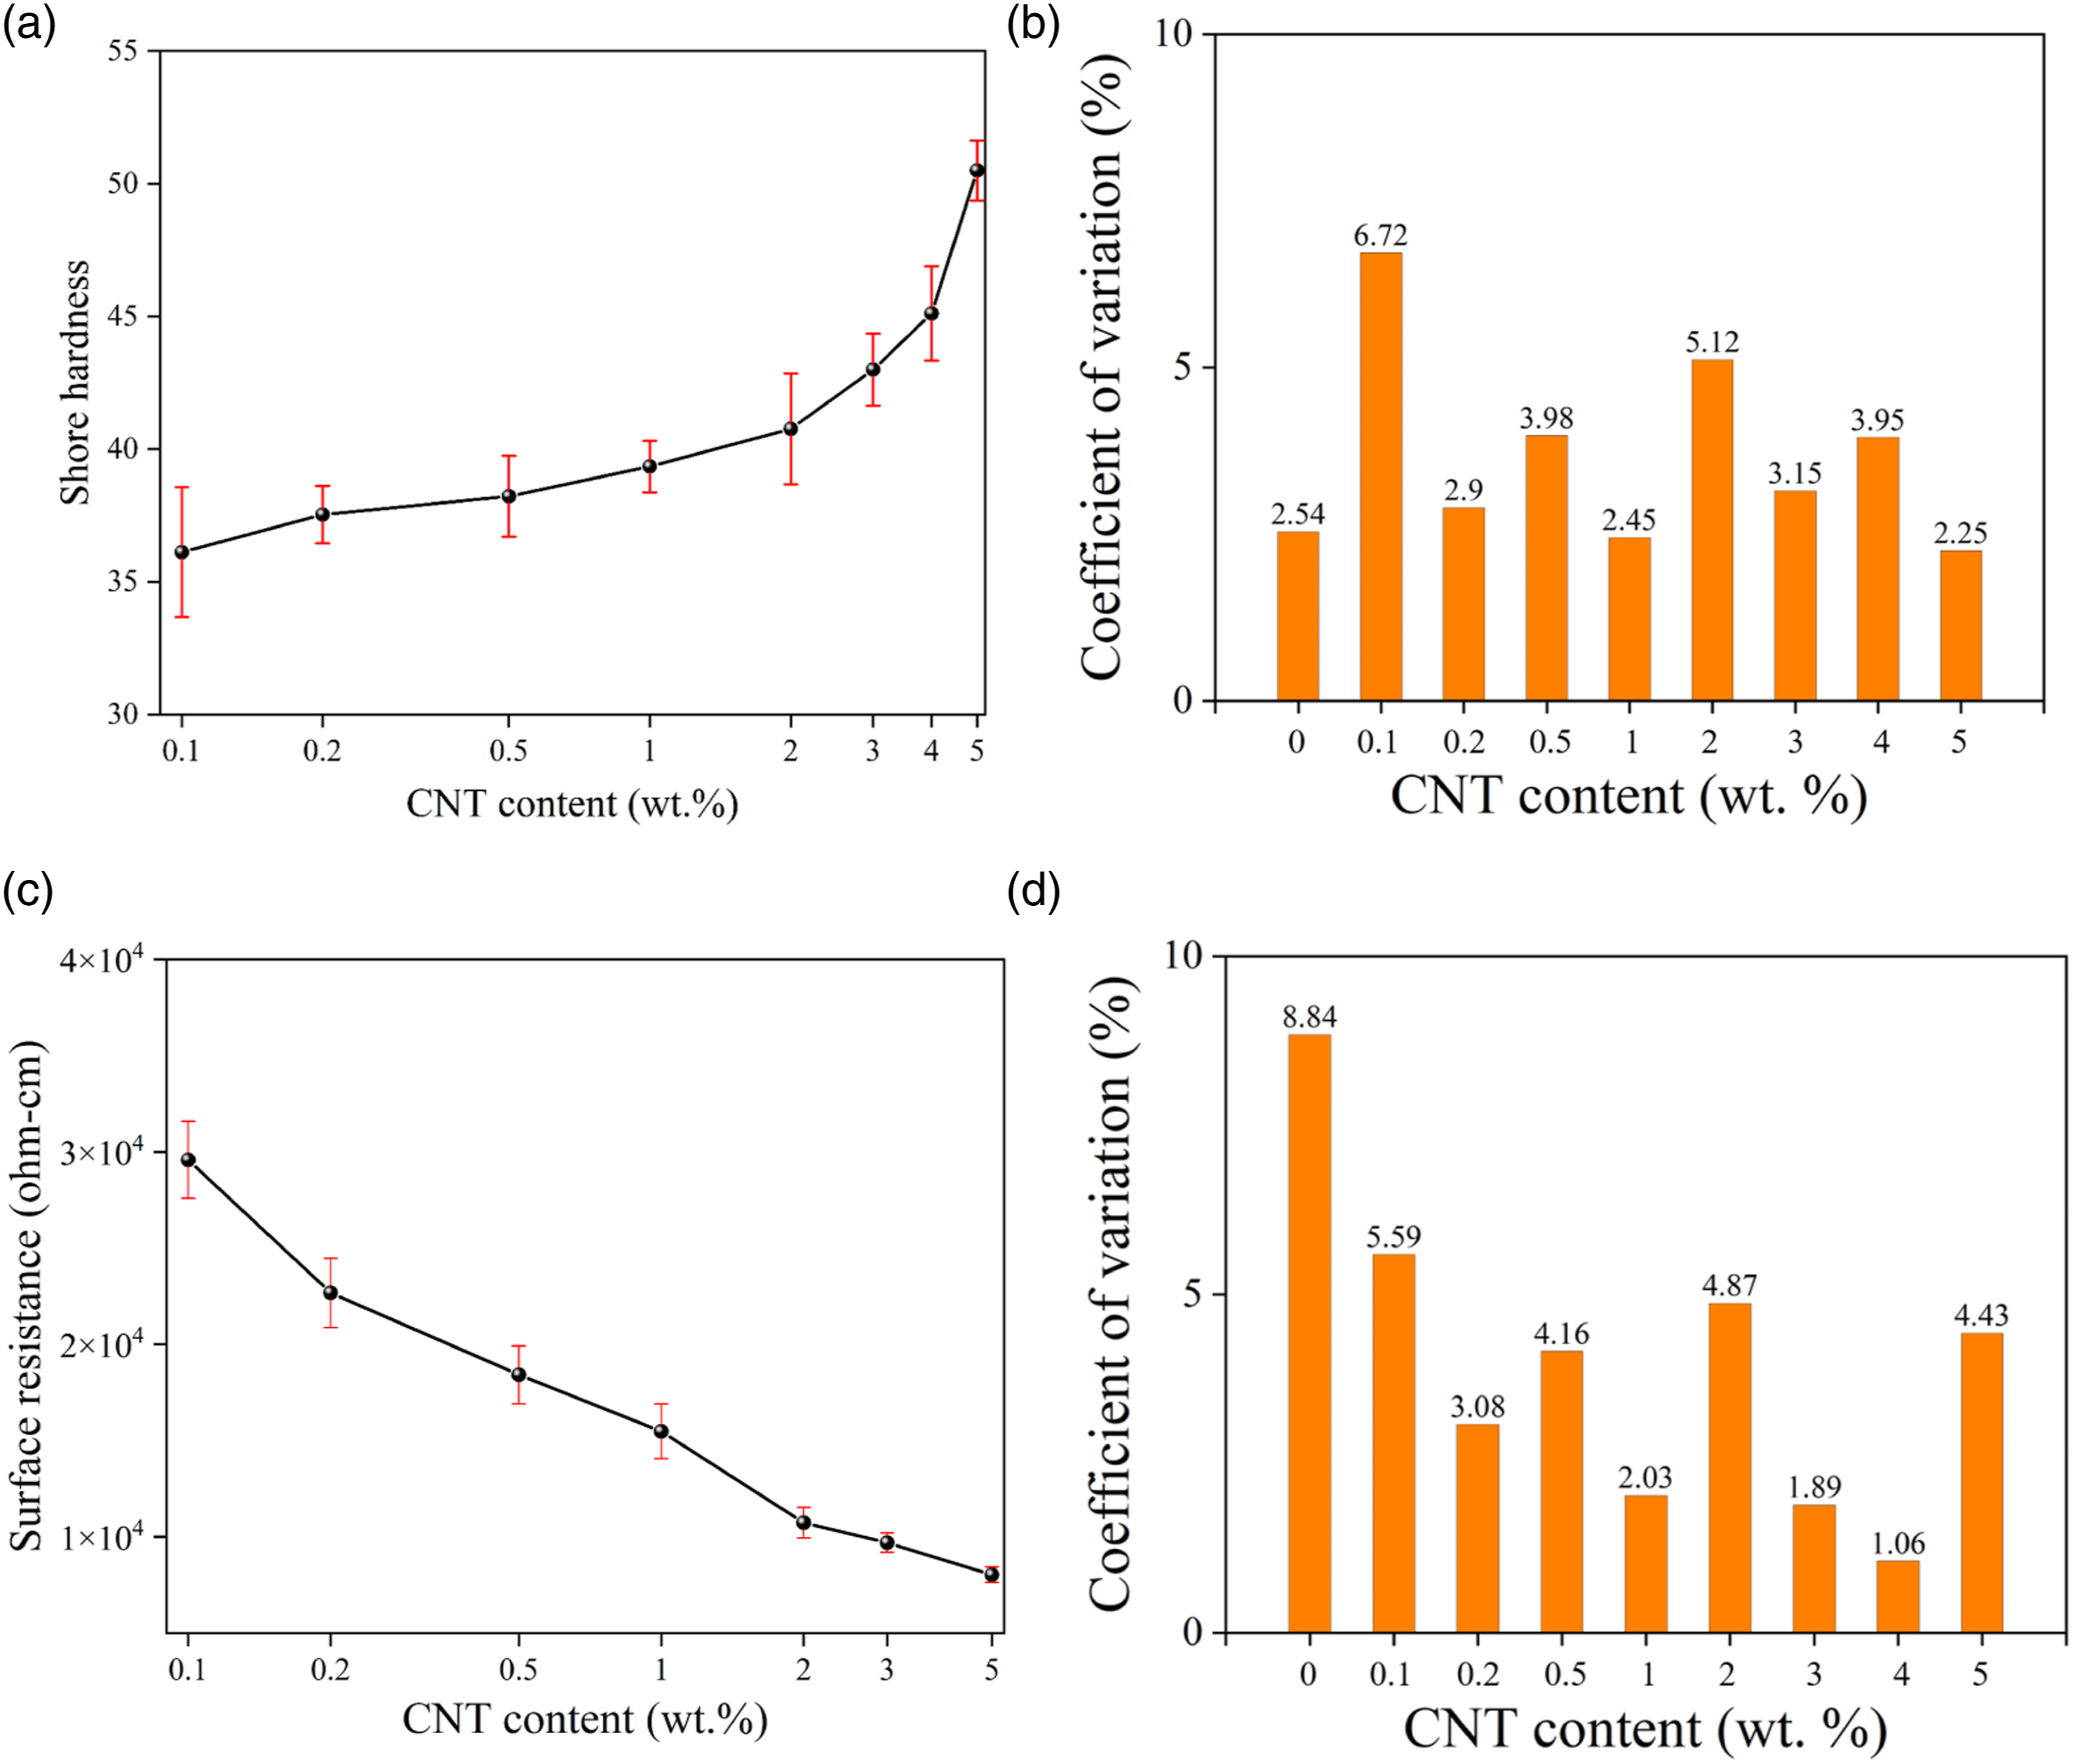
Figure 8 shows the cross-sectional SEM images of the 15 wt.% Gr-PDMS sample doped with different CNT concentrations (0.5 wt.% and 2 wt%). The 15 wt.% Gr-PDMS sample without adding CNT exhibited a laminar structures within polymer matrix, as shown in Figure 4. However, when 0.5 wt.% CNT was added, the Gr-PDMS sample exhibited a slightly granular structure. Increasing the Gr concentration resulted in a more apparent formation of granular structures of larger size within the PDMS matrix. The addition of Gr to PDMS resulted in the formation of a laminar structure within the polymer. This was likely due to the flake-like morphology and high aspect ratio of the Gr particles, which hindered the mobility of the PDMS chains during curing and led to a layered orientation. However, when CNTs were introduced in addition to Gr-PDMS mixture, the laminar structure disappeared, possibly due to the strong interaction between the CNTs and the PDMS chains, which promoted a more homogeneous dispersion of the fillers and prevented the formation of graphite-rich domains. The CNTs may have also acted as a surfactant to reduce the interfacial energy between the graphite and the PDMS matrix. These findings suggest that the combination of Gr and CNT in PDMS composites can lead to complex microstructures, which depend on the interplay between the morphology and properties of the fillers and the polymer matrix. Cross-sectional SEM images of 15 wt.% Gr-PDMS sample with adding 0.5 wt.% and 2 wt.% CNT.
Figure 9(a) illustrates the changes in resistance observed after various cycles of mechanical bending tests for the Gr-CNT-PDMS NCPs with different CNT concentrations. The change in resistance observed after 400 bending cycles for the PDMS sample with 15% Gr but without CNTs was approximately 0.9% (Figure 5(a)). By contrast, the change in resistance observed for the Gr-CNT-PDMS NCPs ranged between 0.3% and 0.4%. This can be attributed to the entanglement and bending of the CNTs within the PDMS matrix, which increased the deformation tolerance. Furthermore, the addition of CNTs prevented the deformation-induced rupture of bridges formed by the CNTs, resulting in the stable and small resistance change. To investigate the effects of CNTs on the electrical properties of the Gr-CNT-PDMS NCPs, we performed machine-washing tests on the PDMS NCPs that were doped with 15% Gr and with different concentrations of CNT; we then analyzed the resulting changes in resistance before and after washing. Figure 7(b) displays the analysis results. Although the change in resistance increased with the number of washing cycles, the change in resistance in the Gr-CNT-PDMS NCPs was only half of that in the pure Gr-doped samples, demonstrating the importance of CNTs in bridging between Gr. Changes in resistance observed in CNT-Gr-PDMS NCPs with different CNT concentrations after different cycles of (a) machine bending and (b) machine washing.
Conclusions
This study investigated the application of graphene (Gr) in polydimethylsiloxane (PDMS) films and the influence of carbon nanotubes (CNTs) on their performance. As the concentration of Gr increased, the hardness of the Gr-PDMS NCPs also increased. This increase in hardness was attributed to the dispersion strengthening effect, similar to metallic materials, where uniformly distributed second-phase, Gr, impeded dislocations and increased the strength of NCPs. The layered Gr anchored PDMS chains, limiting their extension, torsion, and deformation, thereby increasing the hardness of Gr-PDMS NCPs. The coefficient of variation (CV) values indicated that the degree of dispersion of Gr in PDMS increased with the Gr concentration, except for concentrations above 0.5% where aggregation occurred, resulting in higher CV values.
The surface resistance of the Gr-PDMS films decreased as the Gr concentration increased. The decrease in resistance occurred in four stages, where Gr formed a connected network within PDMS, transitioning from point or line contacts to surface contacts. However, at high Gr concentrations, the connected network approached saturation, resulting in no substantial change in resistance. Bending tests were performed on the Gr-PDMS films, and the changes in resistance were measured. As the Gr concentration and the number of bending cycles increased, the changes in resistance also increased. At higher concentrations, the tension at the Gr-PDMS interface caused separation, resulting in increased resistance. Machine washing of the Gr-PDMS films also led to an increase in resistance. The change in resistance before and after washing increased with the number of cycles and with higher Gr concentrations. The separation of Gr particles from the PDMS surface caused an increase in resistance. SEM images showed that the addition of Gr to PDMS resulted in the formation of laminar structures within the PDMS matrix. The formation of these structures was attributed to the high aspect ratio and aggregation tendency of Gr. The addition of CNTs along with Gr disrupted the laminar structure, and the CNTs dispersed more uniformly within the PDMS matrix. The hardness of the Gr-CNT-PDMS films increased with increasing CNT concentration, and the surface resistance decreased. The addition of CNTs also improved the resistance to bending and washing tests, resulting in smaller changes in resistance. Further research is warranted to explore the long-term durability and reliability of these materials under various environmental conditions.
Footnotes
Declaration of conflicting interests
The author(s) declared no potential conflicts of interest with respect to the research, authorship, and/or publication of this article.
Funding
The author(s) disclosed receipt of the following financial support for the research, authorship, and/or publication of this article: This work was supported by the Taichung Veterans General Hospital/National Chi Nan University Joint Research Program, Grant Number TCVGH-NCNU-1107902.