
Abstract
The present study focuses on maximum compressive force of honeycomb structures produced from polylactic acid (PLA) and acrylonitrile butadiene styrene filament using an Ultimaker hot plate 3D printer. A honeycomb structure with an equal surface area and three different cell sizes and wall thickness was designed. The samples were produced with a cell width (d) of 6 mm, 9 mm, 12 mm, a cell wall thickness (t) of 0.8 mm, 1.2 mm, 1.6 mm and a cell height (h) of 10 mm, 20 mm and 30 mm for each cell width, respectively. The produced samples were weighed in order to calculate their porosity percentages. During the compression test, the highest compressive force was obtained from the samples produced from PLA filament with a cell height of 10 mm, a width of 12 mm and a wall thickness of 1.6 mm. Similarly, a detailed finite elements analysis of three structures with different cell widths and thicknesses using ANSYS® software yielded results similar to the experimental study. ANSYS® results were reliable in the range of approximately 81–98%. Thus, although the cell width in honeycomb structures with an equal surface area was increased using both experimental and finite elements method, it was observed that the wall thickness was directly proportional to a higher maximum compressive force.
Introduction
Honeycomb sandwich composite structures offer a number of advantages such as lightness, a higher impact and compressive strength, resistance to chemicals and water depending on its material as well as ease of use in screwing, puncturing and repair. Therefore, they are used in various sectors and products such as automotive, light commercial vehicles, yachts, speed trains, wind power, solar power panels, domestic appliances, prefabricated houses, construction, packaging, handbags and luggages. 1
There are studies on the mechanical properties of honeycomb sandwich composites in the literature so far. These studies aimed to determine and improve the mechanical properties of sandwich composites produced with traditional methods in different materials, sizes, methods and geometries.
In the researches, the mechanical properties of sandwich composite structures produced by hand lay-up and compression molding, 2 vacuum assisted resin infusion (VARIP) methods 3 were investigated. Face sheets of sandwich panels carbon fiber reinforced composite (CFRP),3-9 glass fiber reinforced composite (GFRP),2,6,10-13 aluminum plate,6,12,14-16 PLA,9,13 hemp fiber reinforced composite (HFRP) 17 samples produced from materials were examined. In addition, the mechanical properties of sandwich composite whose core was produced from materials such as carbon fiber reinforced composite, 4 glass fiber reinforced composite, 18 polyvinylchloride (PVC) foam,11,17 aluminum, polypropylene (PP), polypropylene terephthalate (PET), 6 ABS,9,13,19 thermoplastic polyurethane (TPU), 9 PLA,13,19 Nomex®,7,19 wood-reinforced PLA 20 and natural fiber reinforced composite,7,21 ceramic 22 were investigated. Although the majority of the studies consist of sandwich panels with honeycomb geometry, there are studies with different geometries such as kelvin foam, 23 square, triangle20,22 octagon. 20 In experimental and numerical studies, compression,2,4-8,12,13,15,16,24 tensile,2,14,19,20 impact,7,11,13,14,17,18,25 bending7,8,10,14,20 mechanical properties of sandwich panels were investigated.
In recent years, the additive manufacturing method has started to find more and more widespread use in the industry and has been the focus of attention of many researchers. Computer Aided Design (CAD) geometries prepared in the additive manufacturing method are produced in layers in three-dimensional printers. This enables complex structures to be produced easily in production. When the literature is examined, it is seen that there are many studies on the determination of the mechanical properties of honeycomb structures made with materials used in additive manufacturing. Gohar et al. 9 investigated the mechanical properties of composite sandwich structures produced by 3D printer in different combinations and printing angles from PLA, carbon fiber reinforced PLA, TPU, ABS filaments. Solmaz and Çelik 13 investigated the cell width, cell wall thickness and compressive strength of cell height in honeycomb sandwich structures. They reported that a higher cell width and height with a fixed wall thickness decreased the compressive strength, while a higher wall thickness with the same cell size increased the compressive strength. Pollard et al. 19 produced samples from ABS and PLA materials using a 3D printer by changing different parameters such as cell wall thickness, filament flow rate and printing modes to analyze thir tensile and compressive strength. The compression tests demonstrated that the samples with a thick wall displayed a more ductile behavior compared to those with a thin wall and that the compressive strength of ABS and PLA samples were much higher compared to Nomex® samples. Ayrilmis et al. 20 produced the cores of sandwich structures as square, hexagonal and octagonal from wood/PLA filament using a 3D printer. As the filling ratio of the cores increased, the hexagonal core had the best mechanical properties, followed by the square and octagonal cores, respectively.
It can be inferred from the studies in the existing literature that several studies analyzed compressive strength in different surface areas by keeping and/or changing cell size and wall thickness parameters thanks to the use of different materials. On the other hand, the present study increases both cell size and wall thickness parameters in a honeycomb structure in order to carry out experimental and numerical studies on the compressive strength of the samples produced from PLA and ABS filaments using a 3D printer.
Materials and method
The samples were designed in accordance with ASTM C365-16
26
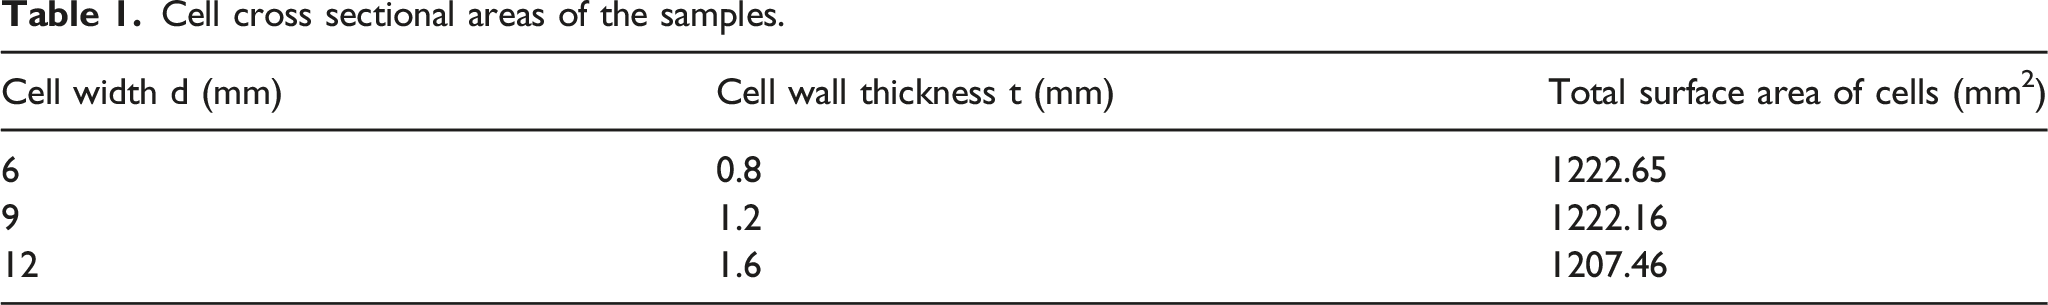
standards with the minimum compression surface area being 5625 mm2 (75 mm × 75 mm) and produced using a 3D printer on SOLIDWORKS® 2018 CAD software. To construct a square, the center of the inner tangent circle of a honeycomb cell was determined as the intersection of the diagonals of a square measuring 75 mm in width (W) and 75 mm in length (L). The compression surface areas of the samples were cut in a square-shaped structure from a honeycomb panel with a cell width of 6 mm, 9 mm, 12 mm and a wall thickness of 0.8 mm, 1.2 mm, 1.6 mm respectively (Figure 1(a) and (b)). (a) Displaying the dimensions of honeycomb structures in SOLIDWORKS® 2018 CAD design; (b) Display of three different cell widths and wall thicknesses as a single honeycomb in SOLIDWORKS® 2018 CAD design.
Cell cross sectional areas of the samples.
The G codes we used in the printer were obtained from the Ultimaker Cura 4.7.0
27
Computer Aided Manufacturing (CAM) software. The Ultimaker 2+
28
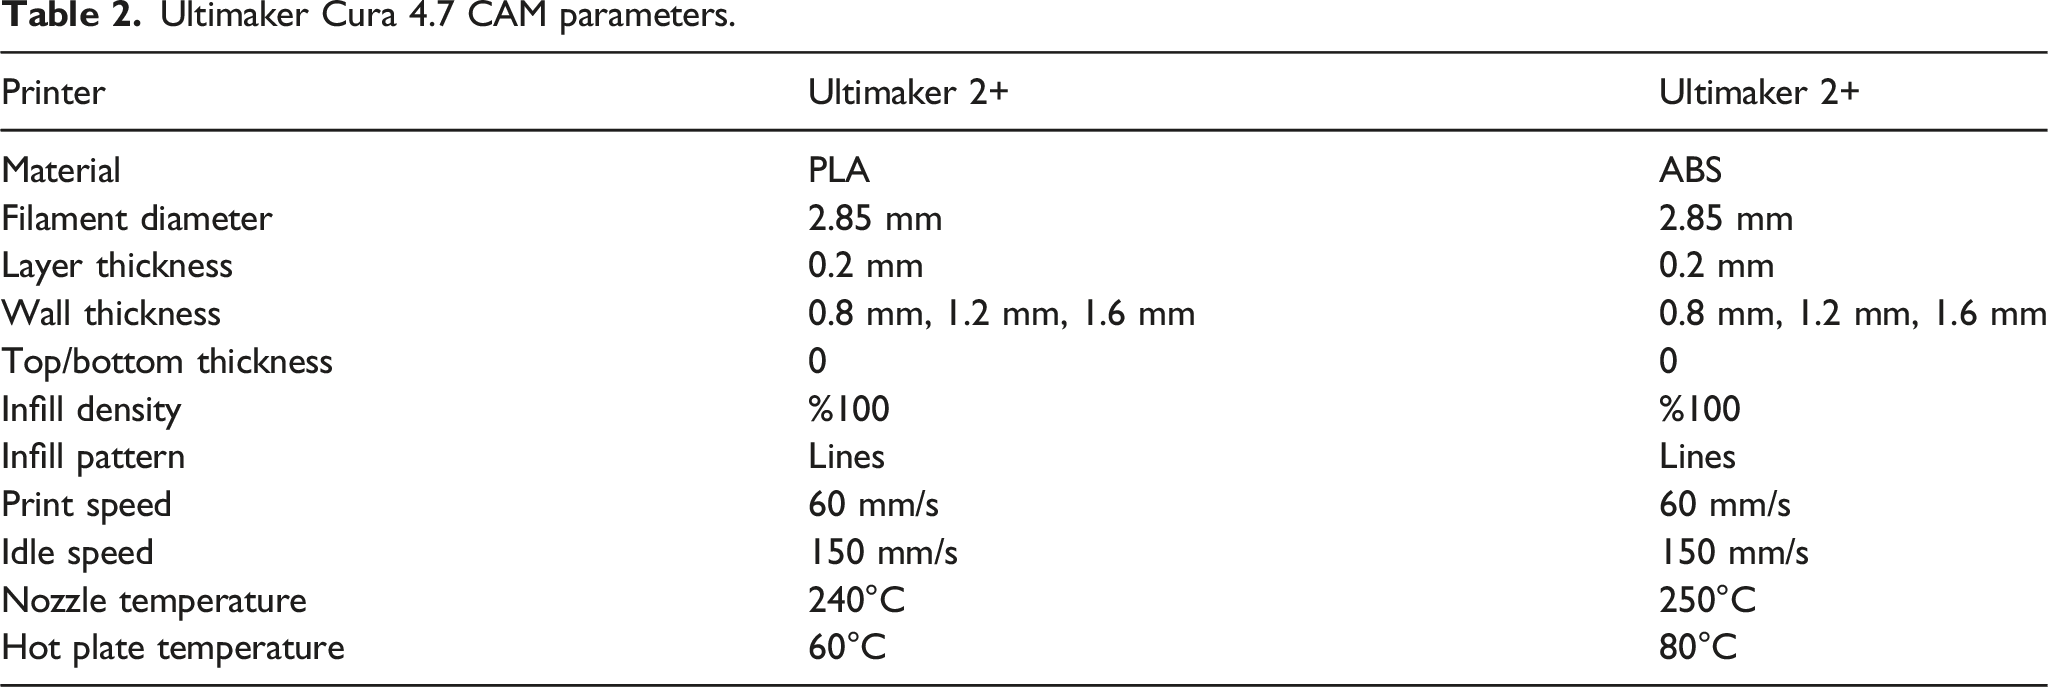
printer with a print volume of 223 × 223 × 205 mm, seen in Figure 2(a)–(c), was used in the production of the samples. 3D printer option was selected in Ultimaker Cura 4.7.0 CAM software, and the compression sample saved with an extension of “.stl” SOLIDWORKS® 2018 CAD software was opened. After different settings such as the position and angle of the designed structure on the printer had been adjusted, the parameters in Table 2 were selected to write G codes for the designed structure. (a) Ultimaker 2+ 3D printer; (b) A completed PLA sample; (c) Printing an ABS sample. Ultimaker Cura 4.7 CAM parameters.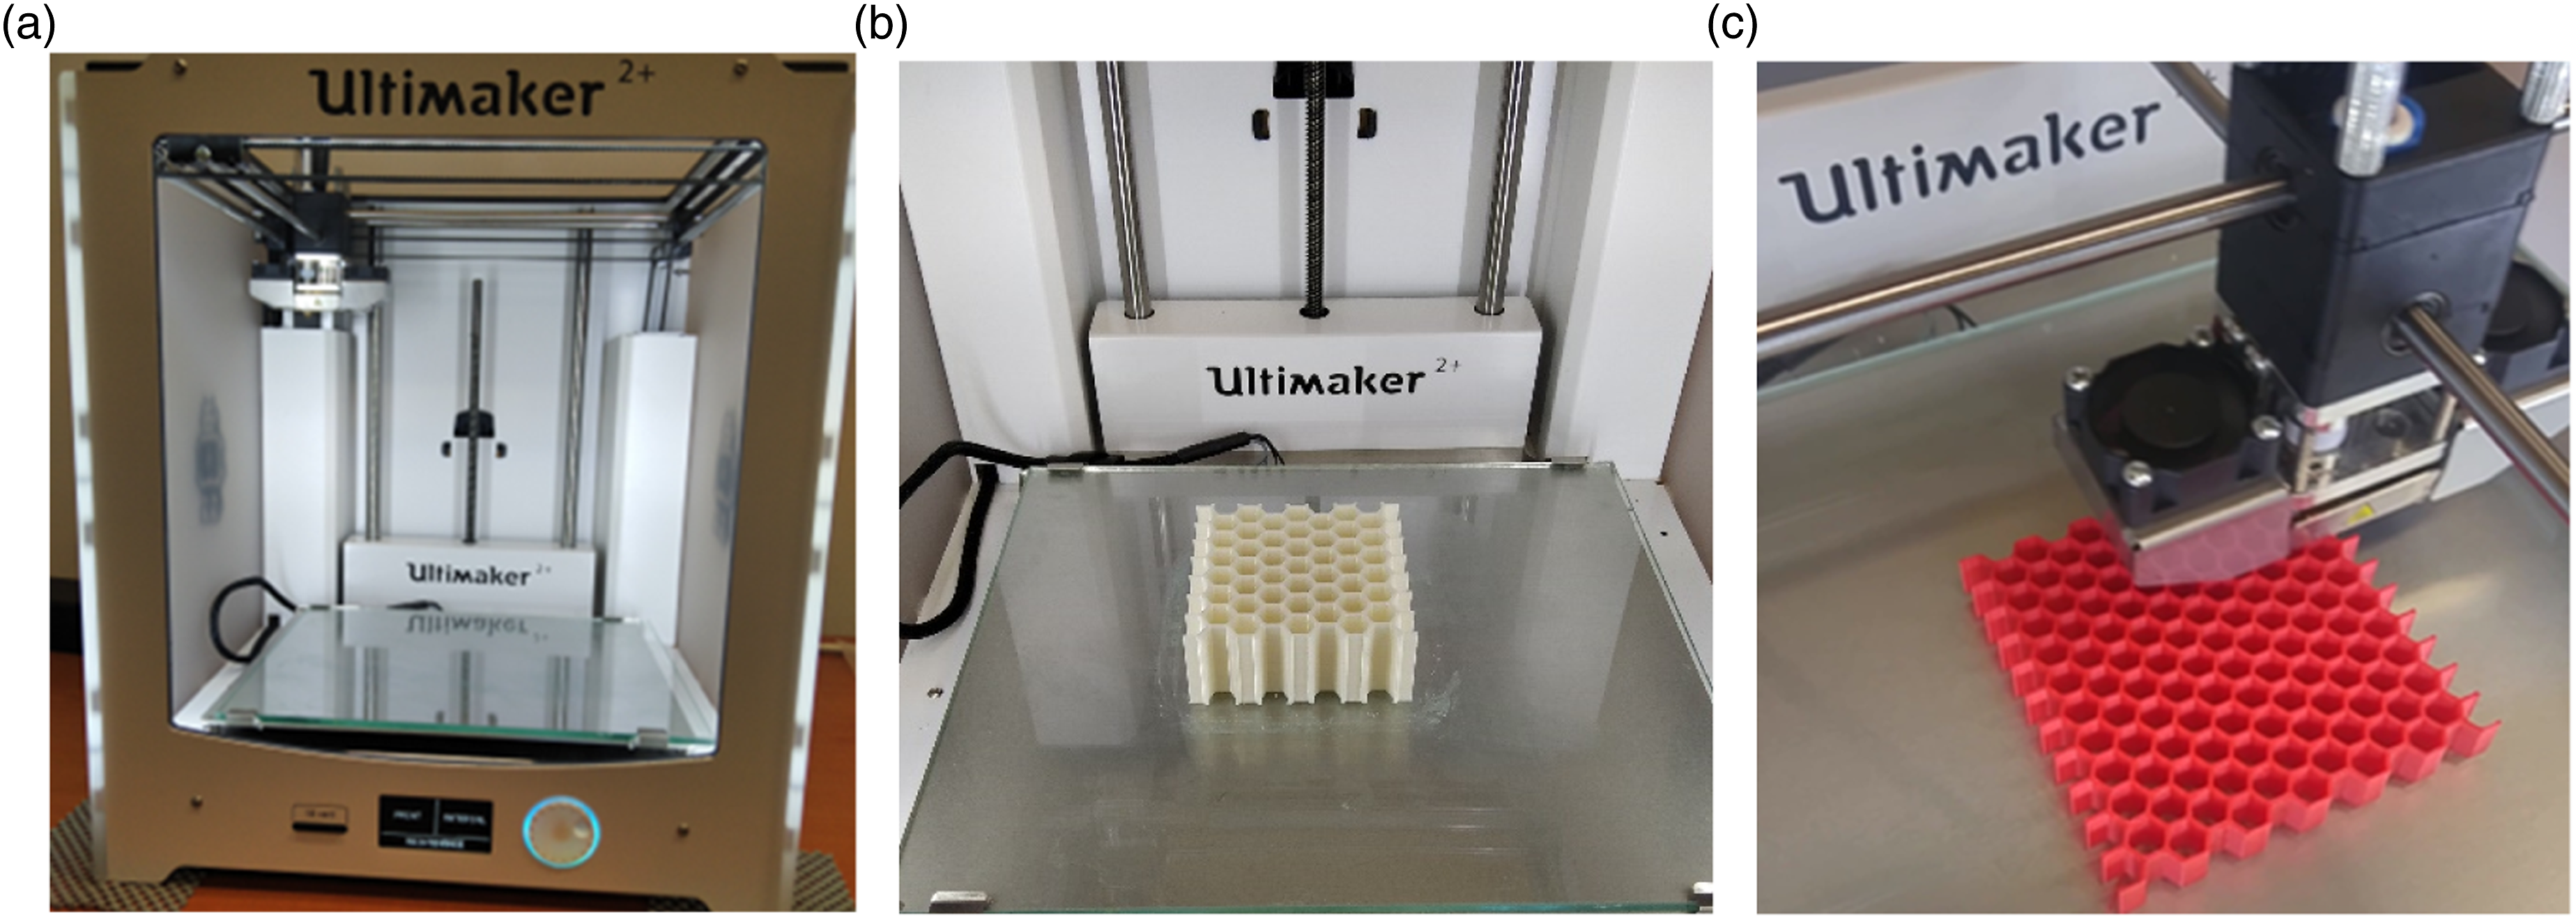
The plate of 3D printer was height adjusted (calibrated) prior to the production of the samples. A white Ultimaker brand PLA filament was used for the 3D printer. A total of 36 PLA compression samples, i.e. Four pieces with a height of 10, 20 and 30 mm for each cell width, were produced. Later, following the calibration of 3D printer, a red Ultimaker brand ABS filament was used for the printer to produce 36 pieces of ABS samples. The hot plate and nozzle temperature of 3D printer were set in accordance with the recommendations on the product tags.
The produced samples were weighed using a KERN PLS 6200-2A (capacity: 6.200 g, precision: 0.01 g) precision scale. As shown in Figure 3(a), Zwick/Roell Z100 with a capacity of 100 kN was used for compression tests which were performed with a speed of 0.5 mm/min in accordance with ASTM C365-16 standards. The yellow template was used to align the diagonal centers of the samples with the center of the compression table. Thus, the compressive strength values of the samples produced with different cell sizes from PLA and ABS filaments using a 3D printer were measured (Figure 3(b) and (c)). (a) Zwick/Roell Z100 compression test device; (b) The template used to align the samples and compression table; (c) Compression test.
Experimental results

Average mass and porosity values of PLA samples.

Average mass and porosity values of ABS samples.

Figure 4 were obtained from the compression tests. It can be observed in Figure 4(a) and (b) that the cell height was inversely proportional to maximum compressive force for PLA and ABS samples with the same cell width and wall thickness values. The highest compression force belonged to PLA_12_1.6_10 samples. Compressive force deformations for PLA and ABS samples with the same cell width and wall thickness values at different cell heights (a) PLA; (b) ABS.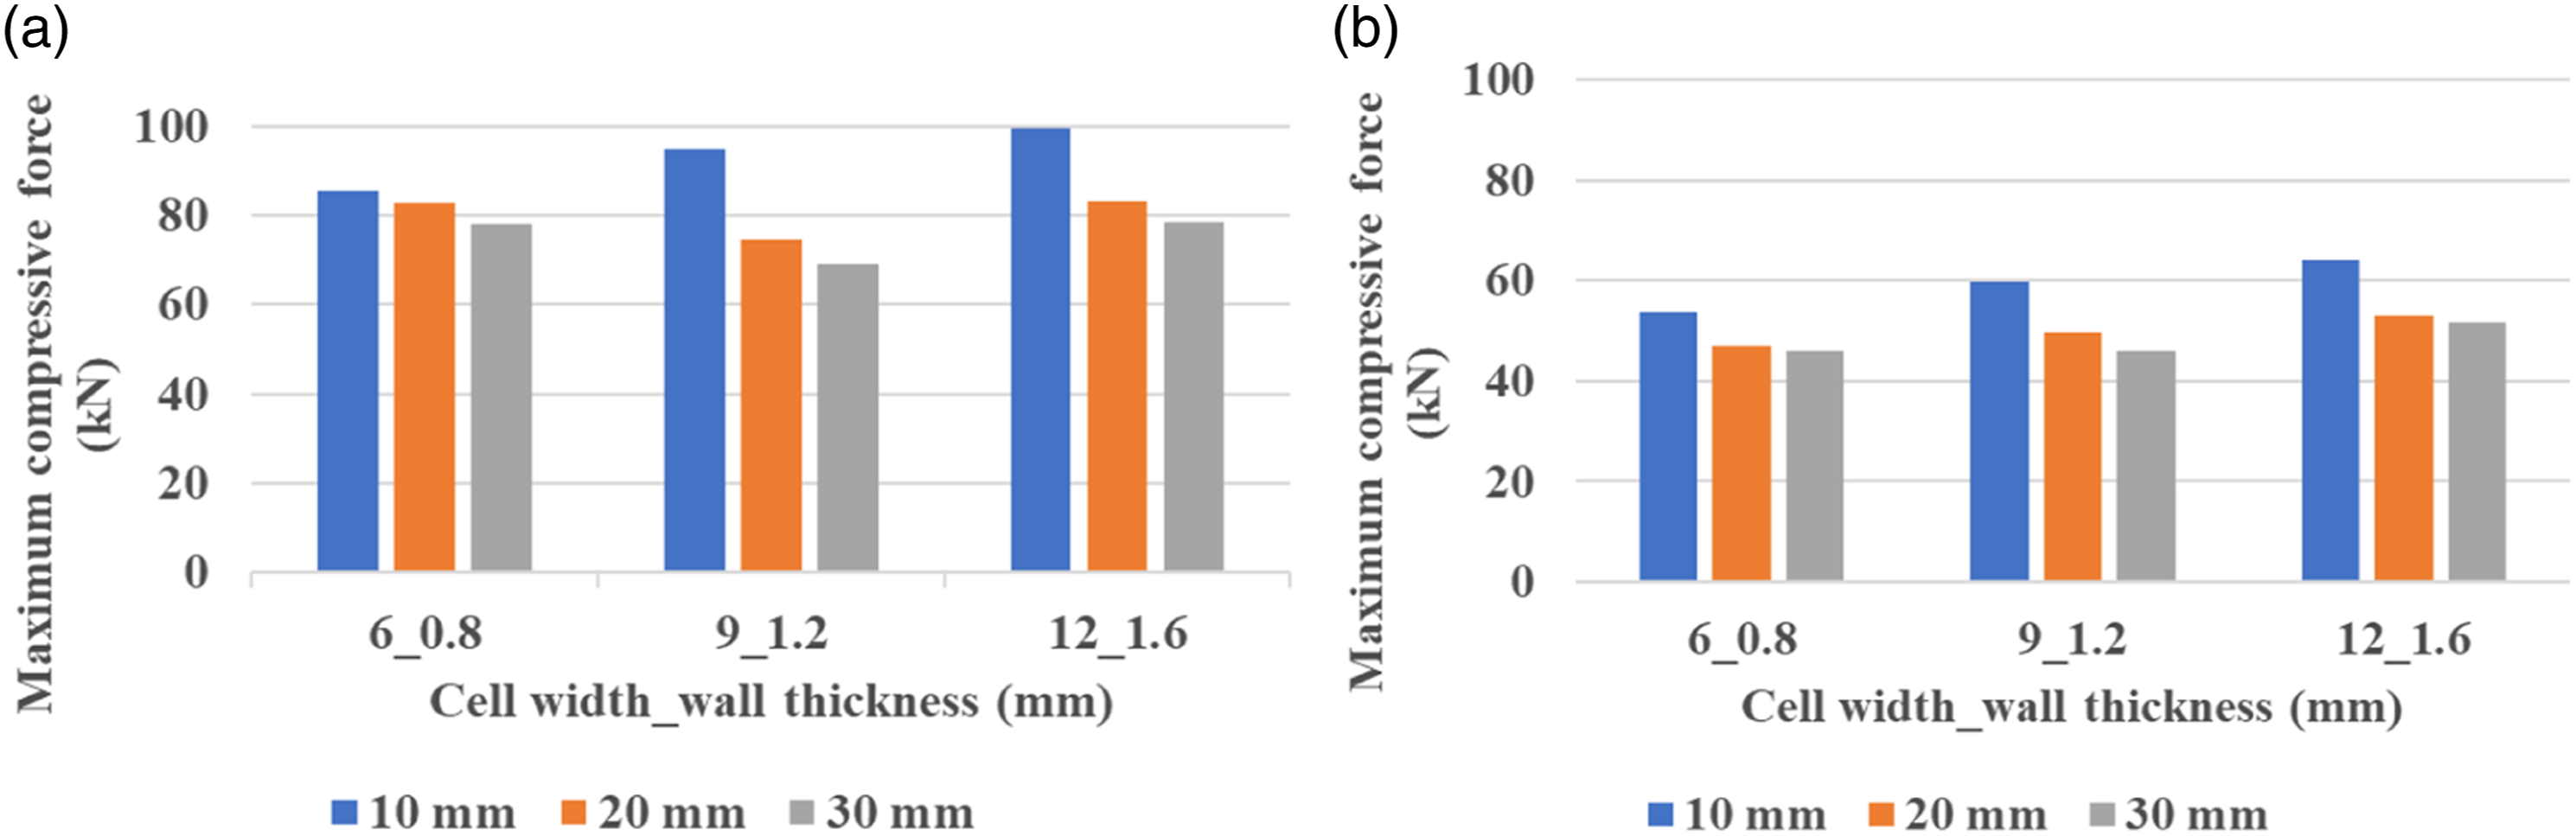
Finite elements model
Mechanical properties of the materials used.

The findings of the compression tests are shown in (Figure 5(a) and (b)). Following the experimental tests, the numerical analysis of the samples was performed using ANSYS® Workbench 18.1 package program. The force-displacement graph of the samples (a) PLA; (b) ABS.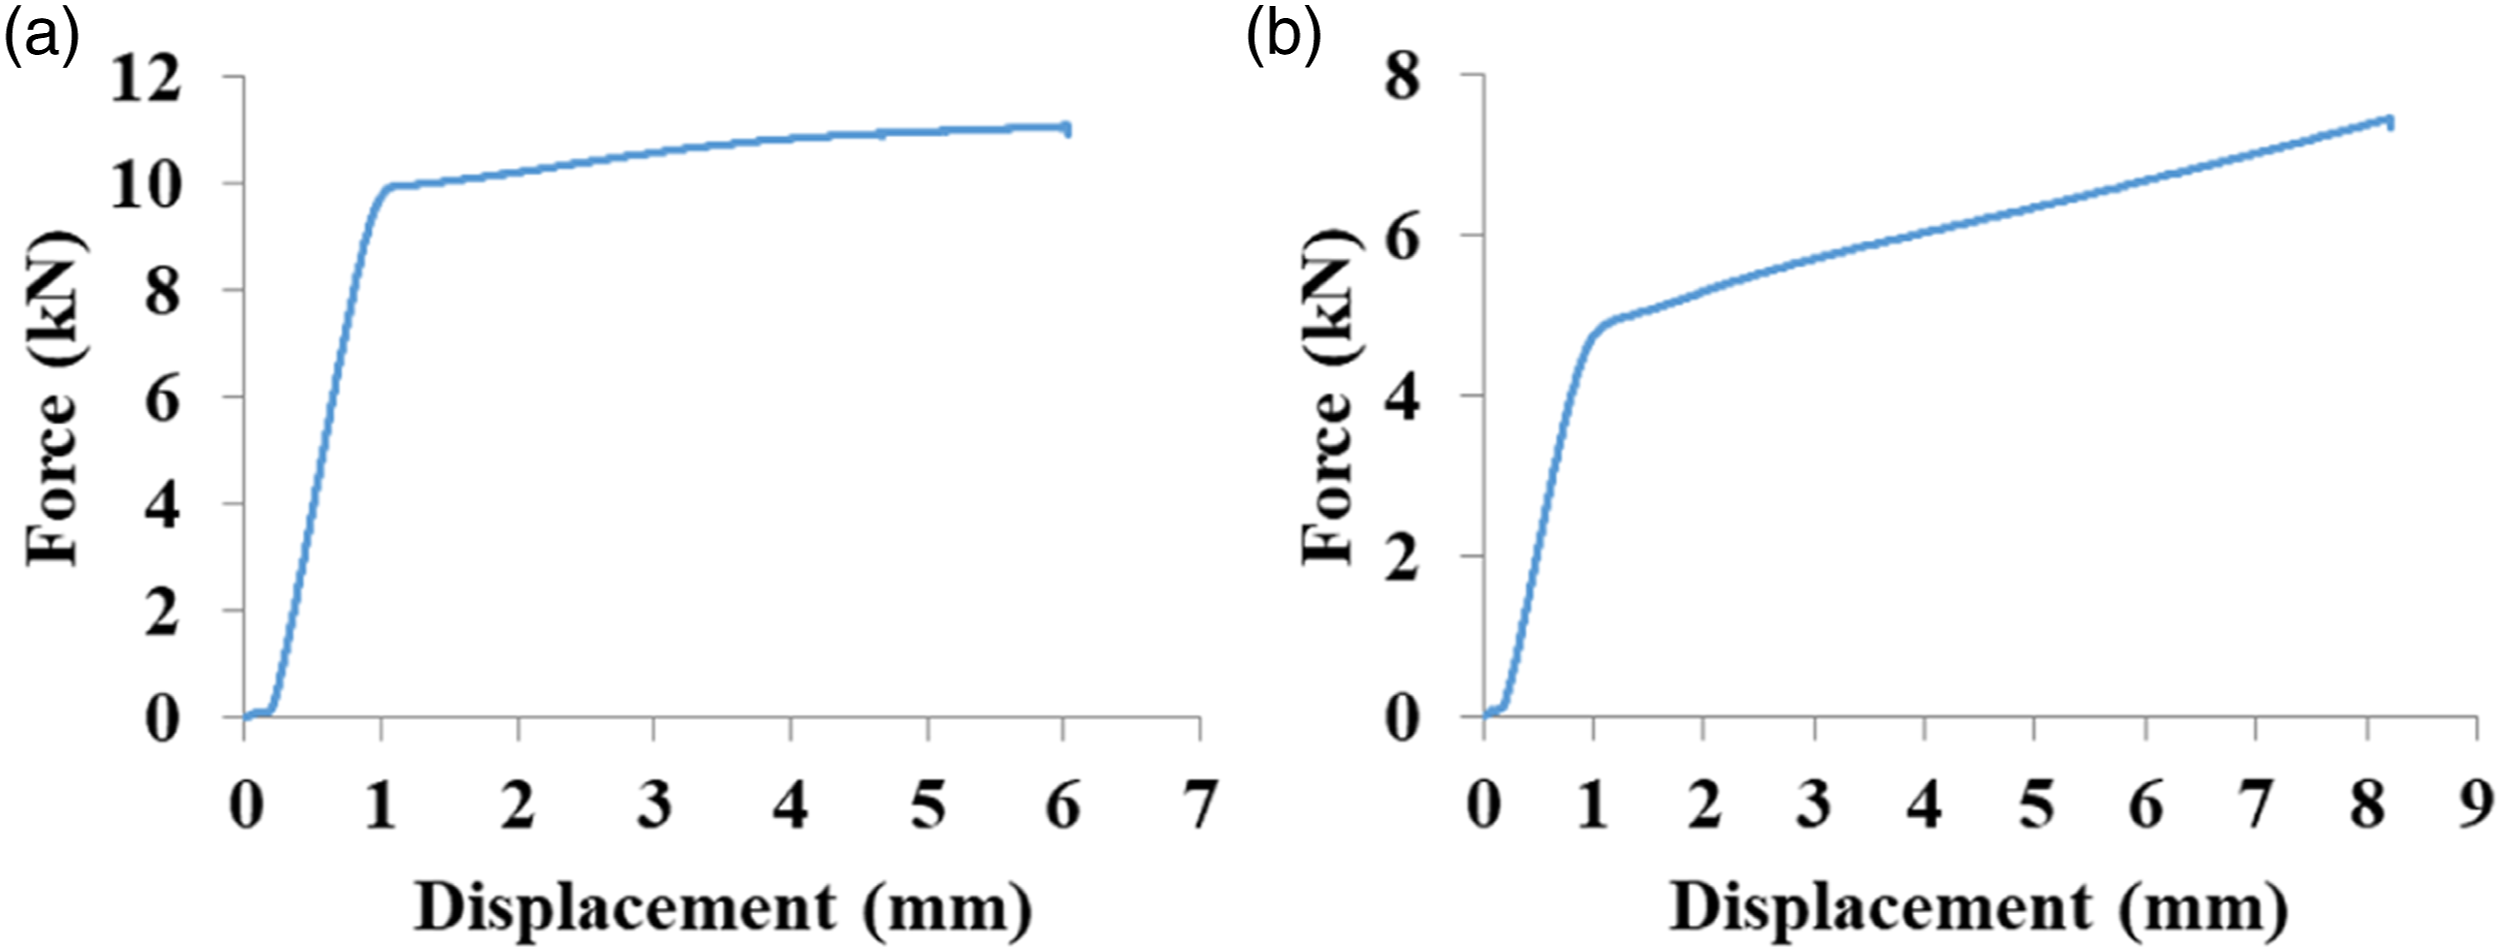
It can be seen in Figure 6(a) that similar to the experimental study, a compressive force was applied to the samples in the numerical analysis through a fixed bottom panel and a gradual compressive force in the y-axis direction on the top. The upper and lower surfaces were included in the analysis and were modeled as rigid elements in this analysis. Frictional contact was defined between the honeycomb structure and the defined surfaces. In this way, more realistic results were obtained. Mesh model of the structure is shown in Figure 6(b). Mesh size of 2 mm and hexahedral mesh type were used in the model. The mesh structure approximately consists of 20,300 elements and 64,000 nodes. (a) Threshold limits and (b) Mesh model for the compressive force model.
To demonstrate the reliability of the mesh structure, a mesh convergence study was conducted. Five different mesh sizes were used for FEA and maximum compressive force results were obtained for each analysis. The result of the mesh independence study for 5500, 12,250, 20,300, 42,600 and 76,500 elements, as shown in Figure 6. Up to 20,300 elements, the force was decreasing continuously. At 76,500 elements, the force appears to change very little. Therefore, in order not to create unnecessary data in the computer field, the number of elements of the analysis was determined as 20,300 (Figure 7). Mesh convergence study for finite element analysis.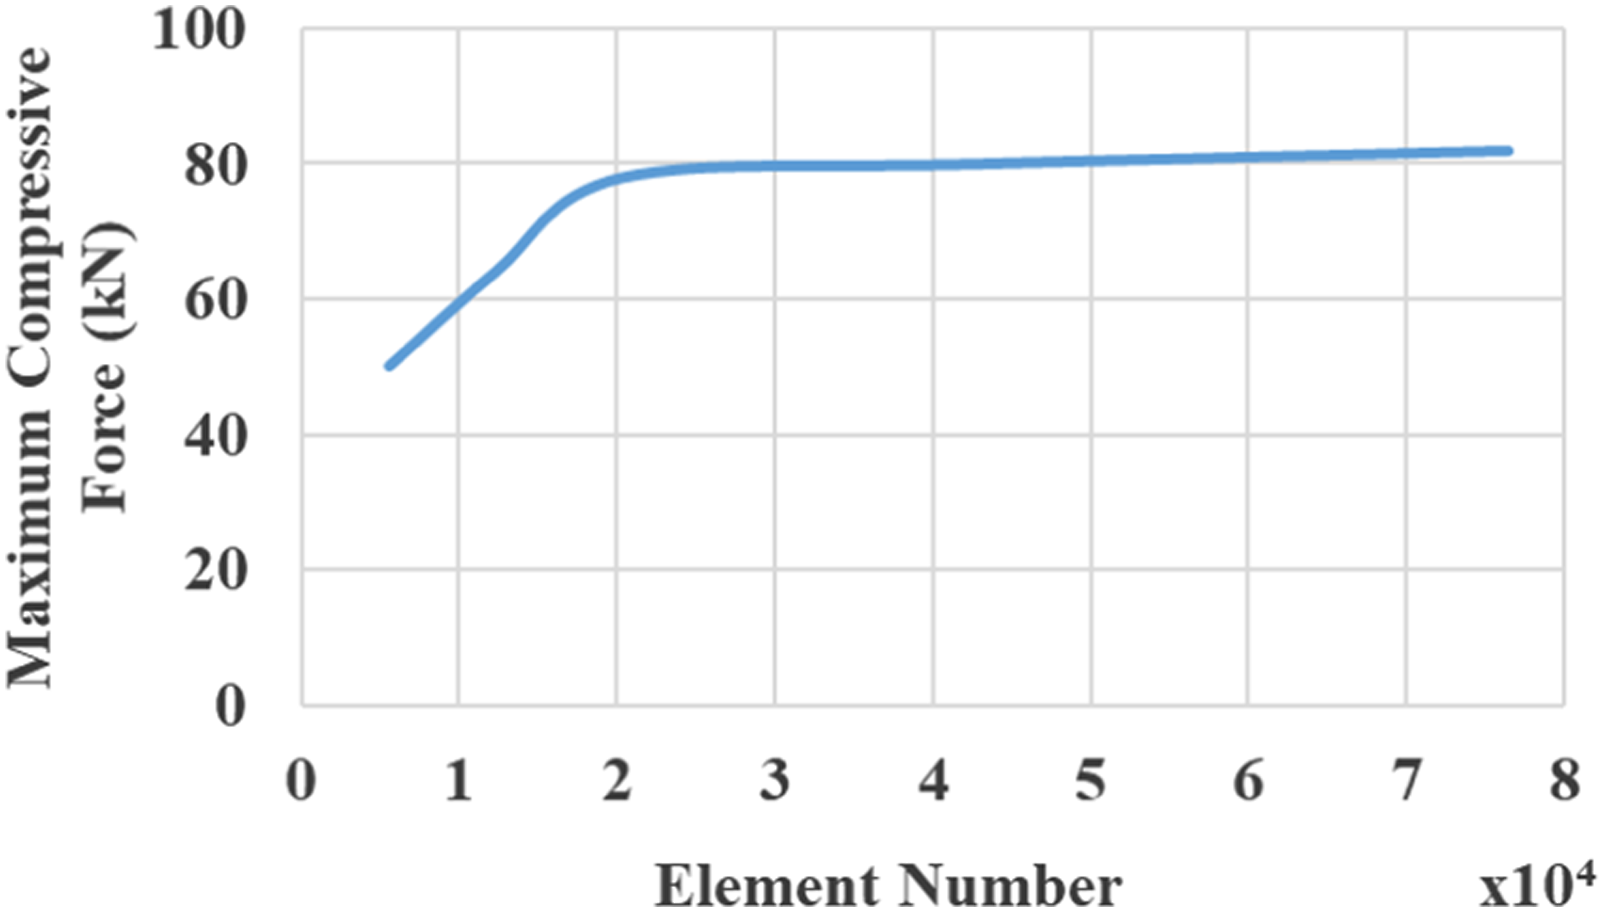
The simulation studies and deformations in the samples following the compression test are shown in (Figure 8(a)–(f)). As can be seen in side-by-side images, the deformations of the samples were similar in the simulation analysis and following the compression test in terms of elastic buckling, plastic buckling and cell wall crush. Static analysis deformation (a) PLA_6_0.8_30; (b) PLA_9_1.2_30; (c) PLA_12_1.6_30; the samples following the compression test (d) PLA_6_0.8_30; (e) PLA_9_1.2_30; (f) PLA_12_1.6_30.
Changes in percentages between maximum compression forces at a cell height of 6 mm and 12 mm in PLA and ABS samples in the experimental and numerical analysis.


Experimental and finite element analysis force-displacement graph of 30 mm cell height PLA_12_1.6 sample compression experiment.
Figure 10 show the maximum compressive forces of PLA and ABS samples made by experimental and finite element analysis according to cell height and cell width. The maximum compression forces obtained by the finite element analysis were higher than the experimental results. While this difference was between 2-19% in PLA samples, it remained between 2–4% in ABS samples. This is because, as seen in Tables 3 and 4, the porosity percentage of PLA samples is higher than ABS samples. The maximum compression force graph of PLA and ABS samples at three different cell heights in the experimental and finite element analysis based on the cell width and wall thickness values (a) PLA_6_0.8; (b) PLA_9_1.2; (c) PLA_12_1.6 (d) PLA_6_0.8; (e) PLA_9_1.2; (f) PLA_12_1.6.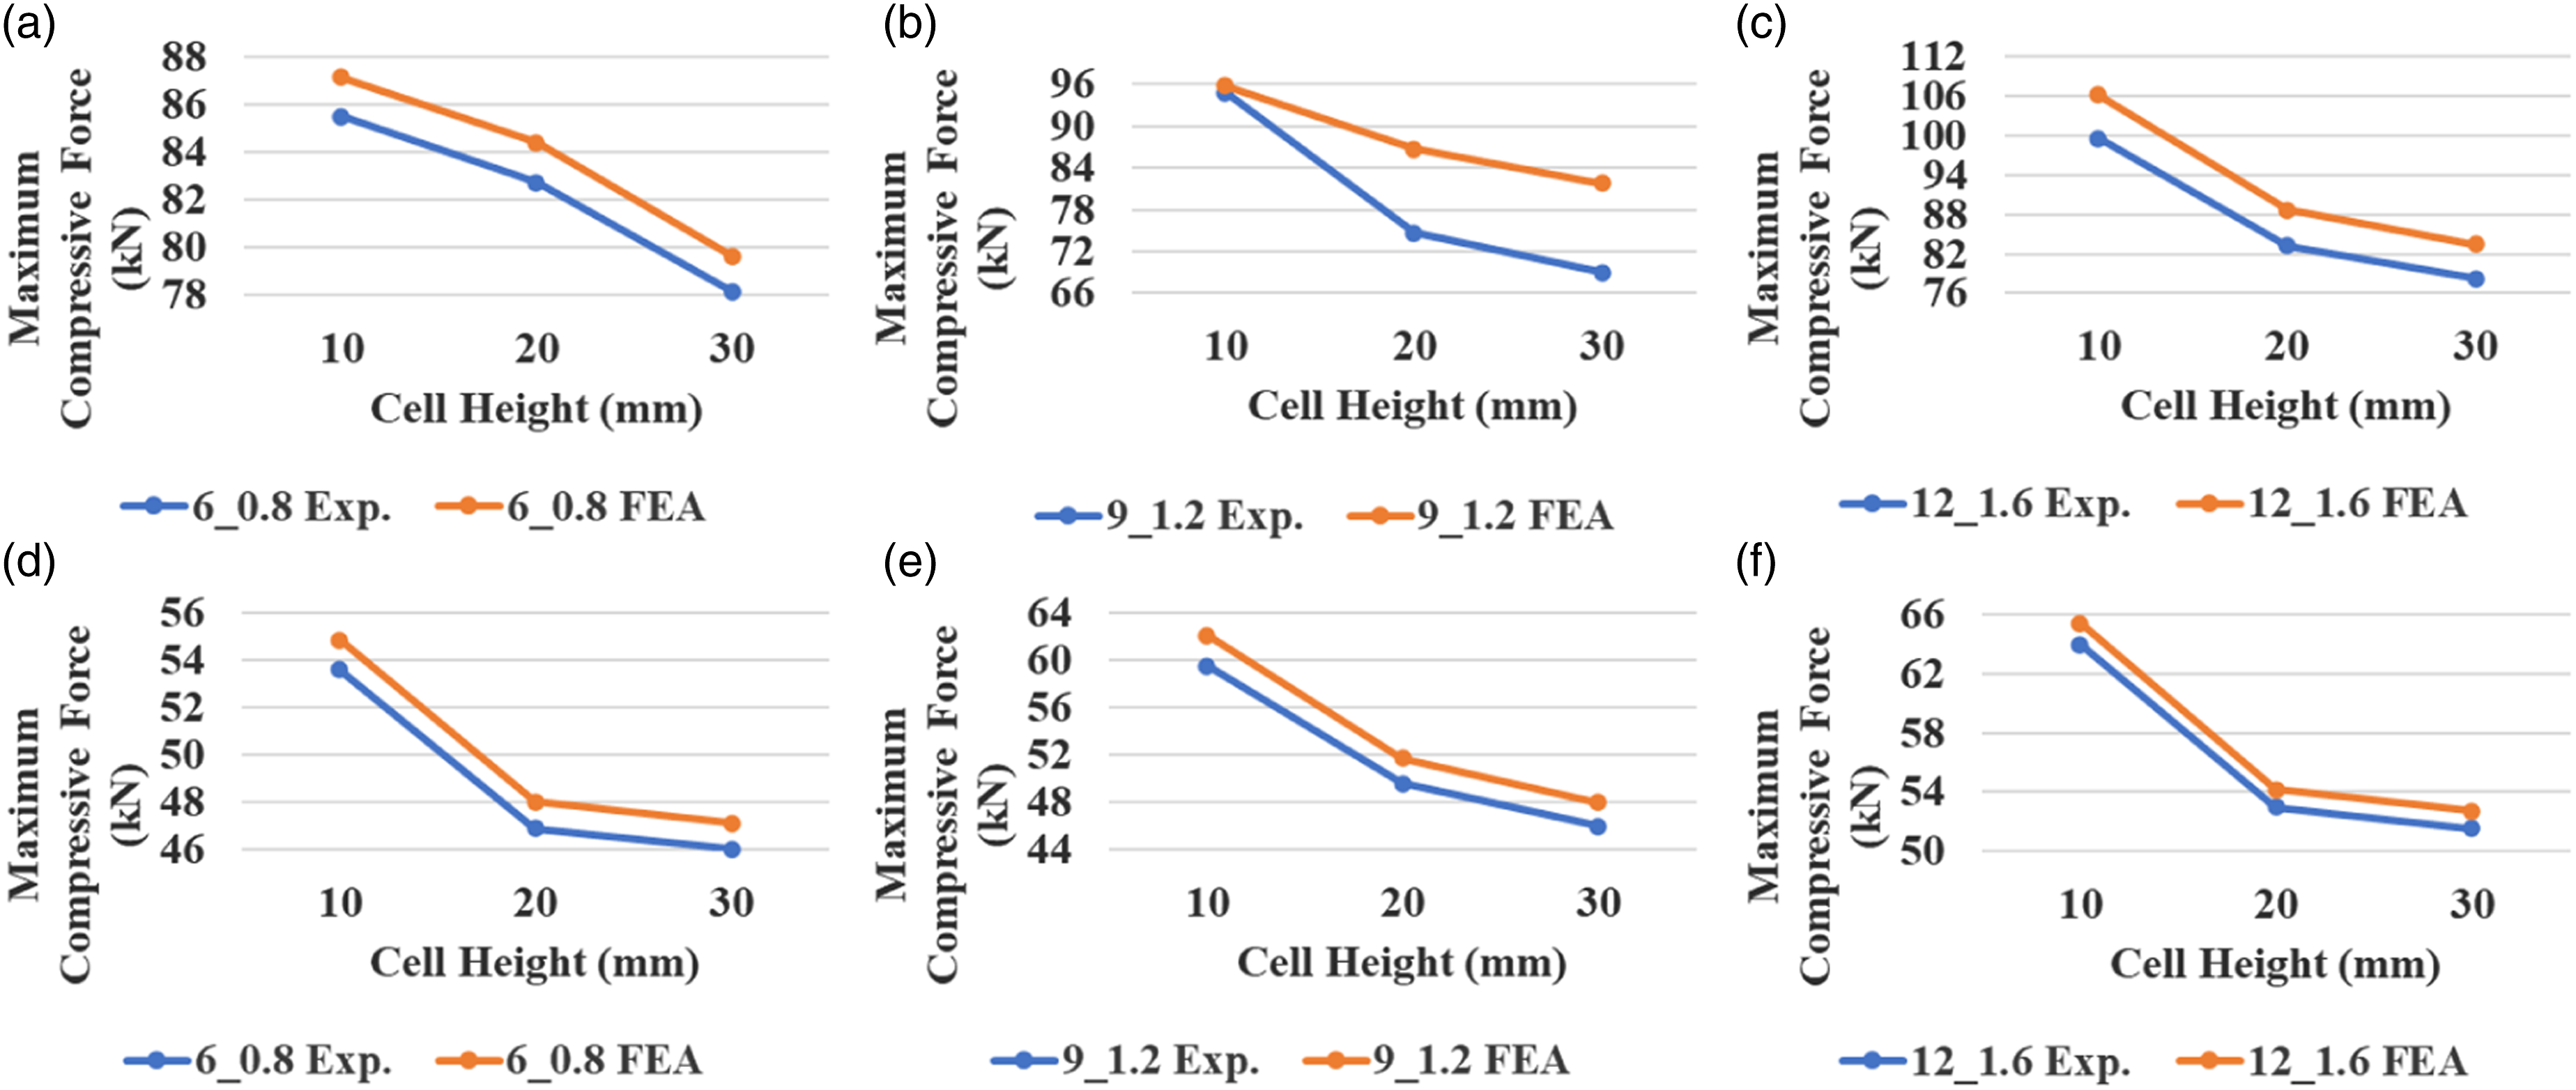
Conclusion
The present study produced honeycomb structures with an equal surface area and three different cell width and wall thickness values from PLA and ABS filaments using a 3D printer. These structures were later analyzed in terms of their compressive strength through experimental and finite elements methods. The conclusions of the present study are summarized below. • The data obtained from the experimental compression tests on PLA and ABS samples indicated that a higher cell height resulted in a lower buckling load and a higher porosity, which decreased the maximum compression force by approximately 19%. • It was observed that PLA samples had a higher maximum compression force compared to ABS samples. The highest maximum compression force belonged to PLA_12_1.6_10 samples. • The findings of ANSYS® analysis on the structures with three different cell width and wall thickness values through finite elements method yielded results similar to those obtained from the experimental analysis, in the range of approximately 81–98%. • It was also found in both experimental and finite elements analysis that although the cell width values of honeycomb structures with the same surface area and mass increased, their maximum compression force also increased due to a higher cell wall thickness. This increase was approximately determined as 6%, 10% in PLA samples, 15% and 15% in ABS samples in experimental and numerical compression tests, respectively.
Footnotes
Acknowledgements
We would like to thank Kahramanmaraş Sütçü İmam University Mechanical Engineering Department for its contributions.
Author contribution
Serdar Kaveloğlu: Backround research, design, methodology, validation writing, editing.
Şemsettin Temiz: Review, software, suggestion and supervision.
Declaration of conflicting interests
The author(s) declared no potential conflicts of interest with respect to the research, authorship, and/or publication of this article.
Funding
The author(s) disclosed receipt of the following financial support for the research, authorship, and/or publication of this article: This work is financially supported by a scientific research grant at Inonu University with the project number FDK-2020-2349.