
Abstract
Petroleum-based polymers have a wide range of uses in the packaging industry, including films, food packaging, rigid containers, foamed containers, medical products, etc. This study focuses on improving the properties of polyvinyl alcohol (PVA) based material systems, one of the most popular water-soluble biopolymers, to reduce the waste of petroleum-based plastics, which are widely used. Polyvinyl alcohol (PVA) nanocomposite films containing low concentrations (0.05–1%) of graphene oxide (GO) and reduced graphene oxide (rGO) were produced via the solution casting method. When electrical properties of nanocomposite films were evaluated, the addition of 1 wt% GO and rGO resulted in a 36% and 45% decrease in the volumetric resistance of the films as well as a decrease in surface resistance of 24.5% and 34.9%, respectively. The maximum tensile strength of 1% GO and rGO-reinforced PVA nanocomposites was found to be ∼59 MPa and ∼68 MPa with an increase of 20% and 38% compared to neat PVA films, respectively. The average Young’s modulus of 1% GO and rGO-reinforced PVA nanocomposites also increased from 2561 MPa to 3515 MPa and 4219 MPa with an increase of 37% and 65%, respectively. As a result, the electrical conductivity, Young’s modulus, maximum tensile strength, thermal properties, and optical absorption of nanocomposite films increased by adding GO and rGO to PVA. The results show that the produced nanocomposite film may be a promising material for packaging applications.
Introduction
In the 1960s, polymer-based composites were accepted as a new approach to materials. 1 The properties of these polymer-based composites can be improved by using different reinforcing materials such as carbon-based nanomaterials. Graphene, a single layer of carbon atoms arranged in honeycomb lattice, is an advanced material with a high aspect ratio, remarkable mechanical, electrical and thermal properties, flexibility and high efficiency.2–4 Since its experimental discovery in 2004, graphene, a carbon allotrope arranged in a two-dimensional hexagonal lattice, offers unprecedented physical and chemical properties.5–7 On the other hand, graphene oxide (GO) emerged 150 years ago as a pioneer that offers the potential to produce low-cost and large-scale graphene-based materials. 8 Graphene oxide consists of a two-dimensional (2D) layer of covalently bonded carbon atoms containing various functional groups, such as epoxies, alcohols, and carboxylic acids, in its basal planes and edges. These functional groups can significantly alter the van der Waals interactions and increase compatibility with organic polymers.9,10 These groups make GO strongly hydrophilic and dispersible in water. 11 However, graphene oxides are in powder form and have low mechanical stability. 12 On the other hand, nanocomposites having increased properties such as hardness, tensile strength, modulus of elasticity and wear resistance are obtained by reinforcing a small amount of graphene to polymeric materials. 5 Depending on these properties, the addition of graphene oxide increases the surface hydrophilicity of the material, while the reduced graphene oxide, which has a hydrophobic structure, increases the surface hydrophobicity of the material.13,14 In addition, many authors have reported that graphene oxide and reduced graphene oxide significantly improve the gas and water barrier properties of the material for packaging applications.15–18 Because of these properties, it can be incorporated into various polymer matrices such as epoxy, polystyrene (PS), polypropylene (PP), poly (vinyl alcohol) (PVA), poly (lactic acid) (PLA), polyethylene terephthalate (PET), polyaniline, nylon and poly (methyl methacrylate) (PMMA) for various application areas.19,20 Besides many advantages of graphene, there are some difficulties faced by graphene-polymer composites such as the homogeneous distribution of graphene in the polymer and the interface interaction between graphene and polymer matrix.5,19 To overcome this difficulties that may be encountered in graphene/polymer nanocomposites, physical and chemical treatment can be applied. 21
Today, there is a high demand for the natural contents of the materials used in packaging applications. For this reason, the use of healthy components and the use of non-toxic materials are important features in packaging applications. 22 Polypropylene (PP), polystyrene (PS), polyethylene (PE), polyamide (PA) and polyvinyl alcohol (PVA) are polymers that are increasingly used in the packaging industry due to their relatively low cost, easy availability and good mechanical properties such as tear strength and barrier properties.23,24 Among these polymers, polyvinyl alcohol (PVA) is preferred for packaging films due to its many advantageous properties such as high hydrophilicity, good chemical stability and excellent film forming. Because hydrophilic PVA is an environmentally friendly biodegradable polymer, the use PVA as packaging material offers a solution to the accumulation of solid waste.25,26 In addition, PVA comes to the fore in packaging films due to its non-toxic, high adhesion strength and antistatic properties.27,28 However, PVA has relatively low strength and thermal stability for some applications. 29 To overcome these disadvantages, GO and rGO can be used as nanofiller materials for PVA-based nanocomposites.30,31 In the literature, several studies were done to investigate the effects of GO and rGO on the properties of polymer composites.31–44 Therefore, in this study, polyvinyl alcohol (PVA) nanocomposite films containing graphene oxide (GO) and reduced graphene oxide (rGO) were produced. Firstly, graphene oxide was produced by the improved Hummers method, then GO/PVA solutions were prepared by reinforcing 0.05, 0.1, 0.25, 0.5, 1% graphene oxide by weight of the polymer into the PVA solution. Afterwards, GO/PVA films was obtained via solution casting method. On the other hand, rGO/PVA nanocomposites were obtained by reducing the prepared GO/PVA solution with ascorbic acid (AA). The properties of all nanocomposite films were investigated by using Fourier transform infrared spectroscopy (FT-IR), thermogravimetric analysis (TGA), mechanical test, a field emission scanning electron microscope (FE-SEM), UV-vis-NIR spectrophotometer and electrical conductivity measurements.
Material and method
Material
Graphite powder (Fischer Chemicals, UK), sulphuric acid (98%, Merck, Germany), phosphoric acid (85%, Sigma-Aldrich, Switzerland), potassium permanganate (Sigma-Aldrich, USA), hydrogen peroxide (35%, Sigma-Aldrich, Germany), hydrochloric acid (37%, Fischer Chemicals, France), methyl alcohol (Isolab, France) and ethyl alcohol (Isolab, Germany) were used for graphene oxide production. Ascorbic acid (Sigma, USA) was used as reduction agent. Polyvinyl alcohol (95.5–96.5%, Acros Organics, Belgium) and distilled water were used to produce the films. All chemicals used as received without further purification.
Synthesis of graphene oxide
The production of reduced graphene oxide from graphite powder was carried out in two steps: Graphene oxide (GO) was first produced via improved Hummer’s method 45 and in the second step the graphene oxide (GO) was reduced with ascorbic acid. 46 Graphene oxide was produced by improved Hummers method. 45 For this purpose, a mixture of 360 mL of sulfuric acid and 39.9 mL of phosphoric acid (volume ratio of 9:1) was prepared in a reaction flask. The prepared acid mixture was put into oil bath and 3 g of graphite powder and 18 g of KMnO4 slowly added to the acid mixture. After waiting for about 30 min, the oil bath was adjusted to 50oC and stirred for 12 h. When the reaction was over, it was cooled to room temperature. Then, the resulting brown homogeneous acid mixture was poured into a bucket of 150 mL of ice to attenuate the heat of the resulting exothermic reaction and 3 mL of 30% H2O2 were added. After, the mixture was placed in centrifuge at 9000 r/min for 15 min. The liquid acid mixture separated from the solid in the centrifuge was poured into acid bottles and the remaining solid waste was re-centrifuged with 40 mL of ethanol for 15 min at 9000 r/min. This was repeated with 30% HCl followed by washing with water. Washing with distilled water was carried out about 25 times. When the pH controlled mixture reached neutral pH, the process was terminated and placed in GO Petri dish and dried in fume hood.
Preparation of GO/PVA nanocomposite films
0.08 g of GO was added into 40 mL of water.
45
Then, it was placed on an ultrasonic homogenizer (Bandelin/Sonopuls HD3200) for 30 min to homogeneously dispersed and 2 mg/mL GO solution was obtained. First 5% PVA solution was prepared. GO/PVA nanocomposite films were prepared by adding graphene oxide at 0, 0.05, 0.1, 0.25, 0.5, and 1.0 wt% of PVA. The required amount of graphene oxide was added to the centrifuge tube and 40 mL of DI water was added to it. Then, this 40 mL solution was sonicated in the ultrasonic homogenizer for 30 min. This homogeneously dispersed solution was poured into a beaker and 36 mL of water was added and sonicated again in the ultrasonic homogenizer for 30 min. Finally, 76 mL of GO solution were taken into a closed container and 4 g of PVA was added and the oil bath was adjusted to 90°C and stirred for 24 h. Thus, the homogeneous GO/PVA solution was achieved. The GO/PVA solution was poured into a beaker and sonicated again for 30 min in an ultrasonic homogenizer to remove bubbles caused by mixing. Then, it was placed in an ultrasonic bath (Bandelin RK512H) for 2 h to ensure complete removal of the bubbles in the solution, and 7 mL of GO/PVA solution was taken with a syringe and poured into a Petri dish. Then, it was left to dry in the oven at 75°C for 2.5 h. Finally, films were removed from the Petri dish (Figure 1). The average thickness of the produced GO/PVA nanocomposite films was measured as ca. 0.033 mm by micrometer (Asimeto Digital Micrometer). Images of GO/PVA nanocomposite solutions and films.
Amount of graphene oxide and ascorbic acid used in GO/PVA solution.

The rGO/PVA solutions obtained after chemical reduction were sonicated by an ultrasonic homogenizer for 30 min. After obtaining a homogeneous solution, it was placed in the ultrasonic bath for 2 h to remove air bubbles, and 7 mL of the obtained rGO/PVA solution was poured into a Petri dish. Then, it was dried in the oven at 75°C for 2.5 h (Figure 2). The average thickness of the produced rGO/PVA nanocomposite films was measured as ca. 0.035 mm by a micrometer. Images of rGO/PVA nanocomposite solutions and films.
Characterization
The chemical structure of neat PVA, GO/PVA, and rGO/PVA nanocomposite films were analyzed by Fourier transform infrared spectroscopy (FT-IR) in the range of 4000–400 cm−1 with a 4 cm−1 spectral resolution on a Thermo Scientific Nicolet i550 model FT-IR spectrometer with Smart Orbit-Diamond model ATR in transmittance mode.
Volumetric and surface resistivity measurements of the nanocomposites were done according to the four probe technique with the Keithley 8009 test apparatus (20 mA, 20 V) integrated into the Keithley 6517B-E device. The following formulas were used to calculate the volumetric and surface resistivity


Here, surface resistivity (ρs) is calculated by applying a voltage to the surface of the nanocomposite sample, measuring the resulting current, and applying the above equation (1).47,48 ρs is surface resistivity of the nanocomposite samples, V is the applied voltage, and I is the current read from the electrometer. The volume resistivity (ρv) was measured by recording a potential difference between the electrodes separated at a distance while a given current flows through a cross-sectional area. Here, tc is the thickness (cm) of the nanocomposite sample and σ is the conductivity of the nanocomposite sample. Volume resistivity (ρv) and conductivity can be calculated by equations (2) and (3) given above.47,49 These calculations were done by Keithley 6517B-E device according to the above formula based on Keithley 8009 test apparatus geometry.
Thermal analysis of the nanocomposites was performed on TGA (Perkin-Elmer STA 6000) instrument. For thermogravimetric analysis, approximately 5–10 mg of neat PVA, 1% GO/PVA, and 1% rGO/PVA samples were tested. The test was carried out in a N2 atmosphere with a heating rate of 5°C/min between 30°C and 600°C; It was carried out in an O2 atmosphere between 600°C-900°C and was kept for 10 min at 900°C. The mechanical properties of the nanocomposites were determined by the Shimadzu-AGS-X mechanical tester according to the ASTM D 638 standard. The specimens were cut to 1 cm wide and 6 cm long and secured between the jaws at 4 cm. 10 tests of each prepared sample were applied at a draw speed of 5 mm/min. The optical properties of nanocomposite films were investigated by the Shimadzu UV-3600 UV-Vis-NIR spectrophotometer. Spectrophotometric analysis was performed measuring the absorbance value between 200 nm and 800 nm with steps of 5 nm. Morphological properties of nanocomposite film samples were carried out by field scanning electron microscope (FE-SEM) (LEO GEMINI 1530, Carl Zeiss). The samples were coated with thin gold/platinum alloy film using a sputter coater (Leica/ACE600) to prevent the accumulation of charge on their surface.
Results
Fourier transform infrared spectroscopy analysis results
FT-IR spectra of neat PVA, and GO and rGO-reinforced PVA nanocomposite films are shown in Figure 3. In the IR spectrum of PVA, the spectrum shows three characteristic peaks at 3292 cm−1 (O-H), 1707 cm−1 (benzene carboxyl) and epoxy 1074 cm−1 (epoxy group), respectively. PVA shows 3000-3700 cm−1 (O-H stretch), 2850-3000 cm−1 (CH2 stretch) (C-H), 1736 cm−1 (C=O stretch), 1416 cm−1(CH2 bending), 1090-1150 cm−1 (C-O stretch) peaks.50–54 Even with the highest rGO and GO ratio of 1%, these peaks were similar to PVA, so no visible difference could be achieved. This is because that rGO does not contain peaks and GO’s peaks overlap with peaks of PVA. FT-IR analysis of neat PVA, 1% GO/PVA and 1% rGO/PVA composites.
Electrical resistivity measurement results
Volume resistivity (Ω.cm) and surface resistivity (Ω/□) of graphene oxide and rGO-reinforced nanocomposites.

Volume resistivity and surface resistivity values of neat PVA, 1%GO/PVA and %1 rGO/PVA films shown in Figure 4. The volume resistivity of neat PVA was measured as 1.411x10
12
Ω.cm. Changes in the volume resistivity of PVA nanocomposites were observed depending on the amount of GO and rGO incorporated. It was concluded that rGO, which is more conductive, and GO, which has lower conductivity, decrease the volume and surface resistivity of PVA in certain proportions and produced nanocomposite films have become more conductive materials. Volume resistivity and surface resistivity values are function of the mass of GO and rGO in composite films.
55
Regardless of the concentration, the addition of GO and rGO reduces the resistivity and increases the volumetric and surface resistances of the composite films obtained. This may be due to graphene and GO forming a two-dimensional conductive network in the PVA matrix.
56
Thus, with increasing GO and rGO concentration, the resistivity of the nanocomposite films decreased gradually, while the electrical conductivity increased accordingly. The change in the volume and surface resistivity of 1wt% GO/PVA and 1 wt% rGO/PVA films was observed to be significantly higher than that of 0.05 wt%, 0.1 wt%, 0.25 wt%, 0.5 wt% GO/PVA and rGO/PVA films. 1% GO and rGO doped films exhibited a decrease in the volume resistivity as 36% and 45%, and a decrease in surface resistivity as 24.5% and 34.9%, respectively, compare to neat PVA films. The addition of conductive rGO caused a greater decrease (9%) in resistivity values than GO. On the other hand, the electrical resistivity of a material in bulk is different from the resistivity of the material in its nano state. Studies show that the electrical resistance of a thin film increases as the thickness of that film decreases.
57
(a) Volume resistivity (Ω.cm) and (b) surface resistivity (Ω/□) graphs of neat PVA and 1% GO/PVA and 1% rGO/PVA nanocomposites.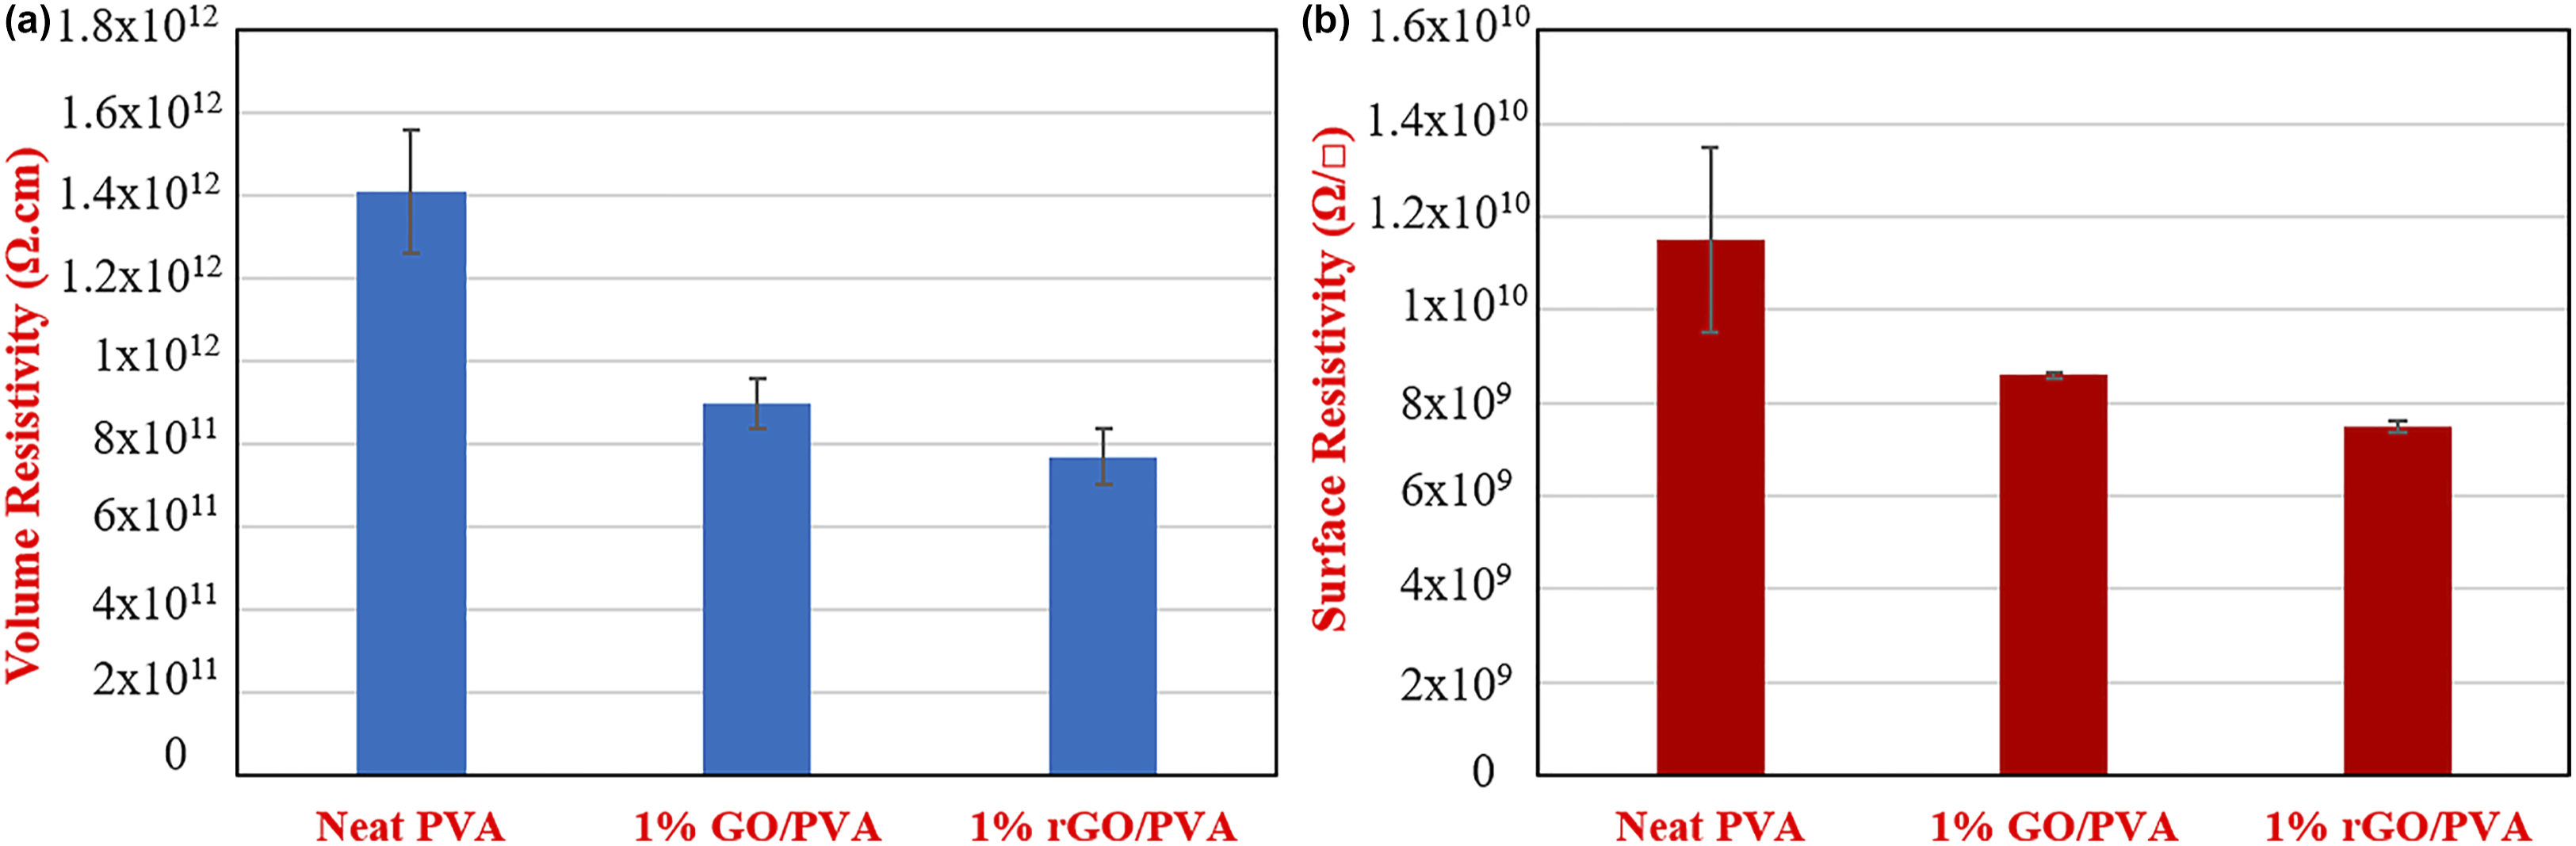
Static charge build-up on packaging materials can create sparks that can cause combustion under certain conditions. Therefore, the GO and rGO additives in the resulting PVA film exhibited improved electrical conductivity properties that could contribute to suppressing the electrical charge. 58 Electrostatic discharge is an important phenomenon that is supposed to be considered for electronic equipment packaging. Increasing the conductivity of the packaging material reduces charge build-up and protects electronic equipment by keeping the electrical current at manageable levels.59,60
Thermogravimetric analysis results
TGA thermogram of neat PVA and 1% GO/PVA and 1% rGO/PVA nanocomposites are given in Figure 5. Three-step degradation behaviour was observed in the prepared nanocomposites. The TGA curves suggest that GO and rGO have a significant impact on improving the thermal stability of nanocomposites. A 10% weight loss between 30oC and 150oC results from the evaporation of water molecules trapped in the structure. The neat film and 1% GO/PVA nanocomposite film began to decompose at approximately 260oC, while 1% rGO/PVA nanocomposite film began to degrade at 300oC. This proved that the 1% rGO addition had an effect on increasing the decomposition temperature of PVA nanocomposite films. In addition, since, a 75% mass loss was observed in 1% GO/PVA and neat PVA, in the first degradation step, while a 70% mass loss occurred in 1% rGO/PVA, it can be said that the rGO additive slows down the degradation of PVA nanocomposite films.
61
Such improvement can be attributed to the physical barrier effect of GO and rGO, which slows the diffusion of pyrolysis product.
62
TGA analysis of neat PVA and 1% GO/PVA and rGO/PVA nanocomposites.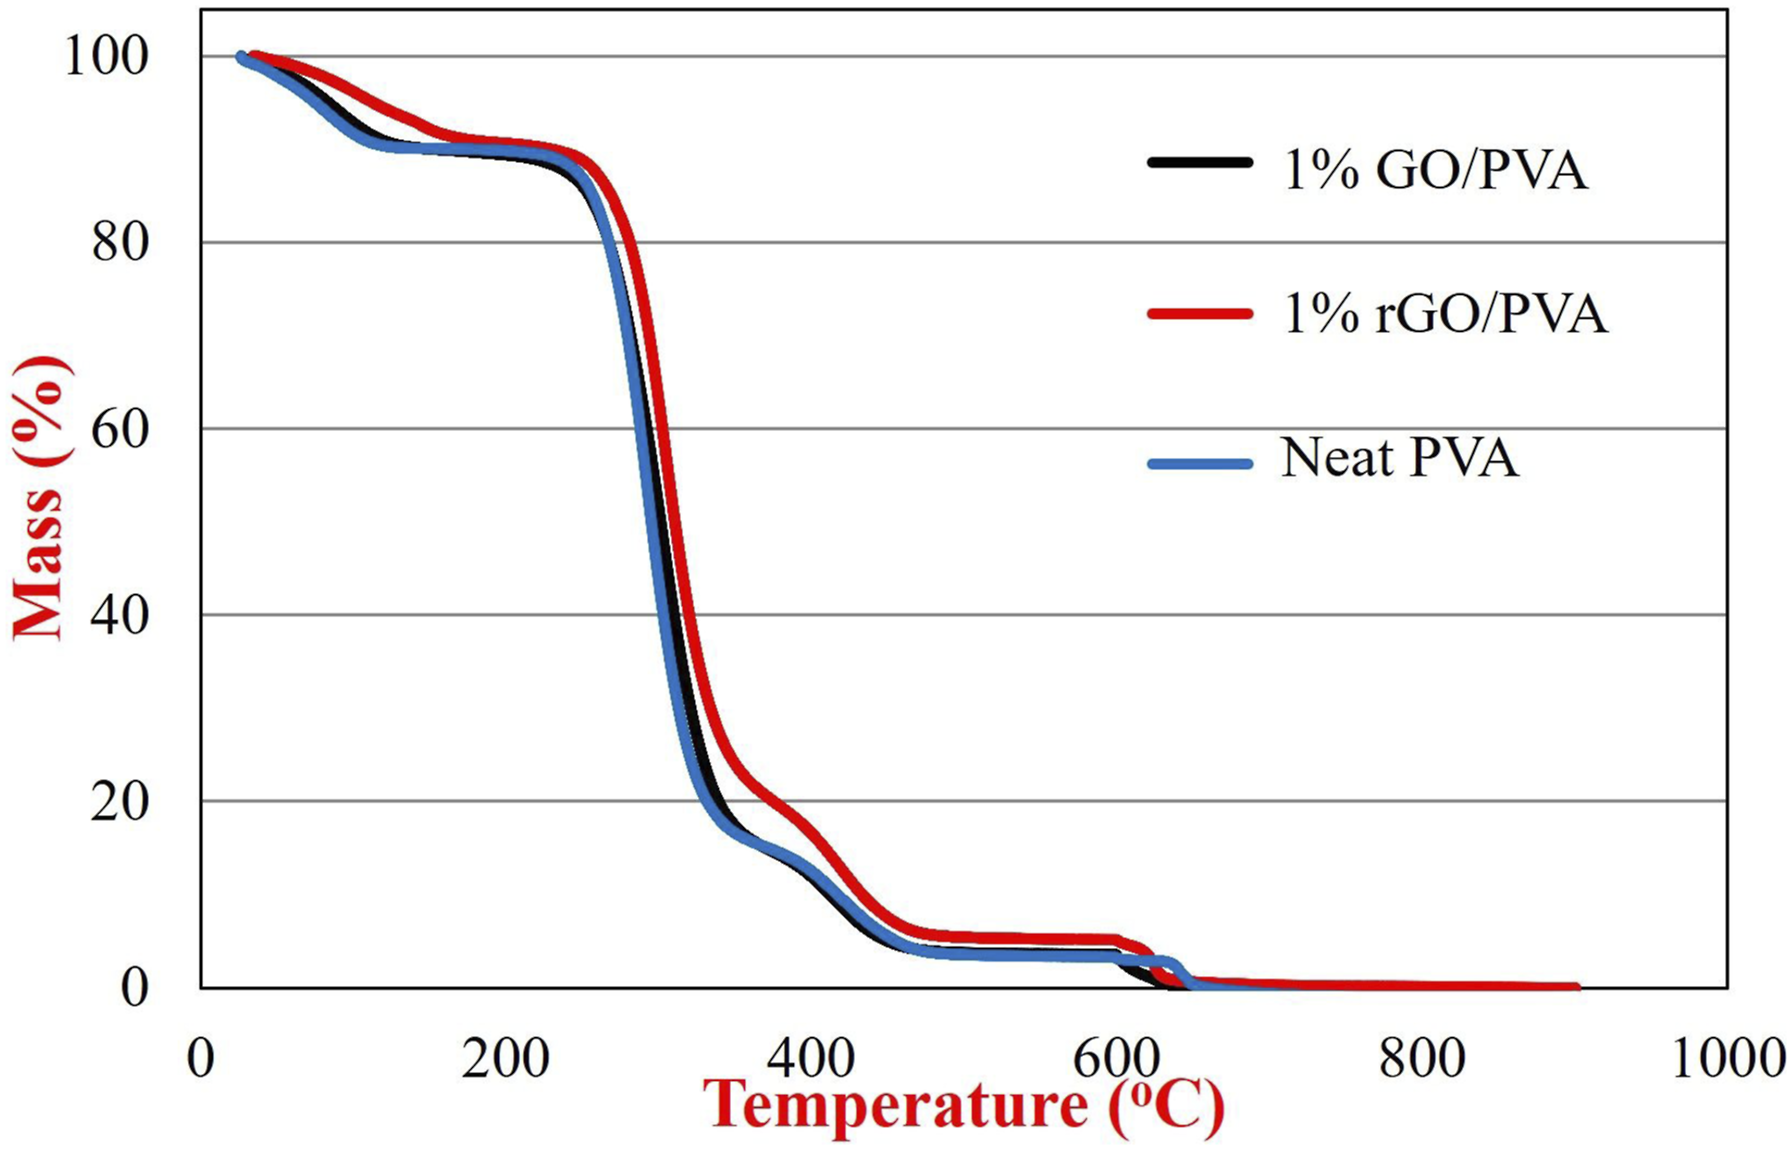
Mechanical test results
Maximum stress (MPa), Young’s modulus and standard deviation values of neat polyvinyl alcohol and 1% GO, rGO/PVA nanocomposites.

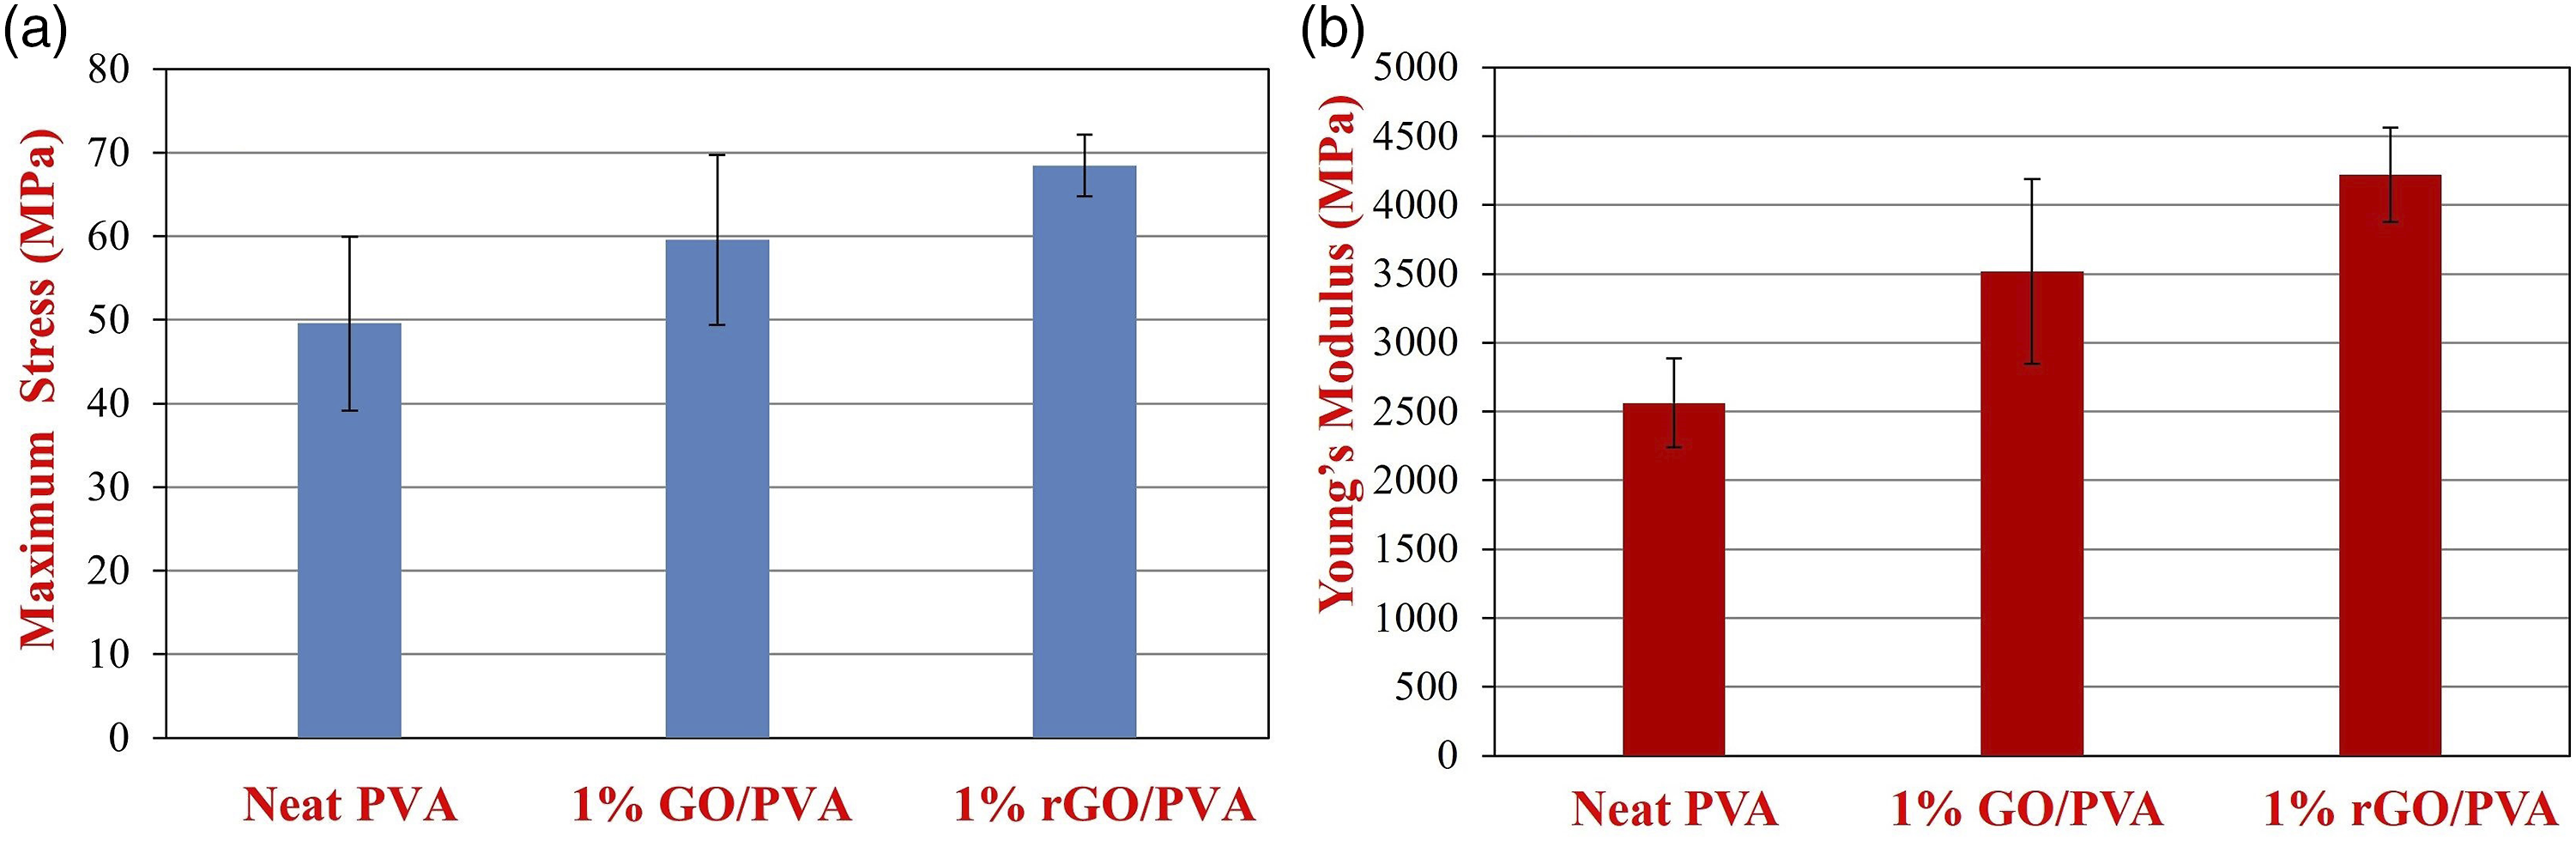
(a) Maximum stress and (b) Young’s modulus graphs of neat PVA, 1% GO/PVA and 1% rGO/PVA nanocomposites.
The maximum stress of GO nanocomposite films (with an increase of 20%) compared to that of rGO nanocomposite films (with an increase 38%), compared to neat PVA, as expected, have increased much more. rGO is a much higher strength material than GO due to its maximum stress functional structure.
63
This resulted in a further increase in the stress properties of the rGO reinforced films. As shown in Figure 6(b), the Young’s modulus (2561.71 MPa) of the neat PVA sample varied according to the different concentrations reinforcement and gradually increased. Young’s modulus of 1% GO/PVA and 1% rGO/PVA was measured as 3515.72 MPa, 4219.61 MPa, respectively. Since Young’s modulus of rGO (∼1000 GPa) much more higher than that of GO (207.6 ± 23.4 GPa).
64
rGO/PVA nanocomposites exhibited higher Young’s modulus (64% higher than neat PVA) than GO/PVA nanocomposites. Moreover, representative stress-strain curves were shown in Figure 7. It is supposed to note that these are representative stress-strain curves, it is not an average stress-strain curves. Representative stress-strain curve of (a) GO reinforced PVA nanocomposites (b) rGO reinforced PVA nanocomposites.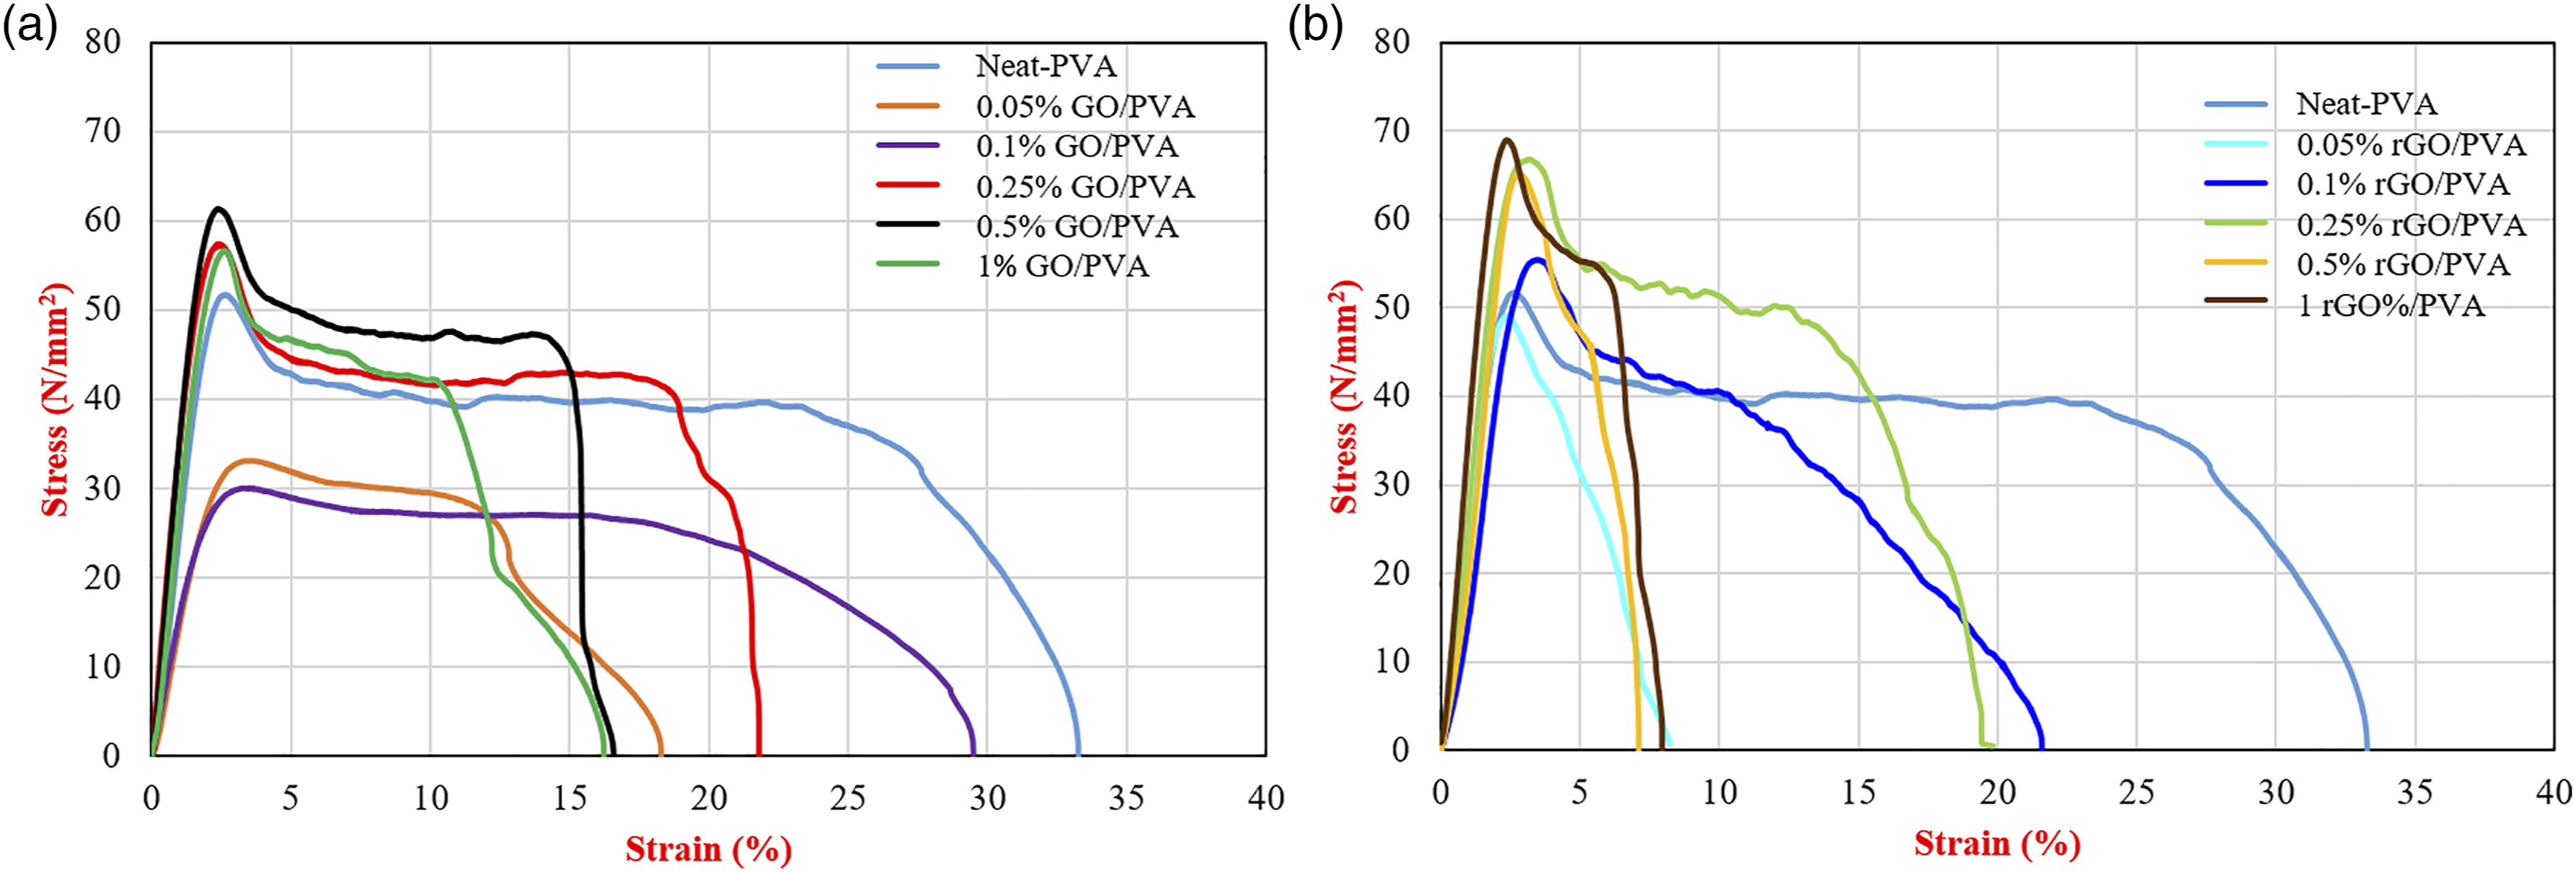
In the study of Goumri et al., 65 GO was first reduced by chemical method and then nanocomposite films were prepared by mixing with PVA. Due to the dispersion problem of chemically reduced graphene oxide in the nanocomposites, lower mechanical properties were obtained. However, in our study, a more homogeneous distribution was obtained, since the preparation and reduction of the polymer solution were performed simultaneously. This resulted in better mechanical properties compared to the neat polymer.
Optical results
The determination of the optical properties of the obtained samples was carried out by measuring the absorbance and transmittance values between 200 nm and 800 nm in steps of 5 nm. Figure 8 shows the absorbance and transmittance spectrum of GO and rGO reinforced films. When the absorbance spectra of GO/PVA and rGO/PVA nanocomposites were examined between 200 nm and 800 nm, it was observed that the spectra had a similar tendency. Compared to neat PVA, the absorbance of GO/PVA and rGO/PVA composites increased in direct proportion with the amount of nanofiller and reached the maximum in reinforced PVA nanocomposites containing 1% GO and rGO. Figure 8(b) shows the transmittance spectrum of GO/PVA and rGO/PVA nanocomposites between 200 nm and 800 nm. Compared to neat PVA, the transmittance gradually decreased depending on the amount of GO and rGO added and this value reached the lowest transmittance in PVA nanocomposites containing 1% GO and rGO. The reinforcement of GO and rGO reduced the transparency of the PVA nanocomposite films and the color of the material has become more brown-black color depending on the amount of nanofiller in it as can be seen in Figures 1 and 2. This resulted in a decrease in transmittance (%) compared to neat PVA and the films became more opaque. Due to the larger lateral size of GO and rGO, their addition of them increased the absorbance value in all wavelengths, especially in the UV region.31,66 (a) Absorbance and (b) transmittance spectrum of 1% GO/PVA and 1% rGO/PVA nanocomposites.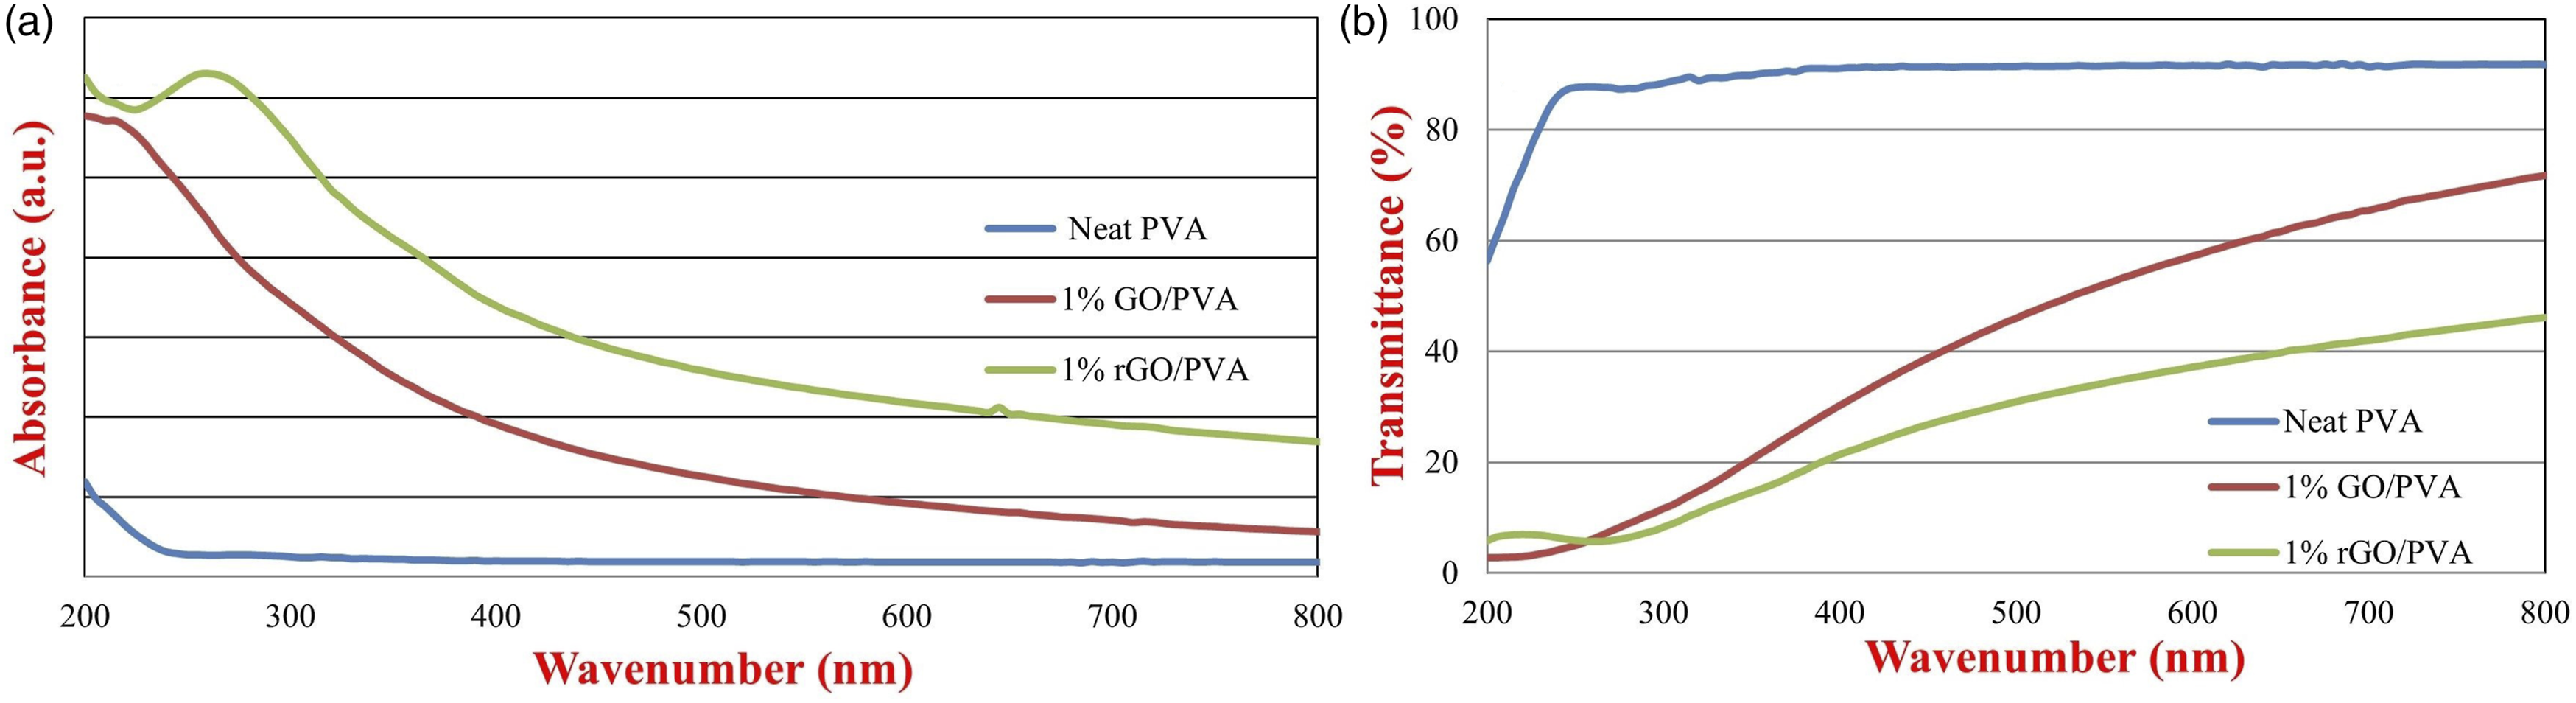
Morphological results
The morphology of GO and rGO nanofillers reinforced nanocomposites were characterized by field emission scanning electron microscopy (FE-SEM). SEM images of neat PVA, 1% GO/PVA and 1% rGO/PVA nanocomposite films are shown in Figure 9. Although neat PVA film does not have any filler as expected, regional structures indicating the presence of GO and rGO were detected in the SEM images of 1% GO/PVA and 1% rGO/PVA. It is seen that the width and length of the GO and rGO nanosheets are several micrometers. It is observed that GO and rGO nanoparticles are distributed homogeneously in the polymer as desired. One of the most important challenges to consider in nanocomposites is the agglomeration of nanofillers. The expected performance improvement cannot be achieved due to the agglomeration of the reinforcement agents. It is important that nanofillers are effectively dispersed in the polymer in order to improve the properties of polymer matrices.
35
Scanning electron microscope images of (a) 1% GO/PVA (b) 1% rGO/PVA (c) neat PVA.
Conclusion
In this article, the two-stage production of polyvinyl alcohol (PVA) nanocomposite films containing graphene oxide (GO) and reduced graphene oxide (rGO) was studied. GO/PVA nanocomposite films with different nanofiller ratios were obtained by solution casting method using GO obtained by improved Hummers method. rGO/PVA nanocomposites were produced by adding ascorbic acid to the GO/PVA solution and mixing at 60oC for 6 h in a dark environment. Chemical, thermal, mechanical, morphological, optical, and electrical properties of the obtained GO/PVA and rGO/PVA nanocomposites were investigated by FT-IR, TGA, mechanical test, FE-SEM, UV-vis-NIR spectrophotometer, and electrical resistivity measurements. When the FT-IR spectra of GO and rGO reinforced PVA nanocomposite films were examined, no clear absorption peak from rGO and GO was observed. When the electrical properties of nanocomposites were considered, a 36% and 45% reduction in volume resistivity of neat PVA and a 24.5% and 34.9% reduction in surface resistivity of neat PVA were found with the addition of GO and rGO, respectively. Moreover, the maximum tensile value of GO reinforced PVA nanocomposites was found to be ∼59 MPa with an increase of 20% compared to neat PVA film with a GO contribution of 1%. The average Young’s modulus increased from 2561 MPa to 3515 MPa with a 37% increase. The maximum tensile value of rGO reinforced PVA nanocomposites was found to be ∼68 MPa with an increase of 38% compared to neat PVA film in a 1% rGO reinforcement. The average Young’s modulus increased from 2561 MPa to 4219 MPa with an increase of 65%. The light transmittance of GO and rGO nanocomposites decreased with increasing nanofiller rate. Light absorption increased with an increasing nanofiller ratio as expected. According to the thermal analysis of the nanocomposites, a greater mass loss was observed in the neat PVA in the first decomposition step, while a 1% rGO/PVA had a lower mass loss. This difference in mass loss is based on the presence of rGO in PVA nanocomposite films and has shown that the degradation of the nanocomposite films slows down. Besides, according to the SEM results, GO and rGO were determined visually in the composite films. As a result, it can be concluded that the modulus of elasticity and maximum tensile properties of nanocomposites were improved by the addition of GO and rGO to PVA, and their electrical resistivity was decreased.
Footnotes
Declaration of conflicting interests
The author(s) declared no potential conflicts of interest with respect to the research, authorship, and/or publication of this article.
Funding
The author(s) received no financial support for the research, authorship, and/or publication of this article.