
Abstract
Graphene nanosheets are promising nanofillers to the tunable structure, properties of materials, and optical bandgap. This search focuses on investigating the new nanocomposites of Ultra-high molecular weight polyethylene oxide (UHMWPEO) with different loading ratios of polyvinyl alcohol (PVA) reinforced with graphene oxide (GO) by applying the modified solution-sonication-casting method. Fourier-transform infrared spectroscopy (FTIR) shows strong interfacial interaction between the blended polymers and GO nanosheets in the nanocomposites. X-Ray diffraction (XRD) reveals a significant shifting in the PEO and reduction in the crystallinity. Optical microscopy (OM) images exhibit fine homogeneity of the polymer in the matrix with excellent dispersal of GO in nanocomposites as supported by scanning electron microscopy (SEM). Attractively, the samples with a higher ratio of UHMWPEO exhibit better optical behavior, and great improvements were presented after the contribution of GO. UV-visible spectroscopy has characterized the absorption, absorption coefficient, real and imaginary, bandgap, and other parameters. The allowed bandgap was significantly enhanced by reducing up to 80%, whereas the forbidden bandgap was improved by up to 160% of the nanocomposites. Additionally, nanocomposites exhibited significant adsorption of radiation-ray, especially after the contribution of GO. The findings are promising as various applications could come to the fore: radiation protection, spectroscopy devices, and other applications.
Introduction
Nanocomposites are an important subject in developing and producing materials, particularly polymer-nanomaterials. 1 It is well recognized that the most significant factors resulting from the interaction of filler nanoparticles with polymer are nanocomposites that improve nanocomposites' properties in nuclei. 2 Polymer nanocomposites attract great interest because these materials possess a high potential for a big improvement in properties by adding a slight number of nanoparticles to the polymer arrays.3,4 Nanocomposite materials are a novel class of materials that have more properties than their constituents. The addition of a small number of nanoparticles may vastly boost several properties while sacrificing none of the polymer’s lightweight matrices 3 and overcoming several polymer weaknesses. The few atomic layers of the 2D materials attract substantial and outstanding attention to their multipurpose chemical and physical properties.5,6 For instance, graphene and its derivative are the 2D material that was first experimentally prepared and dominated research in the recent decade.7–10 As graphene oxide nanosheets have unique characteristics that could bring notable improvement to nanocomposites. 11 Mostly, it is easily functional in wide and various spintronics, electronics, and photoelectronic, applications, etc.12,13
Polyethylene oxide (UHMWPEO) is the most widely used material in artificial joints among hard-on-soft bearings. 14 It is an engineering polymer that differs in terms of average chain length and average molecular weight. 15 UHMWPEO is water-soluble and commonly used in several different applications as functional additives, such as flocculation methods, wastewater treatment, mining, food processing, cosmetics, and coagulation. 16 Poly (vinyl alcohol) (PVA) by a suspended hydroxyl collection has a relatively simple chemical structure. There are commercial PVA modifiers with high grades of hydrolysis. 17 The grades of hydrolysis, or the number of acetate collections in the polymer, 18 have an impact on its biochemical properties, solubility, and PVA crystallization. 19 It is eminent from other polymers of good properties such as wear resistance, strength, thermal stability, and quality. 20
Several studies21–23 had listed some very interesting findings when PEO and PVA polymers were formed with each other as a polymer mixed with graphene oxide or with other nanoparticles. Whereas the Ultra-high molecular weight PEO (UHMWPEO) that was used in this study does not address it before, to the best of our knowledge, or with PVA or GO nanosheets. Yuan-Cheng Cao et al., (2011) 23 used a PEO and GO nanocomposite film targeted without chemical changes, and low-temperature polymer fuel cells. SEM morphology images show the composite material without defects in the structure of the PEO/GO membrane. Small-angle XRD outcomes for the film samples indicate a reflection of the d-spacing (001) of GO in the PEO matrix. This peak is changed from 11o to 4.5o of the PEO samples after the addition of the GO layers. The PEO/GO membrane’s ionic conductivity rises from 0.086 to 0.134 S cm−1 when the activity with relative humidity and the temperature rises from 25 to 60 oC of 100%. Additionally, the measurements illustrate the electronic resistance to DC at room temperature and 100% relative humidity of this film that is greater than 20 M. Shujahadeen B. Aziz1 and co-others (2017), 22 investigated the optical properties of PEO and PVA-PEO blended polymer using two procedures to determine the optical band gap and evaluate the types of electronic transitions. The well-established solution cast technique was prepared with a solid electrolyte blended polymer that is movies based on PVA: PEO. The absorption increased and shifted to higher wavelengths as the aluminum salt concentration increased. Lowering the energy band gap by shifting the absorption edge to lower photon energy shows high reactivity between the aluminum salt with the blended polymers. The doped samples display an increase in refractive index. Many studies extendedly investigate the mixing of this polymer with several nanomaterials and investigate their applications.
Despite all the previous studies, this PEO with ultra-high molecular weight (5 000 000 g mol−1) is not characterized, investigated, or mixed with other polymers or nanomaterials to the best of our knowledge. This investigation is the first study that could give a good opportunity to unravel this material and display the molecular weight influence in comparison with other studies. Therefore, this investigation focuses on fabricated new nanocomposites using UHMW-PEO: PVA that was mixed firstly with different ratios from both polymers, then reinforced with graphene nanosheets using the advanced acoustic mixing method. The fine dispersion of GO and the fine homogeneous mixture of polymers were obtained in the matrix. PVA with a different loading proportion was used to ameliorate UHMWPEO properties and increase the cross-linkage amongst UHMWPEO and graphene nanoscale panels. FTIR, OM, and UV-Visible Spectrophotometer were used to characterize the effect of GO nanosheets on the tunable bandgap and optical behavior of the new nanocomposites.
Experimental part
Materials
Sigma-Aldrich company in the UK was supplied with the high molecular weight PEO (5 000 000 g mol−1) and graphite powder (40 M), as well as other materials for graphene preparations. Media Labs Pvt. Dindori, Nashik, India provided PVA with a molecular weight (160,000) gm−1.
Methods
Graphene oxide purification
GO was synthesized according to modified Hummer 24 methods, which are explained briefly in the support information Figure (1S), in addition to the characterizations of synthesized GO. The procedure of syntheses of GO followed the method described in our previous publication. 25
Purification of the nanocomposites
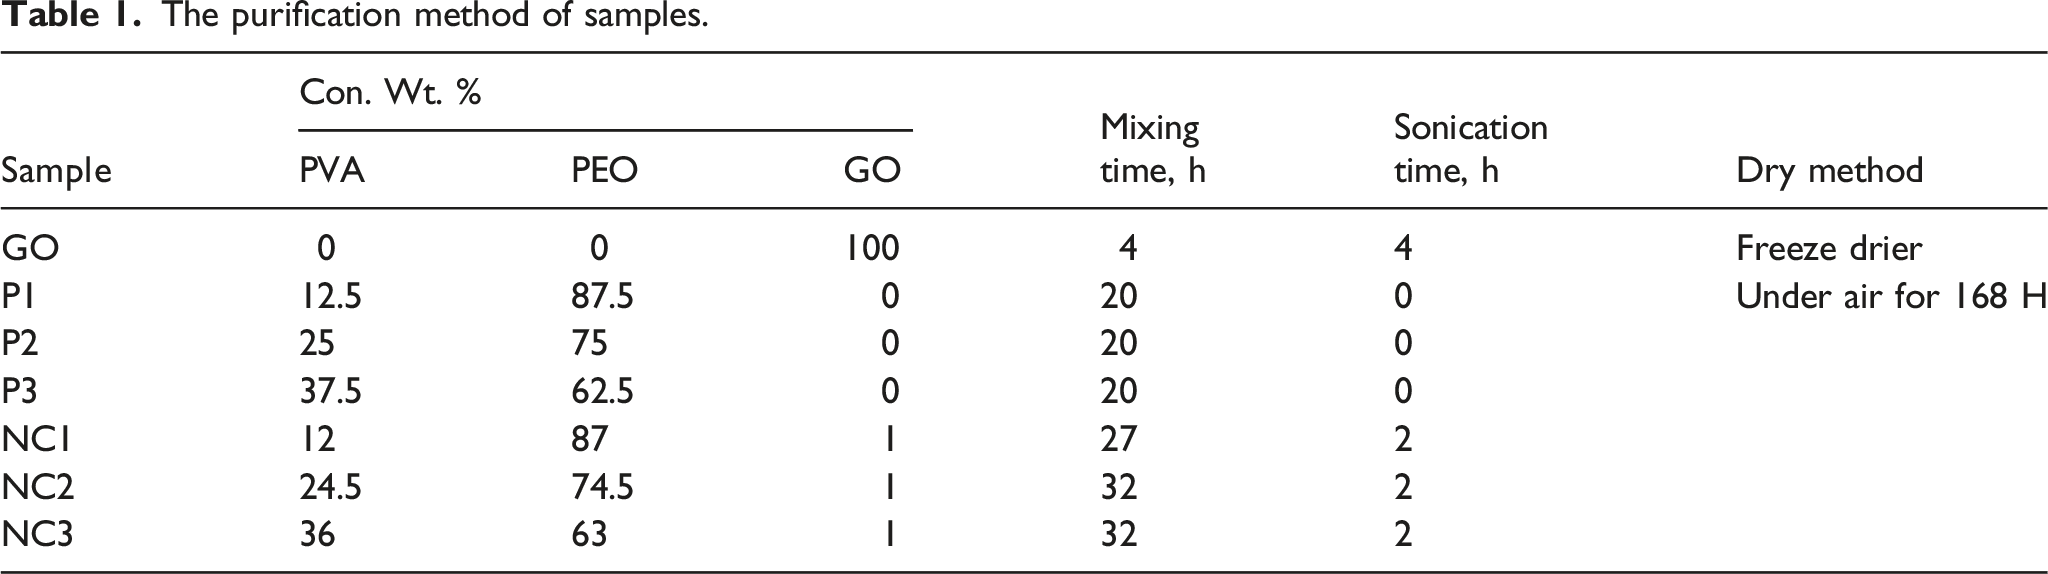
UHMWPEO and PVA were thrown in distilled water separately using a magnetic stirrer under 50 oC firstly, and then it was mixed applying several different proportions as UHMW-PEO: PVA (87.5:12.5, 75:25, and 62.5:37.5 wt. %), these mixing ratio samples were fully homogenous, whereas using ratio of PVA equal and above than 50 wt. % show separation after leaving the samples for a few hours. GO was added with 1 wt. % for the samples to fabricate the new nanocomposites.
The purification method of samples.
Characterizations
Fourier Transforms Infrared (FTIR) made by Bruker Company, Germany, model (vertex 70) is working in the range between 4000 -500 cm−1. XRD Diffraction manufactured by Phillips Company in Holland, model Xpert was used to characterize the samples. UV-Visible double beam spectrophotometer model (Vertex 701) is used to characterize the optical properties in the region between (4000–400) cm−1 that is manufactured by Phillips company, Japan. The optical microscope (OM) model (Nikon - 73,346) made in Japan by Olympus Company was used to capture the optical images of the samples with a magnification of 40X. Filed Effect Scanning Electron Microscopy (FESEM) made by Tescan company, France, model Mira-3, and within (1.2 nm at 30 kV) and (2.3 nm at 3 kV). In addition, the source of Sr-90 with 0.1 µ CI, 28.6 years radioactivity activity of Beta radiation was pleased 7 cm away from the counter, which is the Geiger detector. The samples were delighted 3 cm away from the source to measure the absorption of the samples to the Beta radiation.
Theoretical calculations
The ratio between the intensity of absorbed light (IA) on the incident light (Io) of a material is known as absorbance (A).
26


(n) is the index of refractive and (k) the coefficient of extinction of the film that was considered from the following calculations.
29


Results and discussions
Figure 1 shows the FTIR spectra of UHMWPEO-PVA blended polymers and UHMWPEO-PVA/GO nanocomposites with various mixing ratios of polymers. It was recorded between the ranges of (4000–500) cm−1 wavenumber. FTIR spectra of the (PEO-PVA) appeared at 2882 cm−1 of (methyl C-H symmetric stretch), 1340 cm−1 of (C-H3 links), 3285 cm−1 of (O-H) bond, 1716 cm−1 of (C=O) bond, 1278 cm−1 of (O-H) bond, 959 cm−1 of (C-H) bond, and 1092, and 840 cm−1 of (C-O) bond. These peaks show a good and strong interaction between polymers and confirm the preparation of strongly bonded polymers in comparison with the polymer results, and these results are in agreement with the other finding.23,25 FTIR spectra of (UHMWPEO-PVA) blended polymers and (UHMWPEO-PVA/GO) nanocomposites.
The contribution of the GO nanosheets sheets exhibited notable strong interfacial integration that was associated with shifting the most peaks from their positions, in addition, to change in the intensity to higher intensity, such as (C-H2) methylene, C-H symmetric stretch, and carbonyl (C=O) at the peaks (2880, 1716, and 1466) cm−1, in addition to (C-H3, O-H, and C-O-C,) bands links for peak position (1341, 1278 and 1095) cm−1 respectively, as presented in Figure 1. This interaction could be associated with the formulation of the intermolecular hydrogen bonding among these polymers and the functional site on the surface of GO nanosheets in strong agreement with other researchers finding.30,31 Moreover, this interaction is reported between the ether collection (C–O–C) sites of PEO with the carbonyl groups C=O and –OH as the polar functional groups of GO nanosheets.25,32
The XRD analysis is employed to examine the material structure and determine whether they are crystalline or amorphous. Figure 2 displays the X-ray spectra of UHMWPEO and PVA pure and after blending with GO. The GO showed a sharp peak at 2θ = 11o associated with the (002) deflection of the GO chips, in agreement with the literature.
33
The GO peaks that are not presented in the samples could be related to the low loading ratio or orientation of nanosheets in agreement with the other finding.
34
The PEO pattern showed peaks at 19.1o and 23.37o, which correlated with (120) and (112). This could be the main reason to overlap and disappearance due to the high intensity of PEO peaks and strong interaction. This is presented through the significant shift of the PEO peak to 19.48o and 23.53o after the loading ratio of PVA with 12.5 wt. %. Additionally, the contribution of graphene oxide with 1 wt. % revealed another shifting in the second to 23.7o, compared with the pure PEO. XRD patterns of PEO, GO, blended polymer, and nanocomposites.
The increase of the PVA ratio to 25 wt. % in the matrix exhibited another notable shifting in peaks position to 19.7o and 23.86o. Whereas the contribution of GO was shifted to 19.48o and 23.61o. The addition of PVA and the contribution of GO revealed a reduction in the peak intensity compared with the PEO peaks, where this behviour is reported by other investigations.25,35
Interestingly, this shifting was continuous with increasing the PVA to 37.5 wt. %, where the PEO peaks were shifted to 19.48o and 23.61o, whereas the contribution of GO revealed another shifting and 23.7. The addition of PVA and the contribution of GO revealed a reduction in the intensity of the peaks compared with the net of PEO peaks. Therefore, the crystallite size (D) in (nm) of the sample peaks was estimated from the Scherer formula (10).
5

Summarized the (K), (β),

Figure 3 reveals the optical microscopy images (OM) of UHMWPEO-PVA films and UHMWPEO-PVA/GO nanocomposites with different UHMWPEO and PVA mixing ratios with 40X magnification. The images clearly show the fine homogeneous matrix of the blended polymers, with a good dispersal of GO in the nanocomposites films. OM photo showed that this method was fully successfully fabricated the blended polymers and nanocomposites. Moreover, the NC1, which included the higher ratio of UHMWPEO illustrated the best distribution of GO in the matrix. GO contribution resulted in significant changes in these films without aggregation or affecting the optical transparency of the prepared nanocomposites in agreement with the works of literature.26,36 Optical microscopy (OM) images of (UHMWPEO-PVA) films and (UHMWPEO-PVA/GO) nanocomposites with (40X) magnification.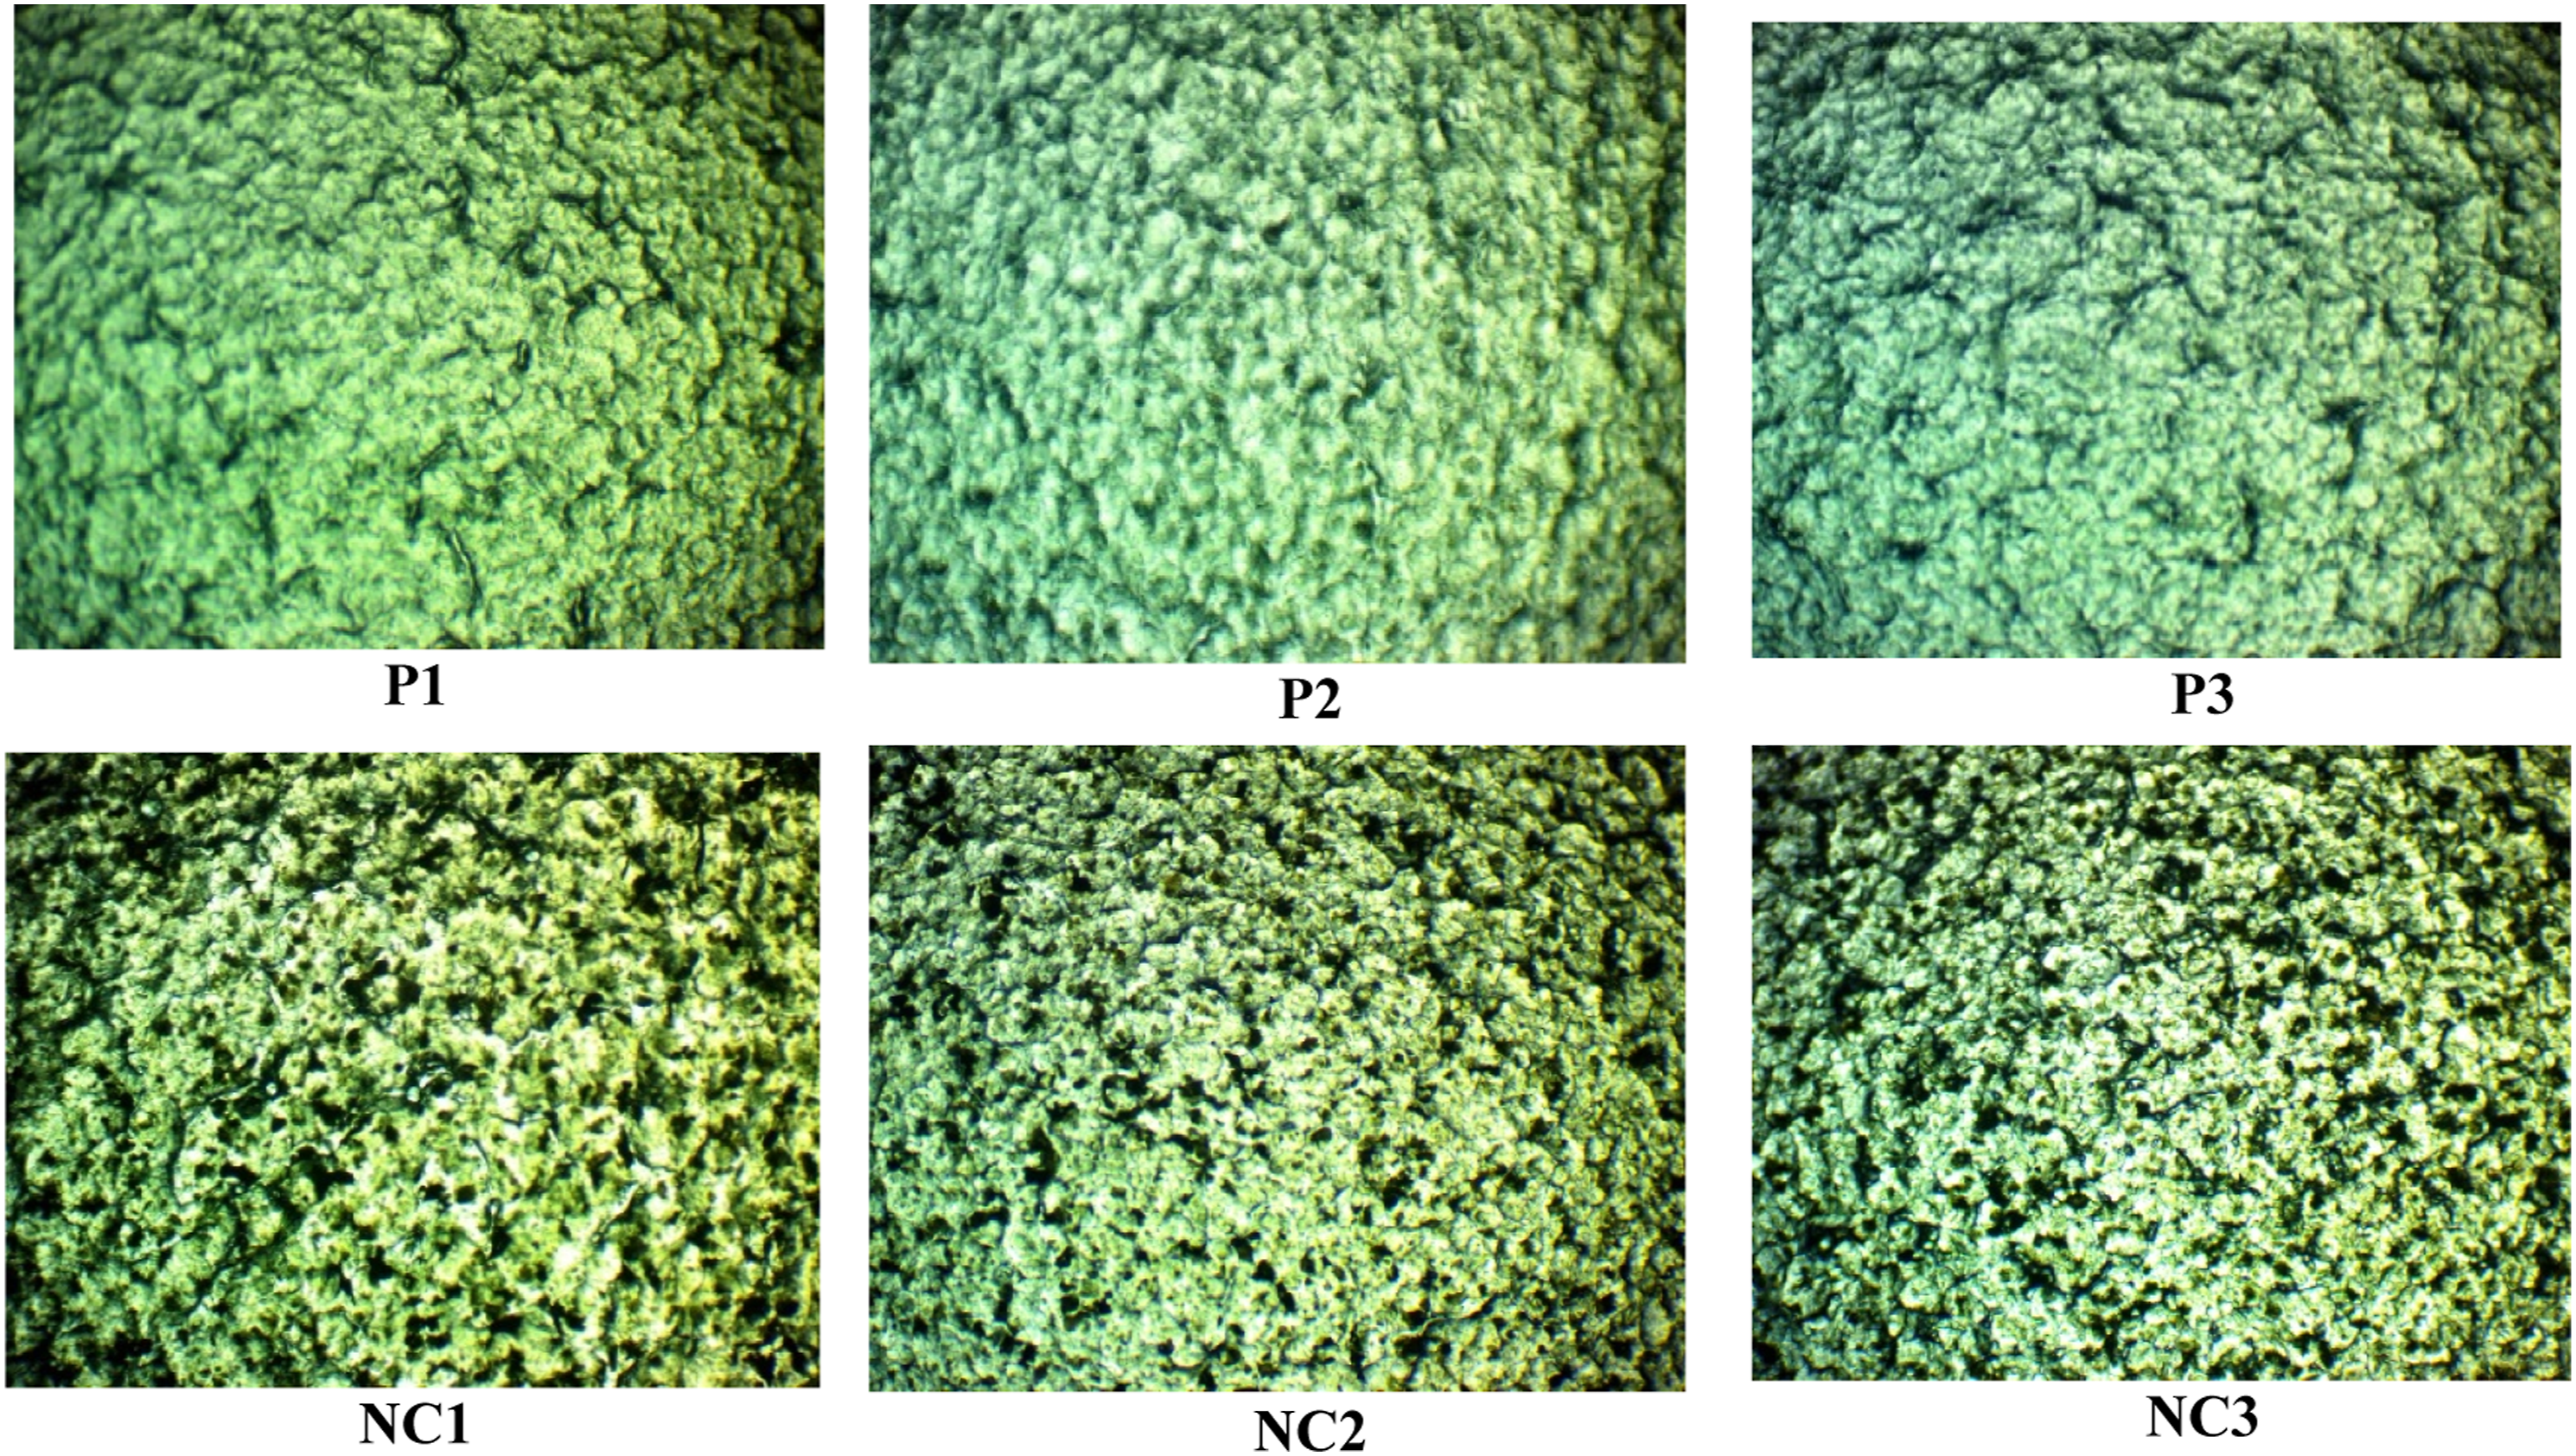
The UV-Visible absorption spectra of PEO-PVA blended polymer and nanocomposites were characterized in the region (200–1100) nm wavelength that is exhibited in Figure 4(a). At 200 nm, the blended polymer samples exhibited absorption peaks. Interestingly, samples that contained a higher ratio of PEO exhibited better adsorption behavior, where P1 revealed the best results compared with other blended polymers. Meanwhile, the contribution of GO showed notable enhancement in the absorption behavior of all the nanocomposites. For comparison, the absorption of samples was calculated at 600 nm to find the improvement of absorption that exhibited enhanced up to 37%, 33%, and 44% of the NC1 and NC2, and NC3 compared with the P1, P2, and P3, respectively. However, NC1 presented the best absorption behavior in comparison with nanocomposites and blended polymers. (a) The absorbance spectra with the wavelength and (b) The absorption coefficient with the photon energy of UHMWPEO-PVA and UHMWPEO-PVA/GO nanocomposite.
Remarkably, the nanocomposites displayed a small peak shoulder at 270 nm that was not revealed in blended polymers. Generally, the covalent bonding interactions or π–π stacking is in the main conjected of GO with the blended polymers that are causing a strong absorption band of 200–300 nm. Where, at 200 nm, the peak transition of plasmonic π-π* (C=C) is the responsibility of the absorption peak of the prepared GO meanwhile the presented shoulder at around 270 nm is conjunctive to the n-π* (C=O) transition. 37 The slowly re-shifted of the plasmonic peak exhibited from 200 nm to 270 nm; this shifting could be increased by increasing the reaction time. 38 The rise in the percentage of the carbon atoms sp2 hybridized could attribute to this shifting, and this behavior is agreed with the literature. 37 Therefore, in the visible light band, the GO absorption is presented as much greater than the absorption of blended polymers.
Figure 4(b) displayed the absorption coefficient with the incident photon energy of the UHMWPEO-PVA films and UHMWPEO-PVA-GO nanocomposite. Interestingly, the blended polymers P1 that consist of a higher ratio of UHMWPEO presented better absorption behavior in comparison with other blended polymers. Meanwhile, the incorporation of graphene oxide nanosheets is associated with a notable increase in absorption coefficient in comparison with the blended polymers. Moreover, NC1, which contains the higher ratio of UHMWPEO, also exhibited the best adsorption behavior in contrast with all other samples. This behavior indicates a high potential for electron transfer, and that increased with increasing the UHMWPEO ratio and GO contribution with increasing the energy. This shows these factors are very important to consider during the fabrication of nanocomposites.
This finding could use the NC1 to infer the nature of direct electron transport for electron transport is the conductivity of (UHMWPEO-PVA/GO) nanocomposites at the expected energy frequency when the absorption coefficient value is low, and electrons and photons can conserve energy and momentum. The results indicate that the absorption coefficient of the (UHMWPEO-PVA/GO) nanocomposites had values smaller than 104 cm−1 which means it is an indirect gap, in accord with the literature. 39 When the level of energy is low, the absorption tends to decrease, which indicates the electron transitions were low. Generally, this performance was changed with increasing the energy of a photon, this indicates a high potential for electron transfer.40,41
Figure 5(a) and (b) show the differences between (αhυ)1/2 and (αhυ)1/3 absorption edges of the UHMWPEO-PVA blend polymer and UHMWPEO-PVA/GO nanocomposites as a photon energy function. Drawing a straight line starting from the top of the curve to the direction of the (X) axis at the value (hυ)r = 0 yields the indirect (tolerable) energy gap transition.
5
(hυ)1/2 = 0, (hυ)1/2 = 0, and (hυ)1/2 = 0, it can show that the energy gap and permissible values of the UHMWPEO-PVA mixture decreased in the samples. (a) The optical energy gap for the allowed direct transition (αhυ)1/2 and (b) the forbidden direct transition with the photon energy of UHMWPEO-PVA films and UHMWPEO-PVA-GO nanocomposites.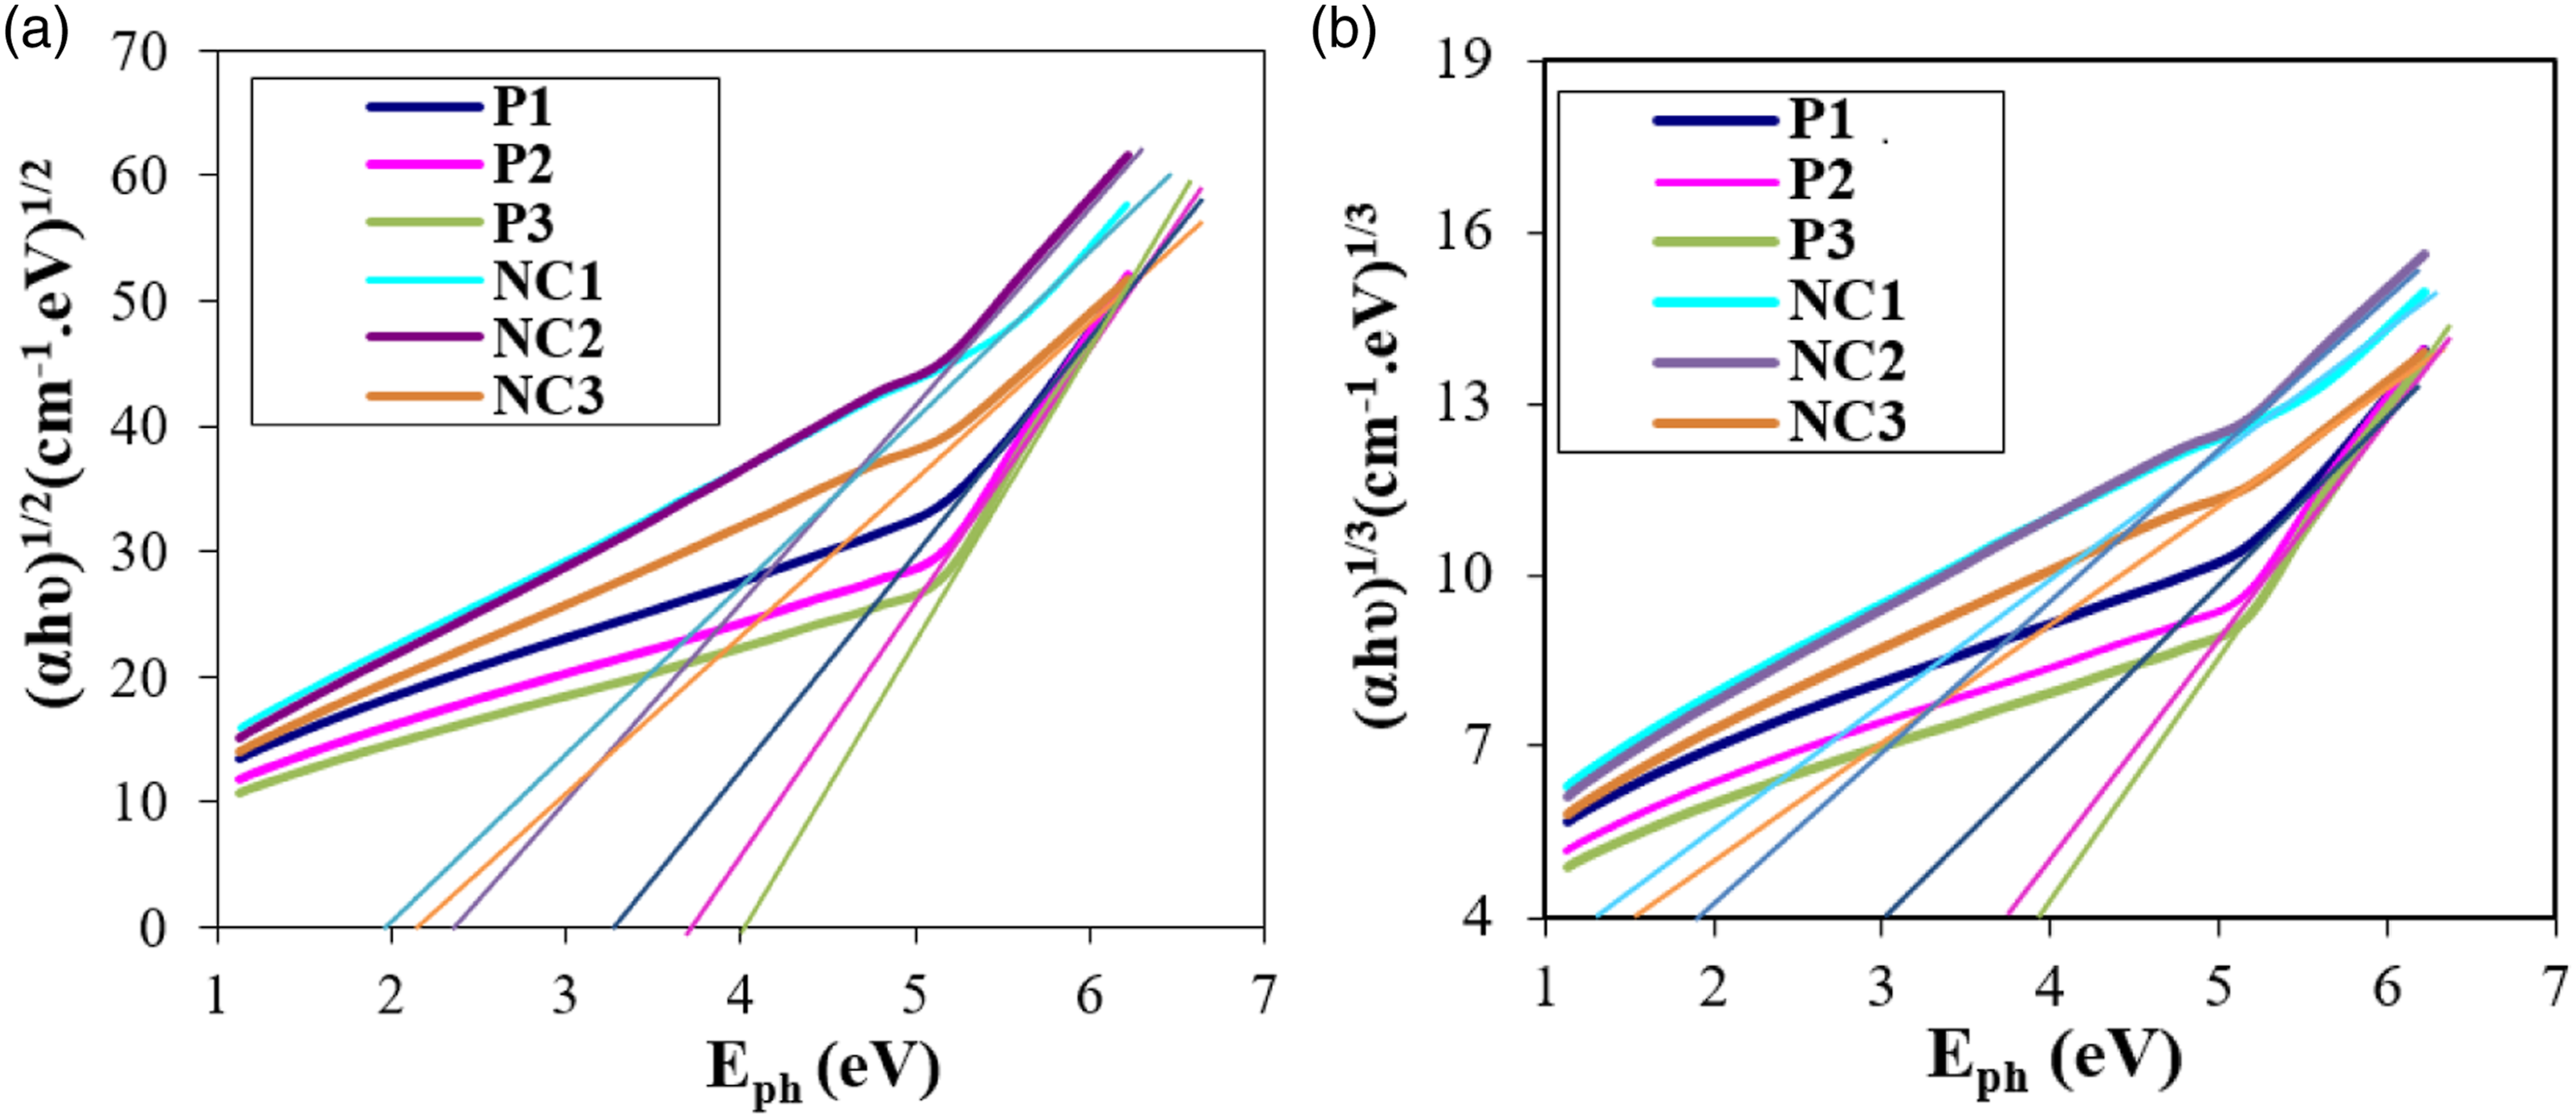
The optical energy gap of samples.

Figure 6 demonstrates the changes in the extinction coefficient of the (UHMWPEO-PVA) nanocomposites with wavelength. With the addendum of graphene oxide nanoparticles to the polymer mixture, the extinction coefficient results of blended polymers enhanced with the rise of the PEO ratio in the samples. Further, graphene oxide nanosheets can alter the composition of the polymer mixture (PVA - PEO). In addition, GO significantly increased the absorption, and accordingly, the extinction coefficient increased. This is because the absorption coefficient and the extinction coefficient have a close relationship number.
6
The best results were obtained for the compound P1, and NC1 in comparison with other polymers, and this behavior is agreed with the literature.5,43 The Extinction Factor (K) of UHMWPEO-PVA films and UHMWPEO-PVA/GO nanocomposites with the wavelength.
The changes in the real and imaginary dielectric constant with the wavelength of UHMWPEO-PVA films and UHMWPEO-PVA/GO nanocomposites are illustrated in Figure 7(a) and (b). These figures exhibited the real and fictional parts of the dielectric constants of the UHMWPEO-PVA mixture were improved. The best results exhibited that the P1 revealed the better results. Meanwhile, the addition of GO nanosheets should significantly improve all results and the best results were obtained for the NC1 nanocomposites. That is due to the increase in the electrical polarization of the nanocomposites after the addition of graphene oxide nanostructures and a higher concentration of PEO, this also improved the isolation constants, both real and theoretical. This behviour of constants comes in agreement with the literature
26
after loading the GO in the different molecular weights of PEGs. (a) The real dielectric constant and (b) the imaginary dielectric constant of UHMWPEO-PVA films and UHMWPEO-PVA/GO nanocomposites with the wavelength.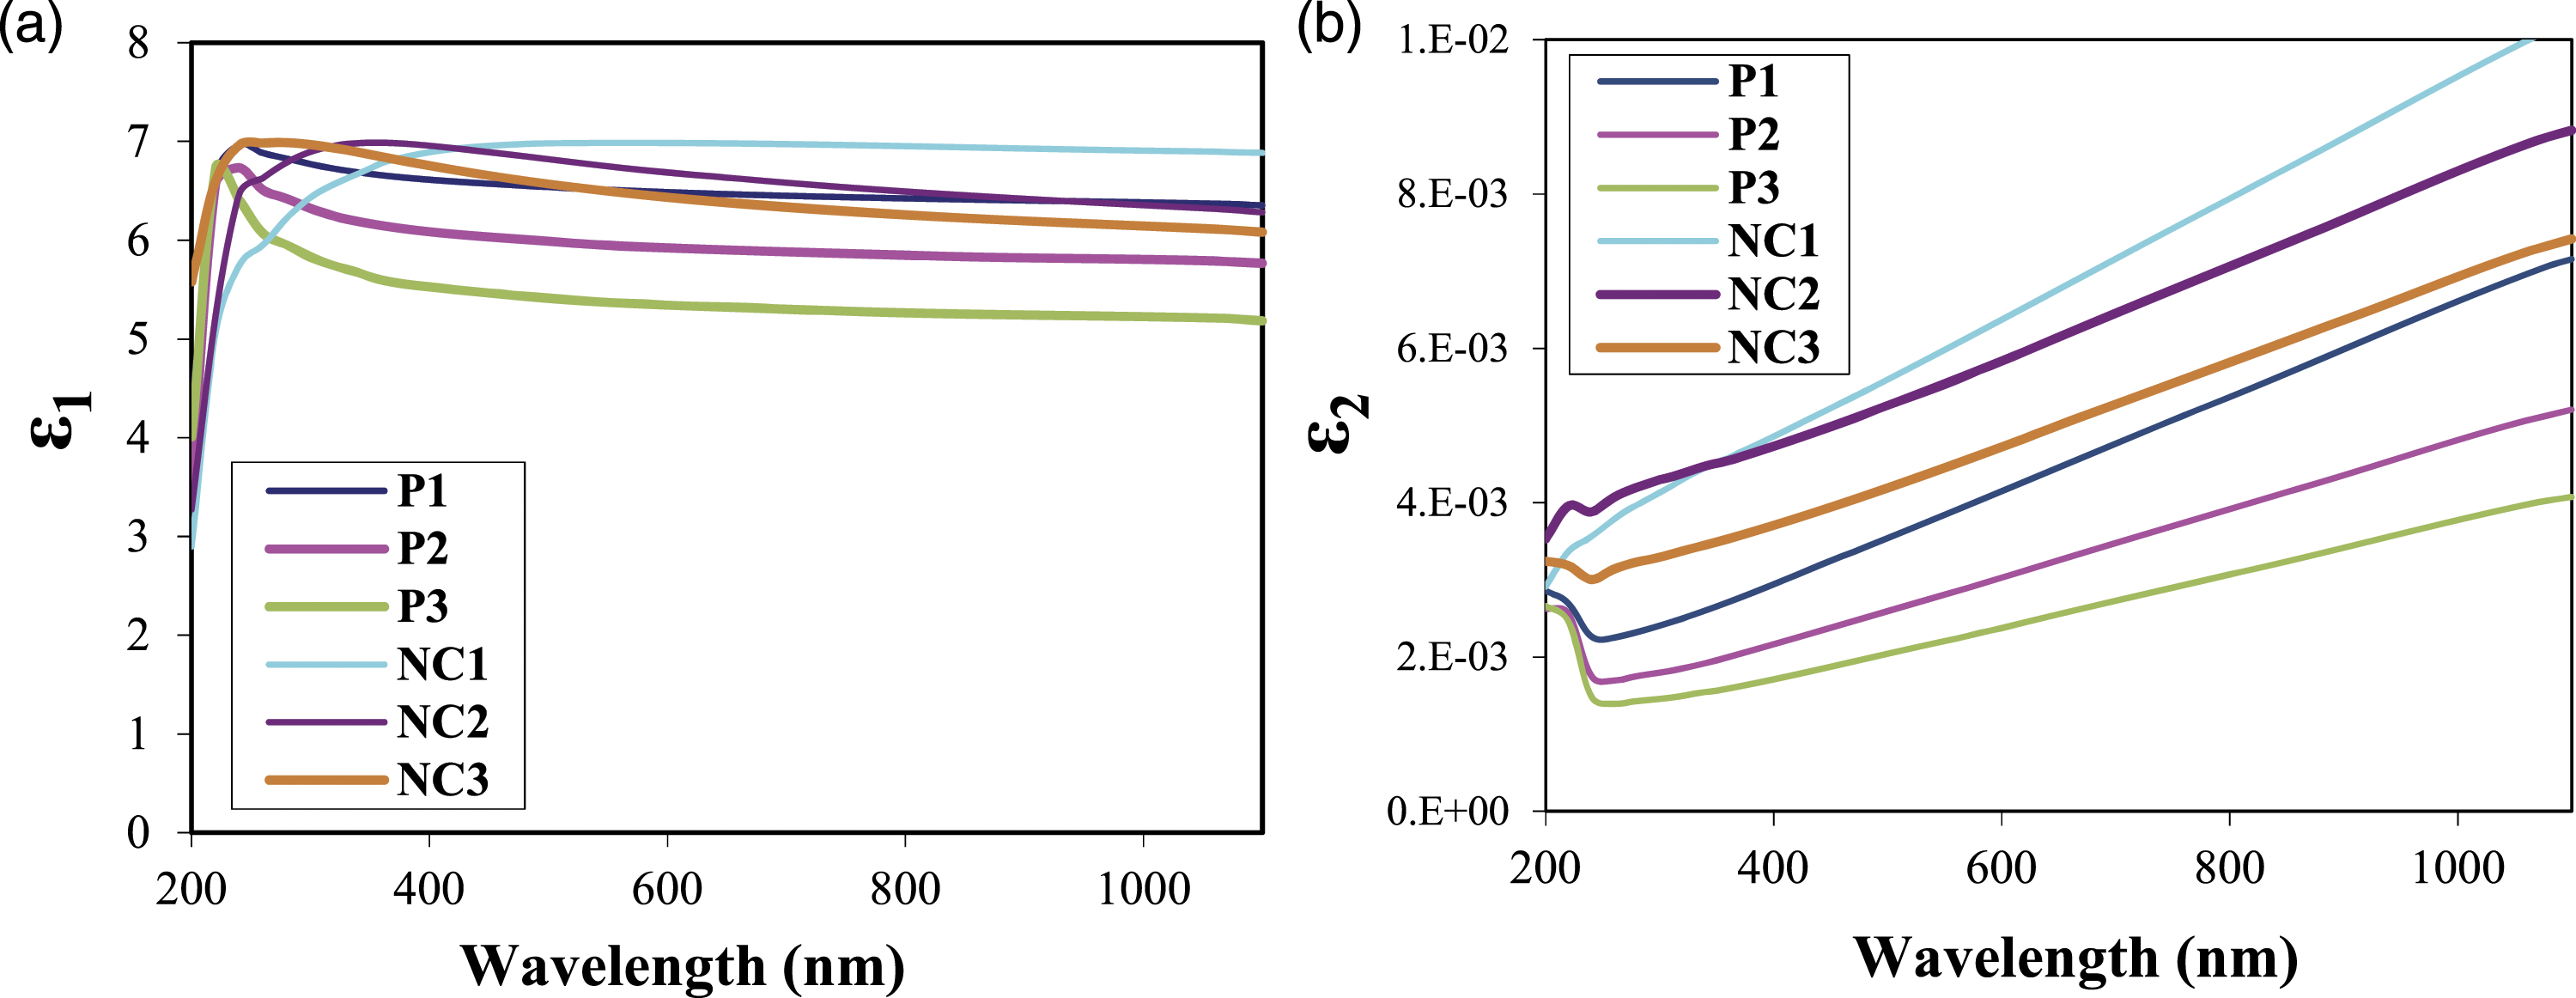
Figure 8 displays the transmittance (T) spectra of the PVA- UHMWPEO and PVA- UHMWPEO/GO nanocomposites as a function of wavelength, showing that the permeability of all samples increased rapidly as the wavelength was increased to about 240 nm, then remained nearly constant after 260 nm. The best absorption results were exhibited in the PVA-PEO mixture (P1) and their nanocomposites (NC1). The results clearly showed that GO affects the reduction of light transmittance but does not affect the transparency of the composites,26,36 this behavior is consistent with the literature.
44
The transmittance spectrum of UHMWPEO-PVA films and UHMWPEO-PVA/GO nanocomposites with a wavelength.
The surface morphology of blended polymers and nanocomposites was examined using a FESEM as shown in Figure 9. FESEM images of the surface morphology of the blended polymer revealed a grainy and rough that were accumulations of homogeneous films. The contribution of GO nanosheets in the polymer matrix of the nanocomposites displayed good dispersion and granular structure with some aggregations of particles due to the van der Waals forces, whereas most of the GO nanosheets were well-scattered and densely dispersed on the surface of the nanocomposite films with well-distributed of GO nanosheets into the surface that indicated changes in surface shape. This may imply a homogeneous growth mechanism. The results confirm the researchers' findings and optical microscopy images. The FESEM pictures (G and H) in Figure
12
depicted the GO size measurements ranging from a few nanometers to a few microns. FESEM image of the sample surface, and (A and B) showed the nanosize of measurements in nanocomposites.
Figure 10 revealed the ability of newly fabricated nanocomposites to adsorb the radiation. Figure 10(a) and (b) illustrates the Ln of radiation attenuation (N) with the increasing the PVA ratio of PEO-PVA blended polymer and nanocomposites. It is noticed the new fabricated blended polymer was adsorbed to the radiation ray. Moreover, the contribution of GO nanosheets has significantly enhanced the adsorption of the ray radiation compared with the blended polymers. Radiation attenuation was calculated using formula (11).
45
(a) The Ln of radiation attenuation (N), (b) the proportion between the radiation attenuation (N) with the radiation particles number (N
o
) as (N/N
o
), and (c) the attenuation of source radiation coefficient (μ) with increasing the PVA ratio of PEO-PVA blended polymer and nanocomposites.

As exposed in Figure 10(c), the mass attenuation coefficient depends on the compositions of the shielding material and the incident photon energy. Where the mass attenuation coefficient increases considerably after the contribution of GO in the nanocomposites in comparison with the polymer matrix. This can be explained through the three main photon interactions with matter which are the photoelectric effect, Compton scattering, and pair production.45,46 Where the cross-sections for the photoelectric interactions are sufficiently high and photons are prone to be absorbed mainly by the photoelectric effect. Therefore, the loading of GO nanosheets in the polymer matrix that has a strong photon absorption capability of up to 2.3% for each graphene layer over a broad wavelength range, which makes it suitable for specific applications. 47 Materials with large mass amounts, high atomic numbers, and density were required for attenuation of the radiation rays for shielding application, therefore the addition of the GO nanosheets increased the mass per area in the radiation rays path that expects to exhibit better shielded due to it is the probability for absorption passed radiation-ray through the nanocomposites leads to an exponential decrease of intensity of pass radiation. 5 In comparison with the polymer-based results, the nanostructured GO nanosheets are an effective and efficient high-value-added alternative for use in radiation shielding materials in agreement with the other results that reported the use of the nanostructured materials that reduced the attenuation the gamma rays. They reported that nanocomposites and gamma photons influence one another, where nanocomposites with a higher ratio of nanostructures such as SeO2, 48 CdO, 46 PbO, 49 GO, 5 and nano-BaSO4 50 have better radiation attenuation properties that have a higher content of the polymer.
Conclusions
The developed methods successfully produced new nanocomposites fabricated from UHMWPEO with PVA and loaded with GO nanosheets. The nanocomposites reveal a good interfacial interaction between polymers and GO, as revealed by FTIR. The XRD spectra revealed a shifting in the polymer crystalline peaks after the change to a higher peaks position of PEO with increasing the loading ratio of PVA, whereas the contribution of GO nanosheets reduced the peaks position of the PEO in the polymer matrix. Additionally, GO contribution decreases the average crystal size of blended polymer PEO-PVA compared to the PEO. OM showed homogeneously blended polymers and fine dispersion of nanosheets in the polymer matrix, which was confirmed by the SEM images. The optical properties revealed a higher absorption of the samples containing a higher ratio of UHMWPEO. Where UHMWPEO presents an important absorption behavior that is significantly enhanced by increasing the concentration of UHMWPEO in both samples blended polymers and nanocomposites. GO exposed outstanding tunable of the energy gap where it turns the blended polymer from insulation to the semiconductor. Where energy gap values improved up to 160% of the nanocomposites. The results show improvement in optical properties, with the highest value of electromagnetic radiation absorption in the ultraviolet field (about 300 nm in wavelength). These results with notable absorption behviour and bandgap of the nanocomposites have the potential to contribute to solar cells, electronic devices, and a wide range of various applications. Furthermore, the contribution of both PVA and GO nanosheets has expressively improved the adsorption of the ray radiation compared with the blended polymers that make these materials promising for shielding applications.
Supplemental Material
Supplemental Material - Tuning the bandgap and absorption behaviour of the newly-fabricated Ultrahigh Molecular weight Polyethylene Oxide- Polyvinyl Alcohol/ Graphene Oxide hybrid nanocomposites
Supplemental Material for Tuning the bandgap and absorption behaviour of the newly-fabricated Ultrahigh Molecular weight Polyethylene Oxide- Polyvinyl Alcohol/ Graphene Oxide hybrid nanocomposites by Nisreen R Aldulaimi and Ehssan Al-Bermany in Polymers and Polymer Composites
Footnotes
Acknowledgements
We would like to thanks the composites groups, materials physics departments at the University of Sheffield, the UK and the University of Babylon, Iraq as well as the nanomaterials center in the Ministry of higher Education and scientific research, Iraq for their support.
Declaration of conflicting interests
The author(s) declared no potential conflicts of interest with respect to the research, authorship, and/or publication of this article.
Funding
The author(s) received no financial support for the research, authorship, and/or publication of this article.
Supplemental Material
Supplemental material for this article is available online.
References
Supplementary Material
Please find the following supplemental material available below.
For Open Access articles published under a Creative Commons License, all supplemental material carries the same license as the article it is associated with.
For non-Open Access articles published, all supplemental material carries a non-exclusive license, and permission requests for re-use of supplemental material or any part of supplemental material shall be sent directly to the copyright owner as specified in the copyright notice associated with the article.