
Abstract
Polypropylene/epoxy/synthetic graphite (PP/EP/SG) and high-density polyethylene (HDPE/EP/SG) composites were prepared by melt mixing followed by compression molding. The immiscibility of the polyolefins with epoxy was confirmed by thermogravimetric analysis. Scanning electron microscopy (SEM) studies showed that HDPE/EP blend exhibits inferior interfacial adhesion between the component polymers compared to PP/EP blend. Also, the effect of SG content on flexural properties, density, moldability, water absorption, and porosity of the PP/EP/SG and HDPE/EP/SG composites was investigated. For both PP/EP/SG and HDPE/EP/SG composites, flexural modulus, density, and porosity increased with increase in SG content. For PP/EP/SG composites, the water absorption decreased from 0.154% at 30 wt% SG to 0.072% at 70 wt% SG. Further increase in SG content to 80 wt% caused an increase in water absorption. On the other hand, water absorption for HDPE/EP/SG increased with SG content all through. At the same filler loadings, PP/EP/SG composites showed lower density and porosity and performed better in terms of flexural modulus and water absorption compared to HDPE/EP/SG composites.
Introduction
Conductive polymer composites (CPCs) based on immiscible polymer blends have been studied intensively due to their good processability, possibility for significant improvement in properties, and many application opportunities.1–3 The potential of these filler-multiphase polymer composites to outperform conventional CPCs consisting of filler-single polymer systems in applications such as sensors, 4 electromagnetic interference shielding, 5 flow plates for redox flow batteries and fuel cells, as well as electrodes for energy conversion and storage devices6–8 has also been widely reported. The ability of immiscible blend composites to achieve superior properties compared to single polymer composites is due to preferential localization of filler in one of the phases or at the interface in immiscible blends,2,9 which leads to lower percolation threshold , 10 higher electrical and thermal conductivities,9,11 and improved processability and mechanical performance.3,12
Thermoplastic–thermoset blends offer combination of mechanical, thermal, and chemical properties as well as ductility and impact strength that are promising for various applications.13,14 Achievement of optimum property combination in these materials requires addition of suitable compatibilizers to the blends to mitigate the effects of polymer incompatibility, which arise from large differences in polarity and high interfacial tensions of thermoplastics (such as polyolefins) and thermosets (such as epoxies). 14 Several CPCs based on thermoplastic–thermoset blends filled with various conductive fillers have been reported.15–19 These composites were usually investigated at low filler loadings and cannot meet the requirements for high conductivity applications. CPCs with higher filler contents have more prospects for such high conductivity applications but are prone to significant degradation in mechanical properties and some physical properties such as water absorption.20–22 Therefore, for such polymer composite systems, investigation of mechanical and physical properties is crucial.
Potential of filled blends of polyolefins such as polypropylene (PP) and polyethylene (PE) with epoxy or novolac resin to achieve higher electrical conductivities than filled single polymers at the same filler loadings has been reported.17,23–25 Although, the unit structures in PP and PE are similar, they exhibit different properties such as degree of crystallinity, surface tension, and viscosity.26,27 This can have significant influence on the behavior of their blend systems and cause blends of these polyolefins with the same polymer to exhibit considerably different properties. In our previous studies,23,25,28 it was found that graphite-filled epoxy (PP/EP) and high-density polyethylene (HDPE/EP) blends (polyolefin: epoxy = 55:45) exhibited higher in-plane and through-plane electrical conductivities than several filled single polymers reported in the literature. Higher electrical performance of PP/EP and HDPE/EP composites was attributed to co-continuous structure of the blends, which favored concentration of filler in the epoxy, leading to more conducting pathways within the composites. These composites have prospects for high conductivity applications such as flow plates for redox flow batteries and fuel cells, as well as electrodes for energy conversion and storage devices where CPCs are envisaged to compete with metallic materials. However, apart from high electrical performance, CPCs are usually required to satisfy other service requirements, and properties of the PP/EP and HDPE/EP composites need to be investigated further to gain a wider understanding of their applicability.
Previous studies on polyolefin/EP blend-based conductive composites only considered carbon black-filled blends at low filler loadings (≤22 wt%).18,19 Also, these studies were mainly limited to conductivity characterization of the composites, and other properties that are key to the application and performance of common CPCs were not investigated. The goal of the present study is to fill this gap by investigating the flexural and physical properties of highly filled polyolefin/EP blends filled with graphite. PP/EP and HDPE/EP composites with varying proportions of SG were prepared, and the effect of graphite content on flexural properties, density, moldability, and water absorption of the composites, which are relevant to applications of common CPCs, are investigated. Also, properties of the produced PP/EP/SG and HDPE/EP/SG composites were compared.
Methodology
Materials
Synthetic graphite (SG) powder (>99% purity, average particle size of 212–425 μm) used is a product of Graftech South Africa (Pty) Ltd Morphology of the SG has been described elsewhere. 23 Bisphenol-A epoxy resin LR 30 (density = 1130 kg·m−3 at’ 25oC) and amine-type hardener LH 30 (density = 940 kg·m−3 at 20oC) with chemical components 3-aminomethyl-3,5,5-trimethylcyclohexylamine and polyoxyalkyleneamine were supplied by AMT Composites, South Africa. A low viscosity epoxy resin was selected for this study due to its better filler wetting attribute. Isotactic polypropylene (PP 427861; density = 900 kg·m−3; melt index 4) and maleic anhydride-grafted polypropylene (MAH-g-PP 427845; density = 934 kg·m−3 at 25oC; maleic anhydride content = 8–10 wt%) used in this study were supplied by Sigma-Aldrich. HDPE (PE 547999; melt index 2.2 g/10 min) and polyethylene-grafted-maleic anhydride (MAH-g-PE 456632; viscosity 1700-45700 cP) used were also supplied by Sigma-Aldrich.
Preparation of Composites
PP/epoxy/SG and HDPE/epoxy/SG composites with 30–80 wt% SG were prepared by melt mixing in a Haake Rheomix OS mixer at 190oC and 60 rpm. An epoxy-hardener weight ratio of 5:1 was used as recommended by the supplier. The weight ratio of each polyolefin (i.e., PP and HDPE) to epoxy was 55:45 while epoxy to MAH-g-PP and epoxy to MAH-g-PE weight ratio of 3:1 was used. The close-to-symmetric blend ratio of 55:45 was chosen to promote formation of co-continuous structure in the blend. 29 Details of compounding procedure for the composites have been described elsewhere.23,25
Compositions of samples prepared in this study.
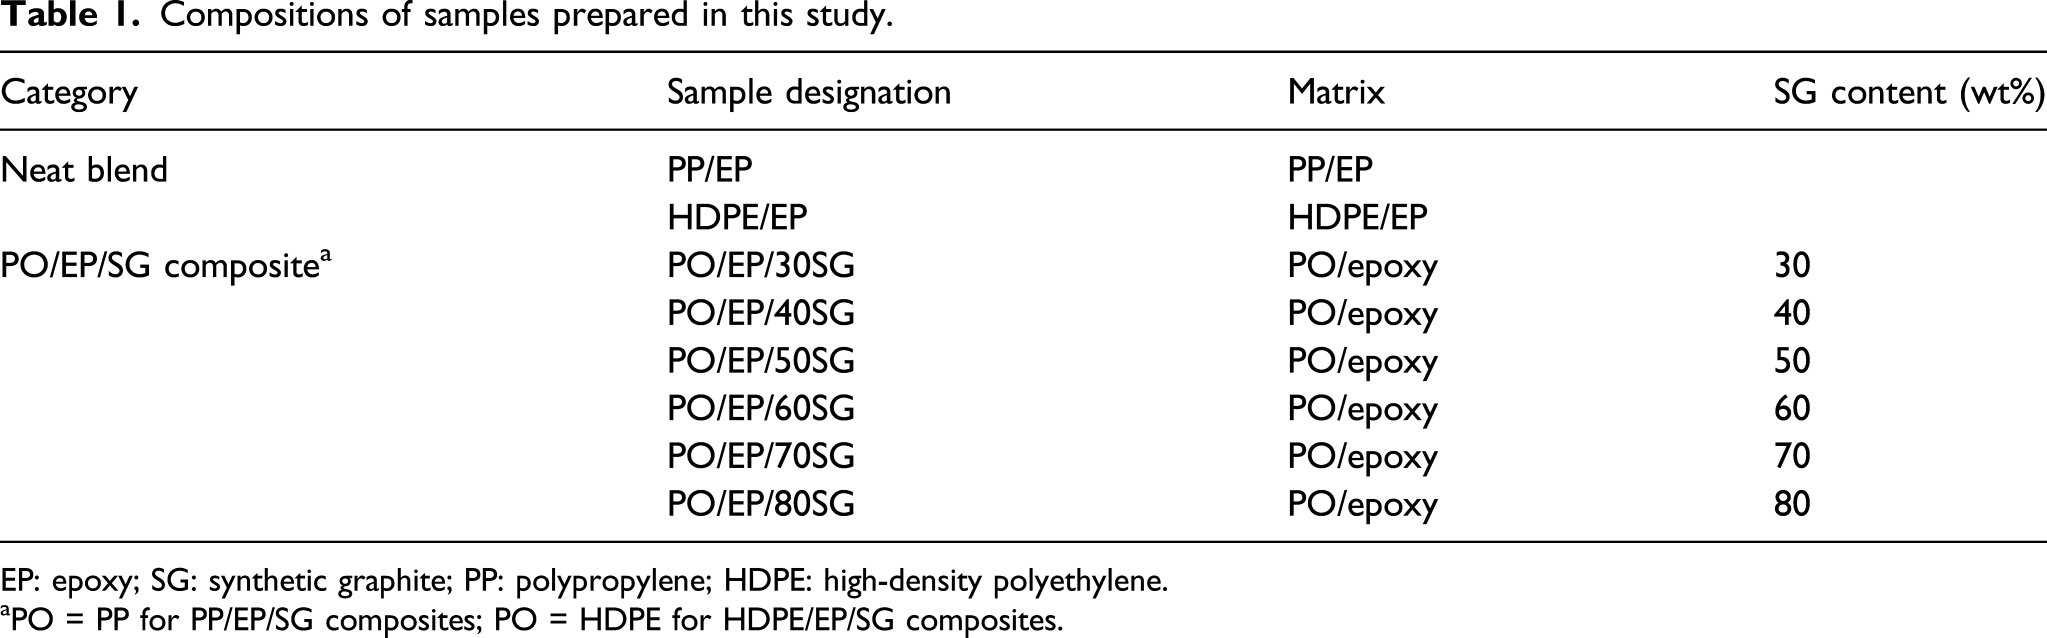
EP: epoxy; SG: synthetic graphite; PP: polypropylene; HDPE: high-density polyethylene.
aPO = PP for PP/EP/SG composites; PO = HDPE for HDPE/EP/SG composites.
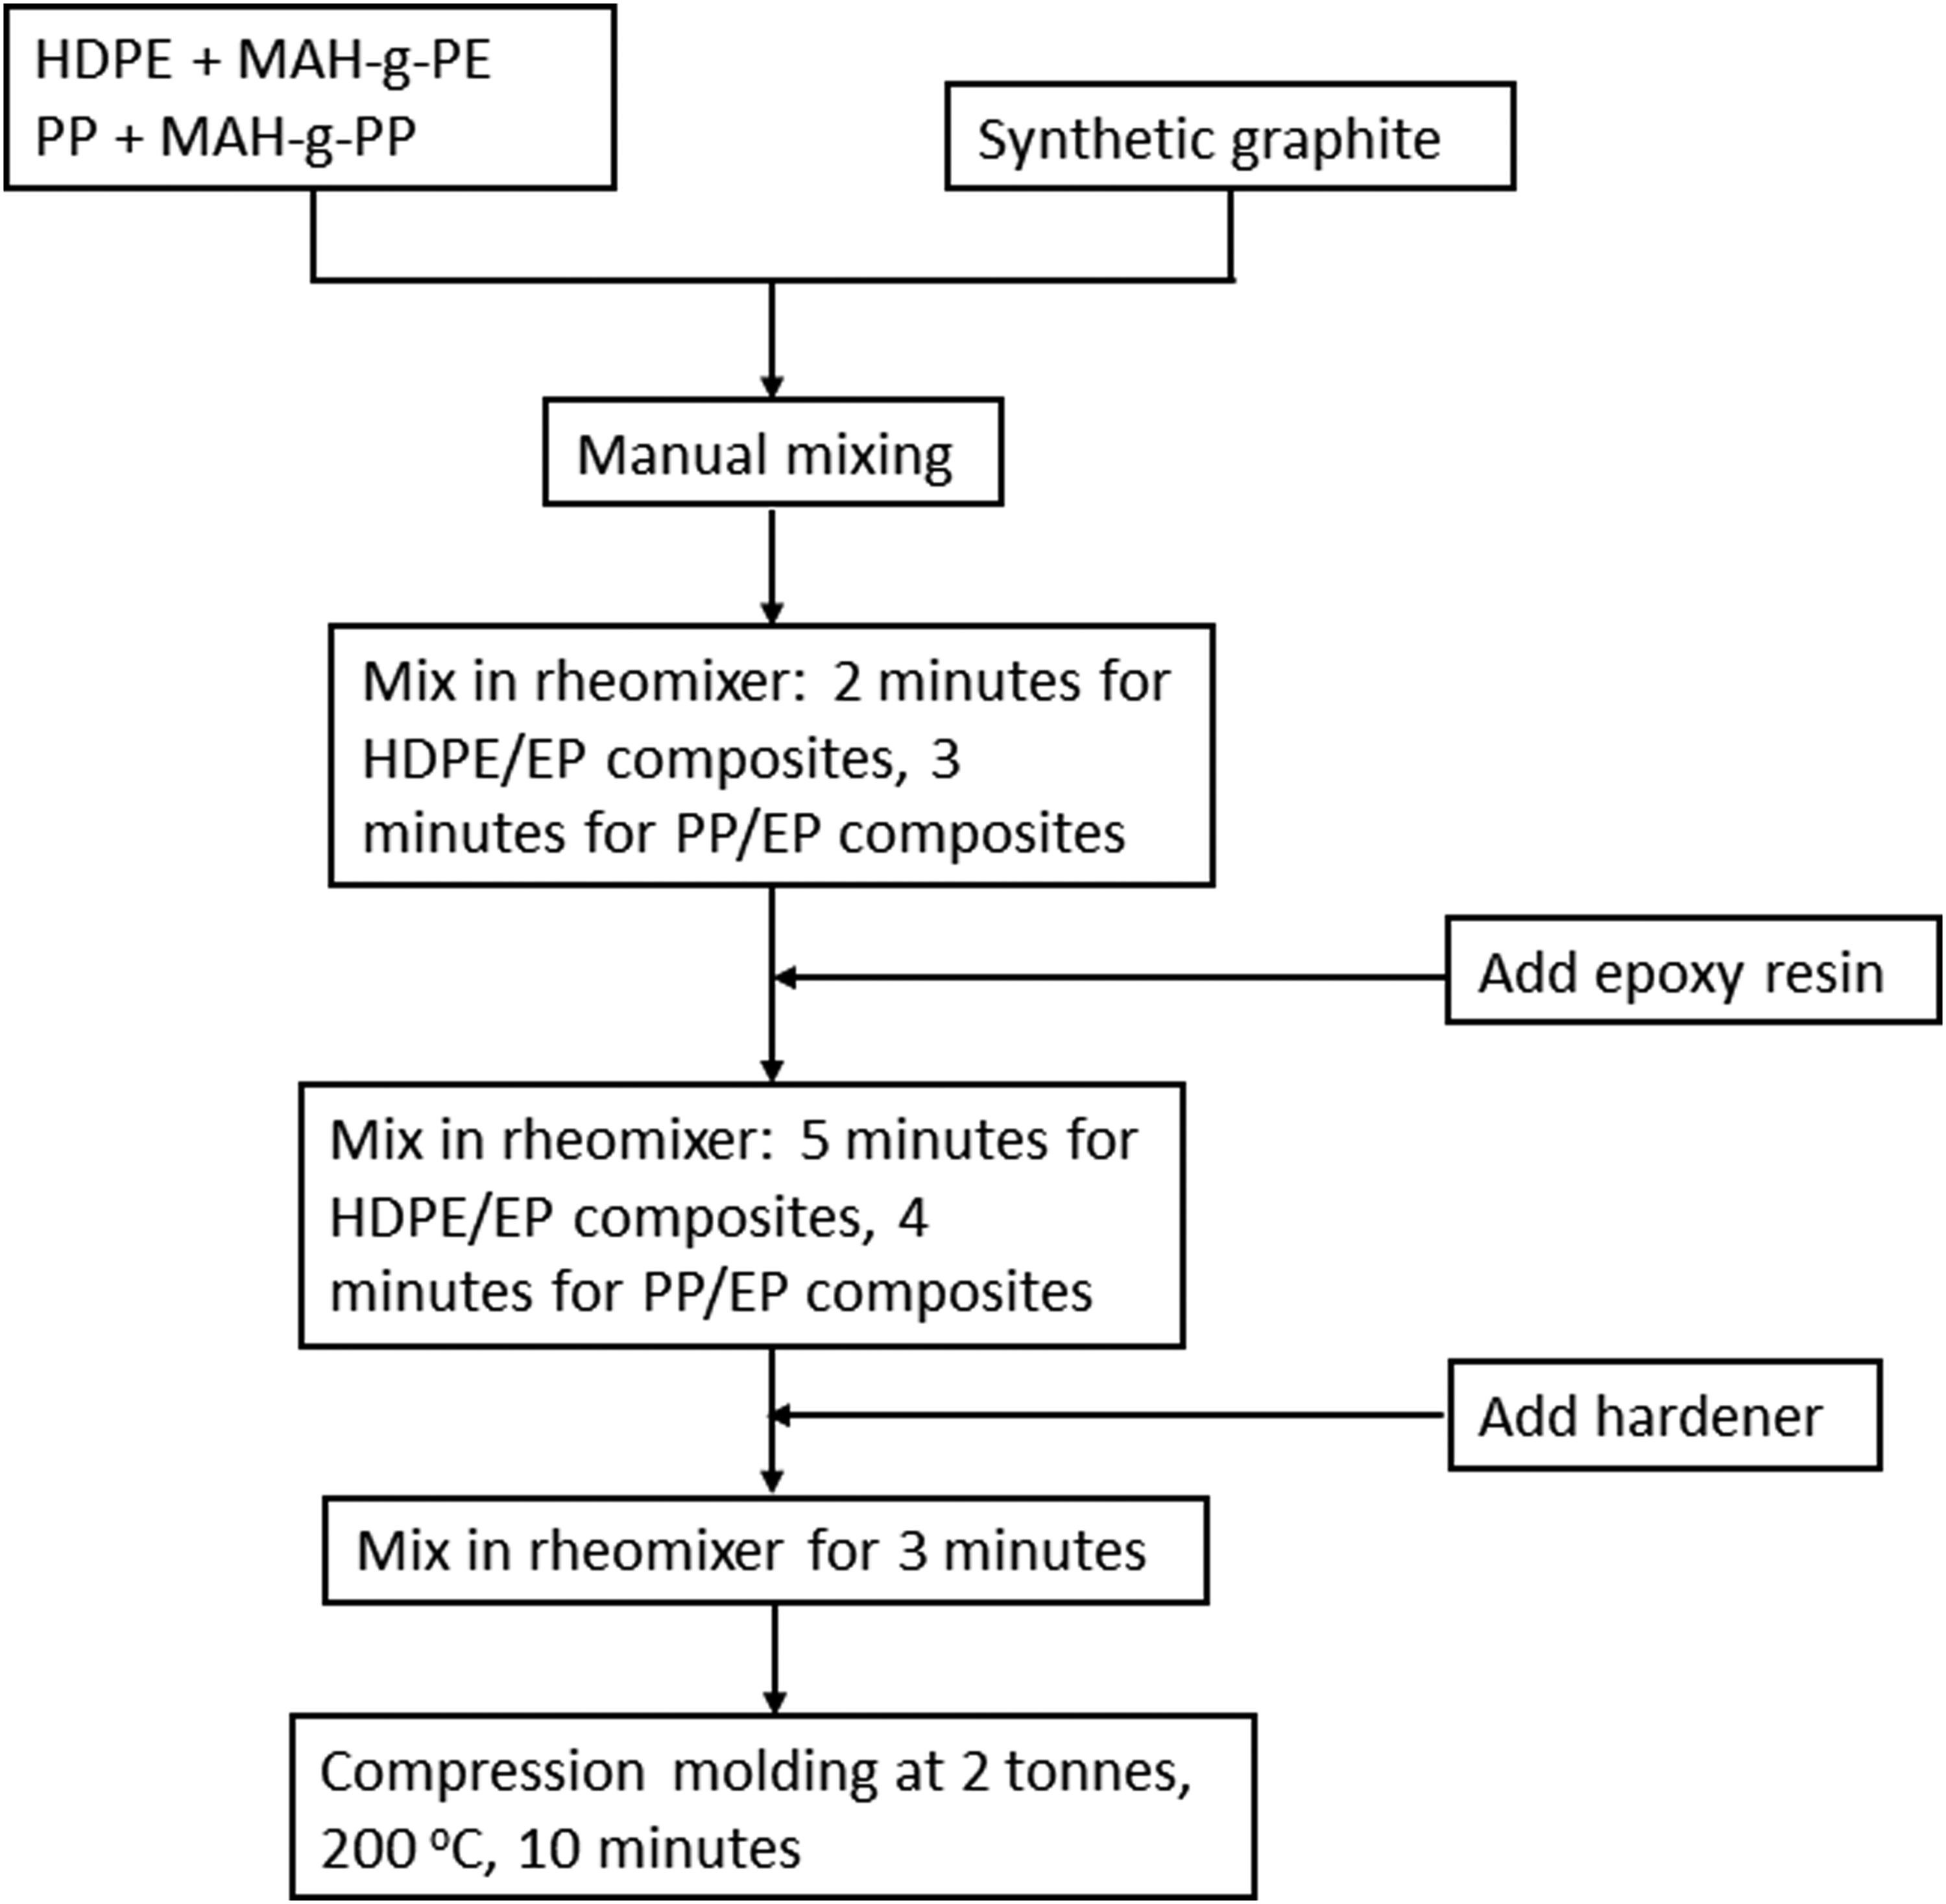
Flow chart showing processes involved in the fabrication of the composite samples.
Characterization of composites
Thermogravimetric (TG) measurements were carried out using a PerkinElmer Pyris 1 TG analysis machine in a nitrogen atmosphere at a heating rate of 10oCmin−1 and a heating range from room temperature to 600oC. The gas flow rate was 40 cm3min−1. Microstructure of neat polymer blends was examined with a TESCAN VEGA3 scanning electron microscope (SEM) using secondary electron mode. Before SEM observation, flexural fractured surface of the sample was coated with 5 nm gold layer using a Q150R S/E/ES plus sputter coater/turbo evaporator. The flexural properties of the composite samples were measured by the three-point bending test using Instron 5966 universal testing machine according to ASTM D 790-03. The support span was 30 mm, and the crosshead speed was 1 mm/min. An average of five readings was recorded for each sample. Densities of the composite samples were measured based on the water displacement method according to ASTM D 792 (Method A).
To determine the effect of filler content on thickness of molded samples, melt-mixed material from each composite formulation was granulated using a polymer granulating machine, and approximately constant volume of material was compression molded. At least 12 measurements of thickness were taken at different locations on each sample and the average was recorded. The water absorption of the composites was measured according to ASTM D 570 using specimens with dimension 13 mm × 13 mm. Dry specimens were weighed and then immersed in distilled water at 60oC. After 24 hours, the specimens were removed, wiped dry of excessive water, and weighed again. Water absorption of the samples was then calculated using equation (1)

Results and discussion
Thermal behavior of neat PP/EP and HDPE/EP blends
Thermogravimetric analysis (TGA) was used to analyze the thermal stability of the neat polymers. Also, since TGA can be used for compositional analysis of polymer blends,30,31 results of the TG measurements were used to assess phases in the PP/EP and HDPE/EP blends.
Thermogravimetric analysis and derivative thermogravimetric (DTG) curves for the PP/EP and HDPE/EP blends are shown in Figure 2. Neat PP/EP blend showed two independent weight losses at 260–340oC and 375–460oC (Figure 2(a)), corresponding to the degradation of epoxy and PP, respectively. Also, HDPE/EP blend showed two independent weight losses at 270–340oC and 390–480oC (Figure 2(b)), which correspond to degradation of epoxy and HDPE, respectively. As shown on the DTG curves, values of temperatures of maximum decomposition rate (Tmax) exhibited by the PP/EP blend are 340oC and 430oC, which can be related to decomposition of epoxy and PP, respectively, while HDPE/EP exhibited Tmax of 340oC and 450oC, corresponding to decomposition of epoxy and PE, respectively. The two-stage degradation behavior exhibited by PP/EP and HDPE/EP blends confirms immiscibility (i.e., presence of two phases) of the polyolefins and epoxy. Thermogravimetric analysis (TGA) and derivative thermogravimetric (DTG) curves of neat (a) polypropylene/epoxy (PP/EP) blend and (b) high-density polyethylene (HDPE/EP) blend.
Morphology of neat blends and composites
Figure 3 shows the morphologies of neat PP/EP and HDPE/EP blends. For neat PP/EP blend, bright threadlike indications of reliefs can be seen on the fracture surface (Figure 3(a)), which show flow during mixing and pressing. Also, no distinct interface between the PP and epoxy can be seen. This can be attributed to good adhesion between the two polymer phases as a result of compatibilizing effect of MAH-g-PP, which decreased interfacial tension and increased interfacial bonding between the two polymers. Scanning electron microscopy micrograph of fractured surface of (a) neat PP/EP blend; (b) neat HDPE/EP blend.
The microstructure of neat HDPE/EP blend (Figure 3(b)) shows a continuous polyethylene phase with a typical spherulitic structure and a distinct epoxy phase, which is also continuous. Co-continuity of PP/EP and HDPE/EP blend structure, which can be attributed to the close-to-symmetric composition of the blends, has been reported in previous studies.23,25 Also, the interface between the two component polymers is distinct in HDPE/EP blend than in PP/EP blend, which indicates a poor interfacial adhesion in HDPE/EP blend compared to PP/EP blend.
High-density polyethylene/ epoxy blend exhibits a much coarser structure (Figure 3(b)) compared to the PP/EP blend (Figure 3(a)). Phase sizes and effectiveness of compatibilizer in improving the interfacial adhesion and lowering interfacial tension between components of immiscible blends are dependent on several factors such as concentration, molecular weight, and chemical nature of compatibilizer in combination with the blend system. The complex interplay among these factors determines the effectiveness of compatibilization and specific effect of the compatibilizer.32,33 The difference in phase size and morphology of interfacial region in PP/EP blend compared to HDPE/EP blend suggests that, at the same compatibilizer concentration, MAH-g-PE in the HDPE/EP blend was less effective in preventing coalescence of the constituent phases and reducing interfacial tension between the blend components than MAH-g-PP in PP/EP blend. As further revealed in Figure 3(b), distinct smooth and rough regions, which represent the brittle epoxy and ductile polyethylene phases, respectively, are present in the flexural fractured surface of the HDPE/EP blend. Such clear distinction is absent in the microstructure of PP/EP blend (Figure 3(a)). This can also be attributed to the superior compatibilization achieved with the MAH-g-PP in PP/EP blend compared to MAH-g-PE in HDPE/EP blend, which would lead to more chain entanglement and blending of phases in the PP/EP blend.
Flexural properties of neat polymer and composites
Load-bearing properties of polymer composites are influenced by the load-bearing response of the matrix.
34
Therefore, flexural behaviors of PP/EP, HDPE/EP, and the individual polymers were studied and presented in Figure 4. Flexural modulus of PP/EP blend is ≈7% lower than that of neat epoxy and ≈51% higher than that of PP. On the other hand, flexural modulus of HDPE/EP is ≈190% lower than that of neat epoxy and ≈5% lower than that of HDPE. As shown in Table 2, PP/EP blend and PP exhibited lower flexural strain at maximum load than HDPE/EP and HDPE, respectively. This is in agreement with higher stiffness of PP/EP than HDPE/EP shown in Figure 4. Therefore, with reference to component polymers of the blends, PP/EP blend performed better than HDPE/EP blend in terms of flexural modulus. This can be attributed to higher modulus of PP compared to HDPE coupled with the good interfacial adhesion in PP/EP and poor interfacial adhesion in HDPE/EP (Figure 3). Flexural modulus of neat blends and individual polymers. Flexural strain at maximum load of neat blends and individual polymers. EP: epoxy; PP: polypropylene; HDPE: high-density polyethylene.

Variation of flexural modulus of PP/EP/SG and HDPE/EP/SG composites with filler concentration is shown in Figure 5(a). For PP/EP/SG composites, flexural modulus initially decreased from 4.18 GPa at 30 wt% SG to 3.39 GPa at 40 wt% SG. Further increase in SG content caused a continuous increase in flexural modulus up to 11.47 GPa at 80 wt% G. For HDPE/EP/SG composites, flexural modulus increased from 1.66 GPa at 30 wt% SG to 8.86 GPa at 80 wt% SG. For both PP/EP/SG and HDPE/EP/SG composites, flexural strain at maximum flexural load decreased with increase in SG content (Figure 5(b)). Except at 40 wt% SG, HDPE/EP/SG composites exhibit higher strain than PP/EP/SG composites at the same SG loadings. Flexural properties of synthetic graphite (PP/EP/SG) and HDPE/EP/SG composites: (a) flexural modulus; (b) flexural strain at maximum flexural load.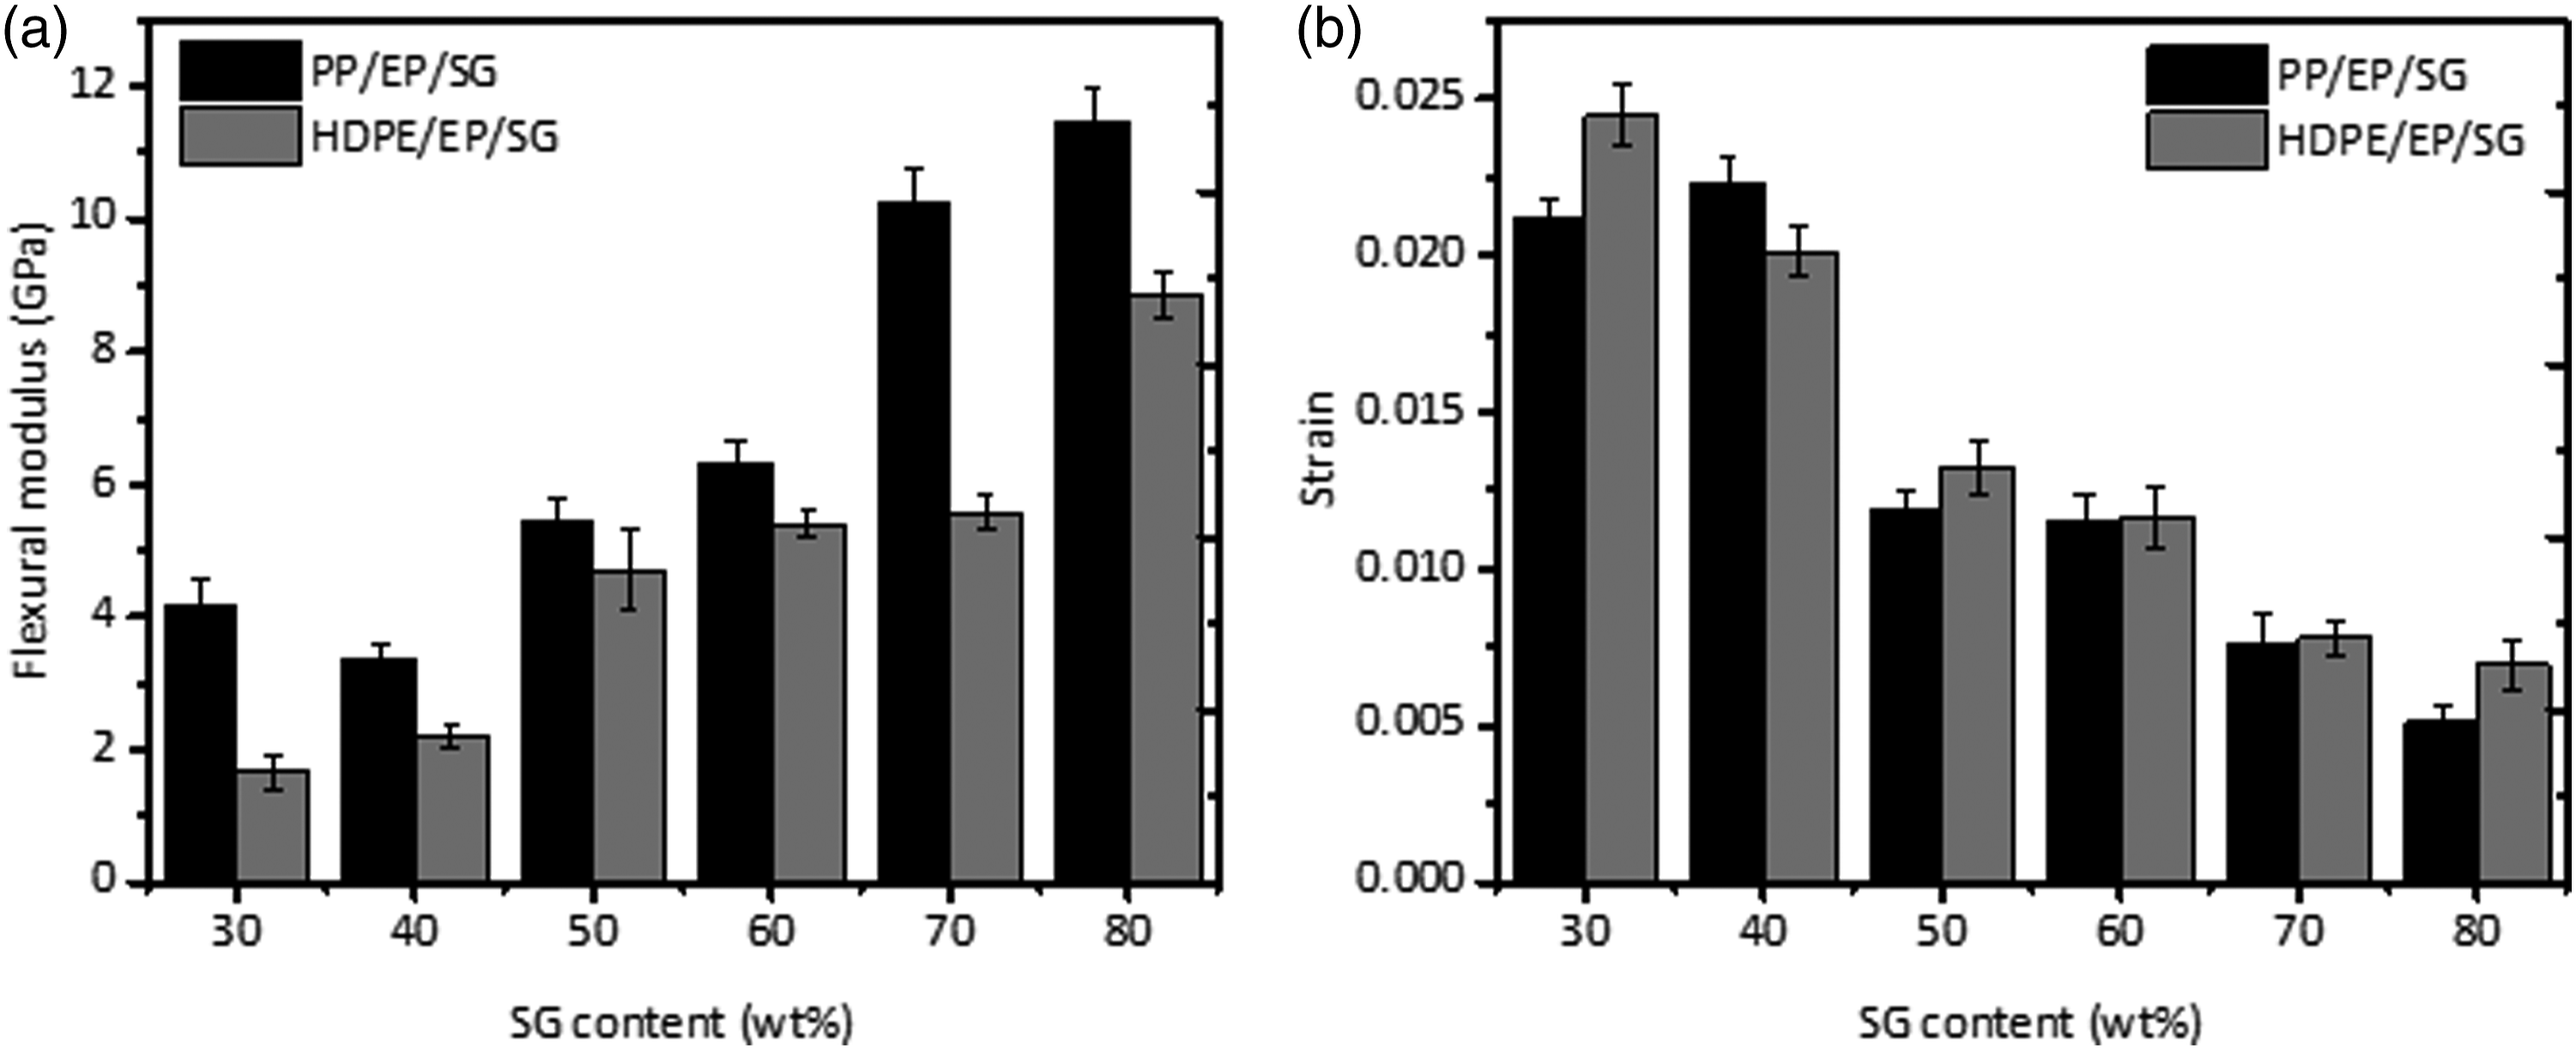
Increase in modulus of the PP/EP/SG and HDPE/EP/SG composites with SG content can be attributed to reinforcing effect of the platelet-structured SG. Addition of particulate fillers to polymers can lead to decreasing flexural modulus due to stress concentration caused by the filler particles. 35 However, for polymers filled with graphite consisting of layered particles, several studies have reported an increase in load-bearing capacity of the composites due to the reinforcing effect of the graphite platelets since they serve as barriers to crack growth.36–38 Therefore, it can be inferred that the reinforcing effect of graphite platelets was more than the weakening effect caused by stress concentration. The much higher stiffness of SG compared to the polymeric components of the composites, would lead to greater polymer chains immobilization at the matrix-filler interface and reduced deformability as the SG content increased. 39
As shown in Figure 5(a), PP/EP/SG composites exhibit higher flexural modulus than HDPE/EP/SG composites at the same SG content. This can be attributed to the higher flexural modulus of PP/EP blend as a result of higher modulus of PP compared to HDPE and inferior interfacial adhesion in HDPE/EP blend compared to PP/EP blend (Figure 3). The poorly bonded interfaces in HDPE/EP/SG composites act as vulnerable locations, which leads to ineffective stress transfer and reduced load-bearing capacity of the composites.
Effect of synthetic graphite content on density of composites
Variation of density of PP/EP/SG and HDPE/EP/SG composites with increase in SG content is shown in Figure 6. Bulk density of PP/EP/SG and HDPE/EP/SG composites increased from 1510 kg·m−3–1770 kg·m−3 to 1570 kg·m−3–1840 kg·m−3, respectively, as SG content increased from 30 to 80 wt%. SG is denser than polymer components in each of the composites. Therefore, as concentration of SG increased, density of the composites would increase. The goal in most applications of CPCs is to minimize density while maximizing the electrical conductivity. Since addition of most conductive fillers used to impart electrical conductivity tends to increase density of the composites, it is often necessary to determine the matrix-filler type and composition that give a good balance of electrical conductivity and density for the composites. Density of HDPE/EP/SG composites is higher than that of PP/EP/SG composites at the same SG loading. This can be attributed to higher density of HDPE (typically 930–970 kg·m−3)
40
compared to 900 kg·m−3 for PP. Bulk density of PP/EP/SG and HDPE/EP/SG composites with varying SG content.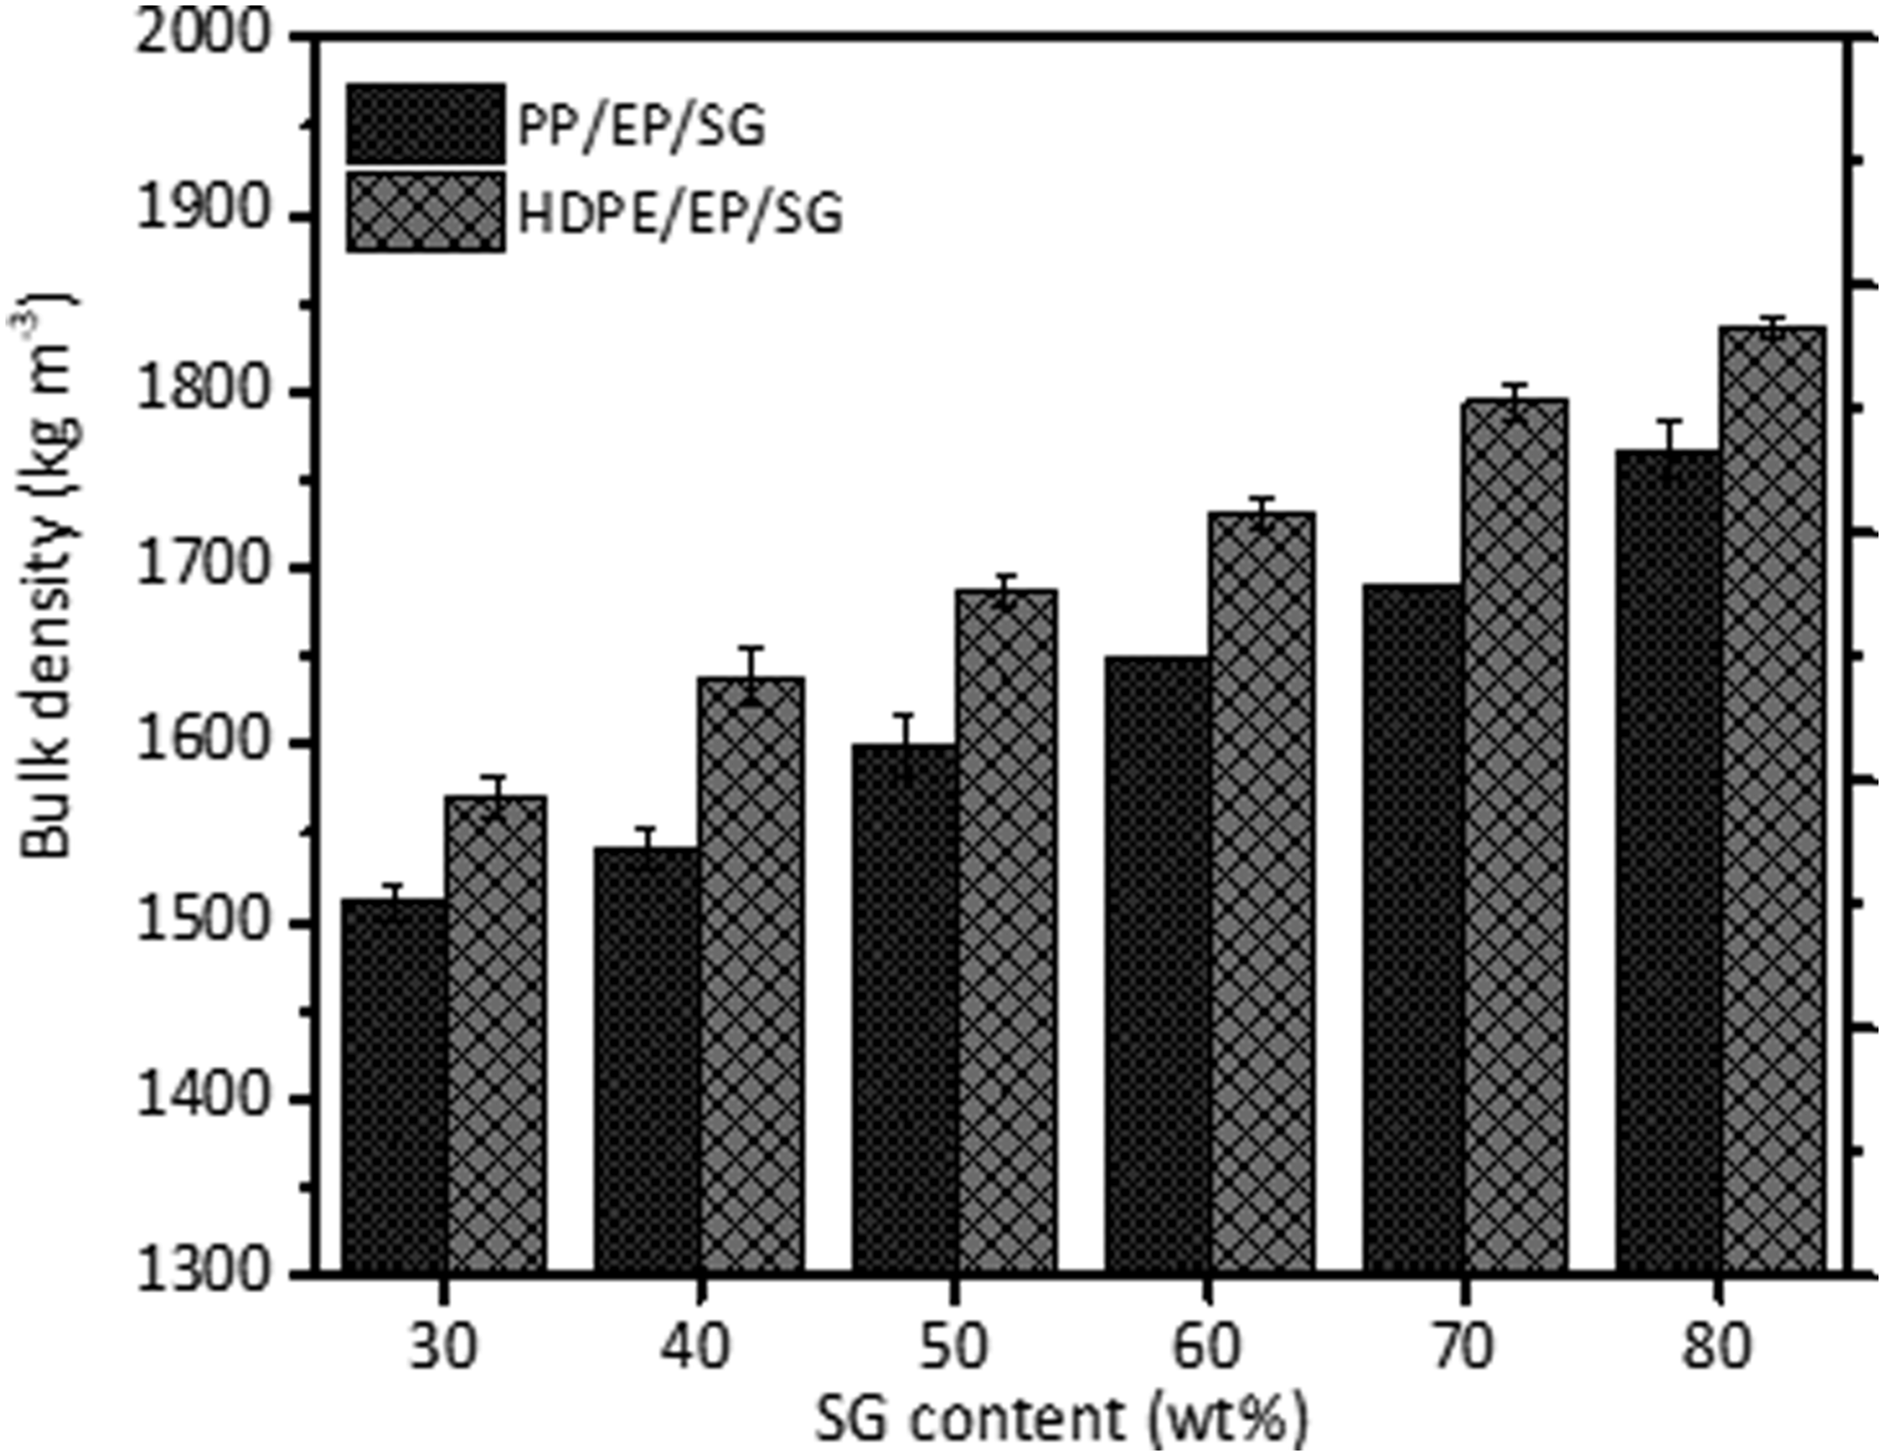
Variation of moldability of composites with filler concentration
As shown in Figure 7, the average thickness of PP/EP/SG and HDPE/EP/SG composites increased with increase in graphite concentration, at the fixed molding pressure and volume of “charge” (i.e., material loaded into the mold). Using equal volume of material for all the samples was necessary due to the constant cross-sectional area and volume of the mold. CPCs consist of polymer matrix and conductive filler with widely different flow properties under the processing conditions of typical compression molding process. At a fixed molding temperature and pressure, relative proportions of filler and matrix affect flow behavior of the composite material and final thickness of the molded part. Due to higher rigidity of SG filler, its addition to a polymer will cause a restriction of polymer chain mobility and a change in molecular dynamics.
41
As filler content increased, there would be increased rigidity and reduced fluidity of the sample during molding. Therefore, increase in average thickness of the composites with increase in graphite content can be attributed to increased difficulty in lateral squeezing out of composite samples during compression molding. Variation in thickness of compression-molded CPCs with increase in filler content has also been reported by Du et al.
42
for epoxy/expanded graphite composite molded at 10 MPa and by Lim et al.
43
for epoxy-carbon fiber prepregs embedded with graphite and CB and molded at 20 MPa. Variation of average thickness of PP/EP/SG and HDPE/EP/SG composites with SG content.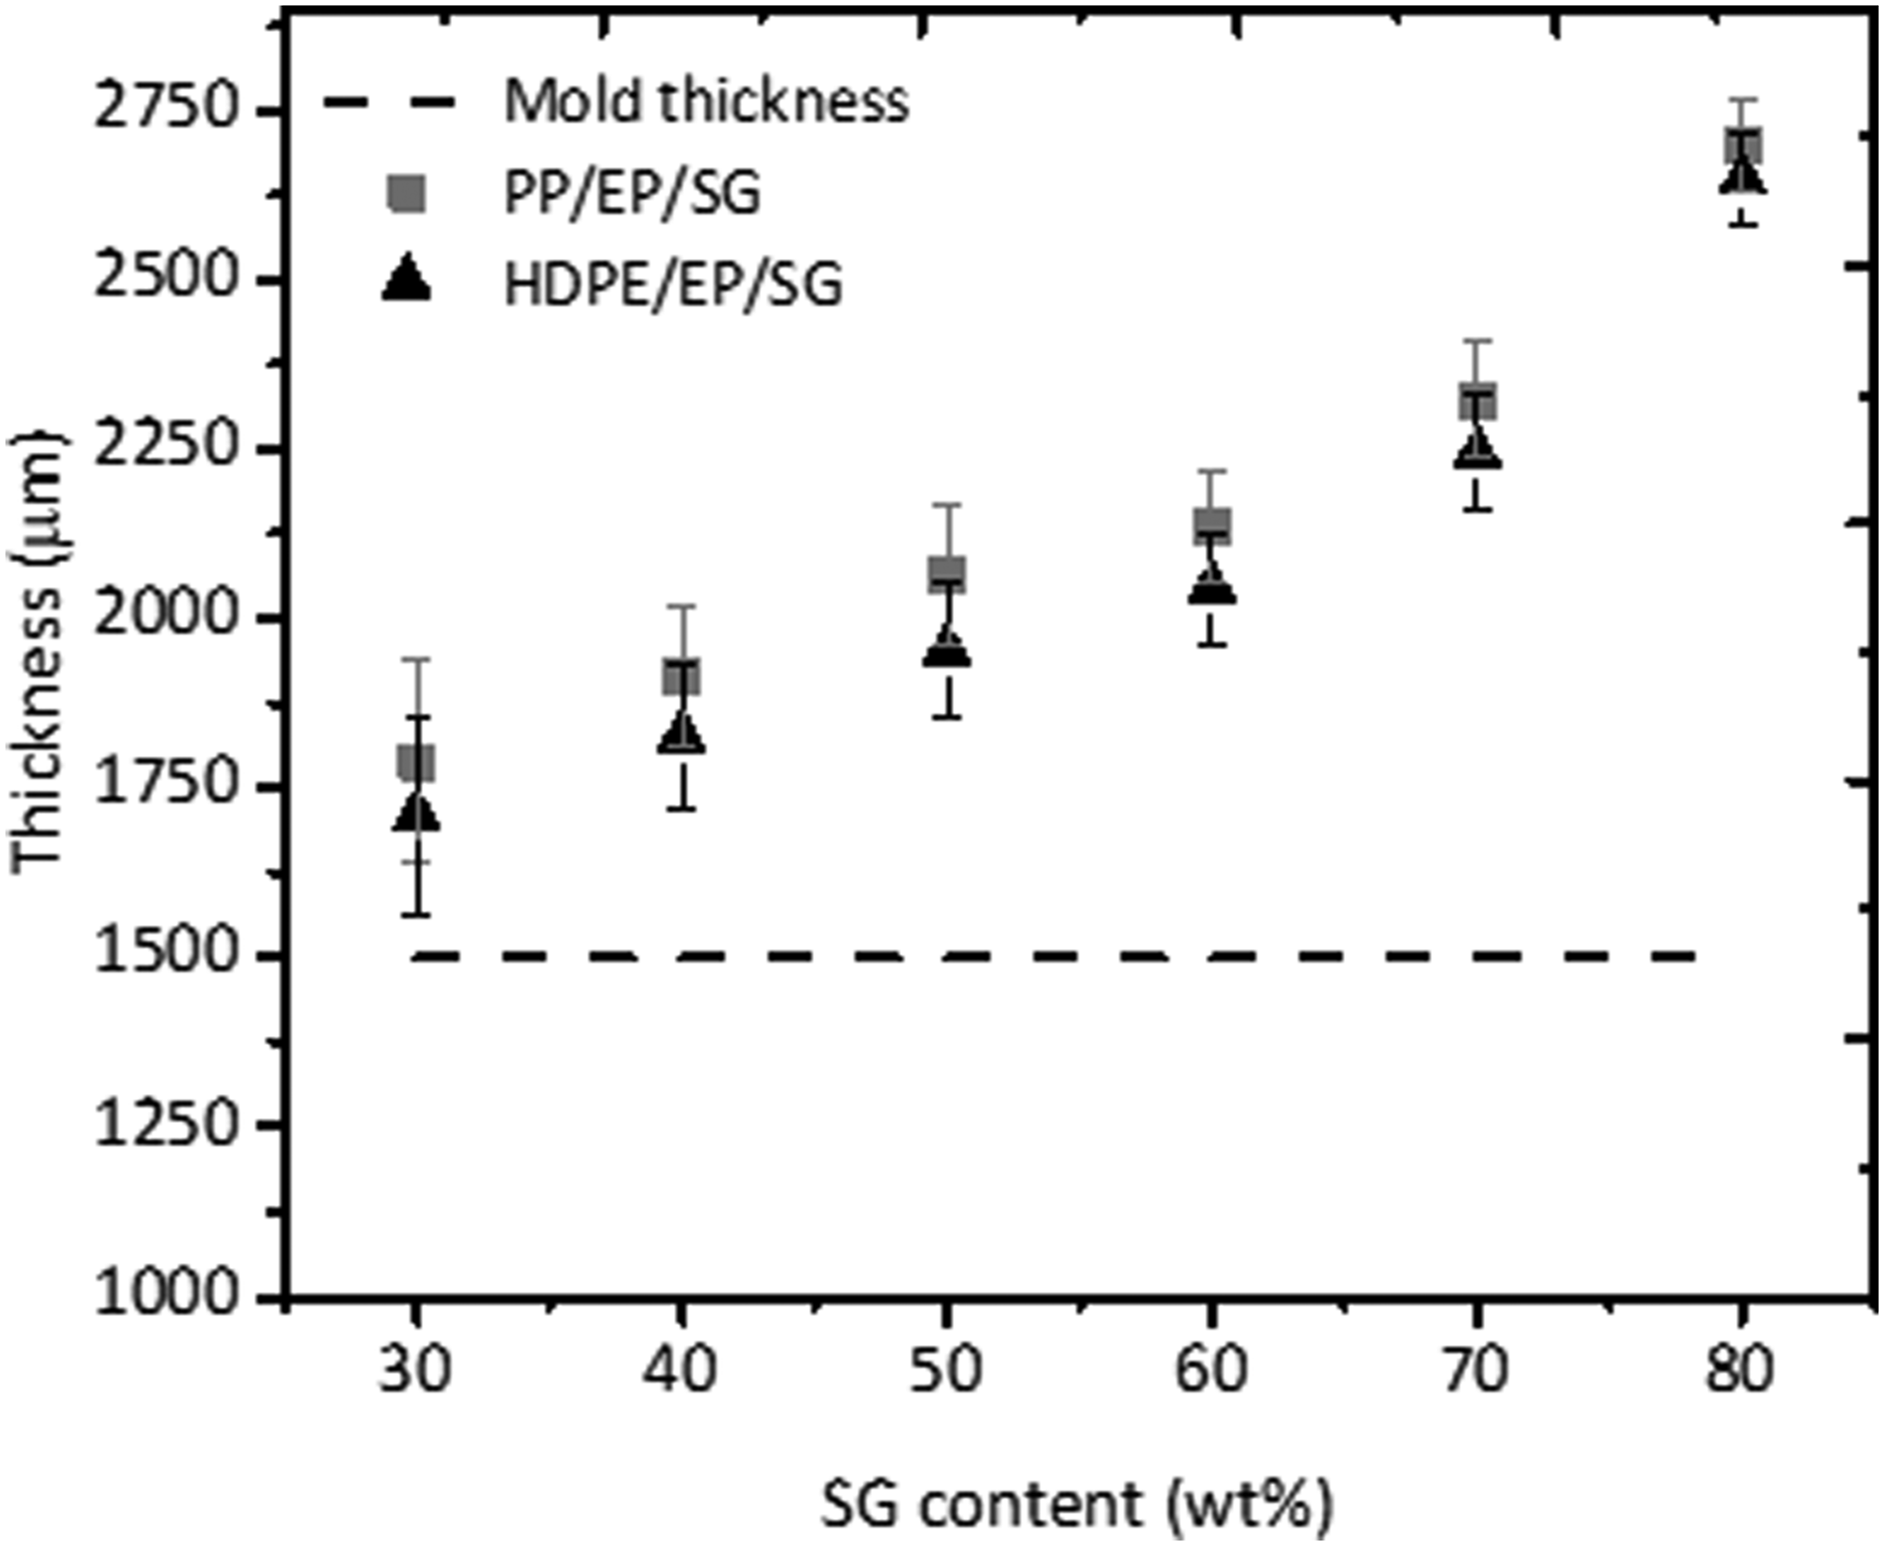
Accurate and precise forming of compression molded CPC parts depend on moldability of composite material, which in turn is affected by composition of the composite. Conformity of thickness of compression-molded samples to the desired thickness (i.e., mold thickness) could be used as an index for moldability as it can be related to ability of the material to be precisely formed to desired shape and dimension. Therefore, it can be inferred that the moldability of the PP/EP/SG and HDPE/EP/SG composites decreased with increase in filler content. As can be seen in Figure 7, though difference between the average thicknesses of PP/EP/SG and HDPE/EP/SG composites at the same SG loadings was marginal, yet it is consistently slightly higher for PP/EP/SG composites. This can be attributed to higher average molecular weight of PP,44,45 which would lead to higher molecular chains entanglements, lower molecular motion, and resistance to flow during compression molding compared to HDPE.
Effect of synthetic graphite content on water absorption of composites
Water absorption can have significant effects on performance of polymer composites as it is closely related to their electrical and mechanical properties.
22
Figure 8 shows the variation of water absorption of PP/EP/SG and HDPE/EP/SG composites with increase in SG content. For PP/EP/SG composites, the water absorption decreased from 0.154% at 30 wt% SG to 0.072% at 70 wt% SG. Further increase in SG content to 80 wt% caused an increase in water absorption. Water uptake in CPCs depends on temperature, nature and morphology of filler, filler volume fraction, interaction between matrix and water, and porosity.
46
The initial decrease in water absorption with increase in SG content can be attributed to hydrophobic nature and barrier effect of platelet structure of SG. As filler content increased, degree of wetting by the polymer resin would decrease, increasing porosity in the composites, with consequent increase in the water uptake at SG concentration beyond 70 wt%; porosity effect having more than offset effects of hydrophobicity and platelet structure of the SG. Water absorption of PP/EP/SG and HDPE/EP/SG composites with varying SG content.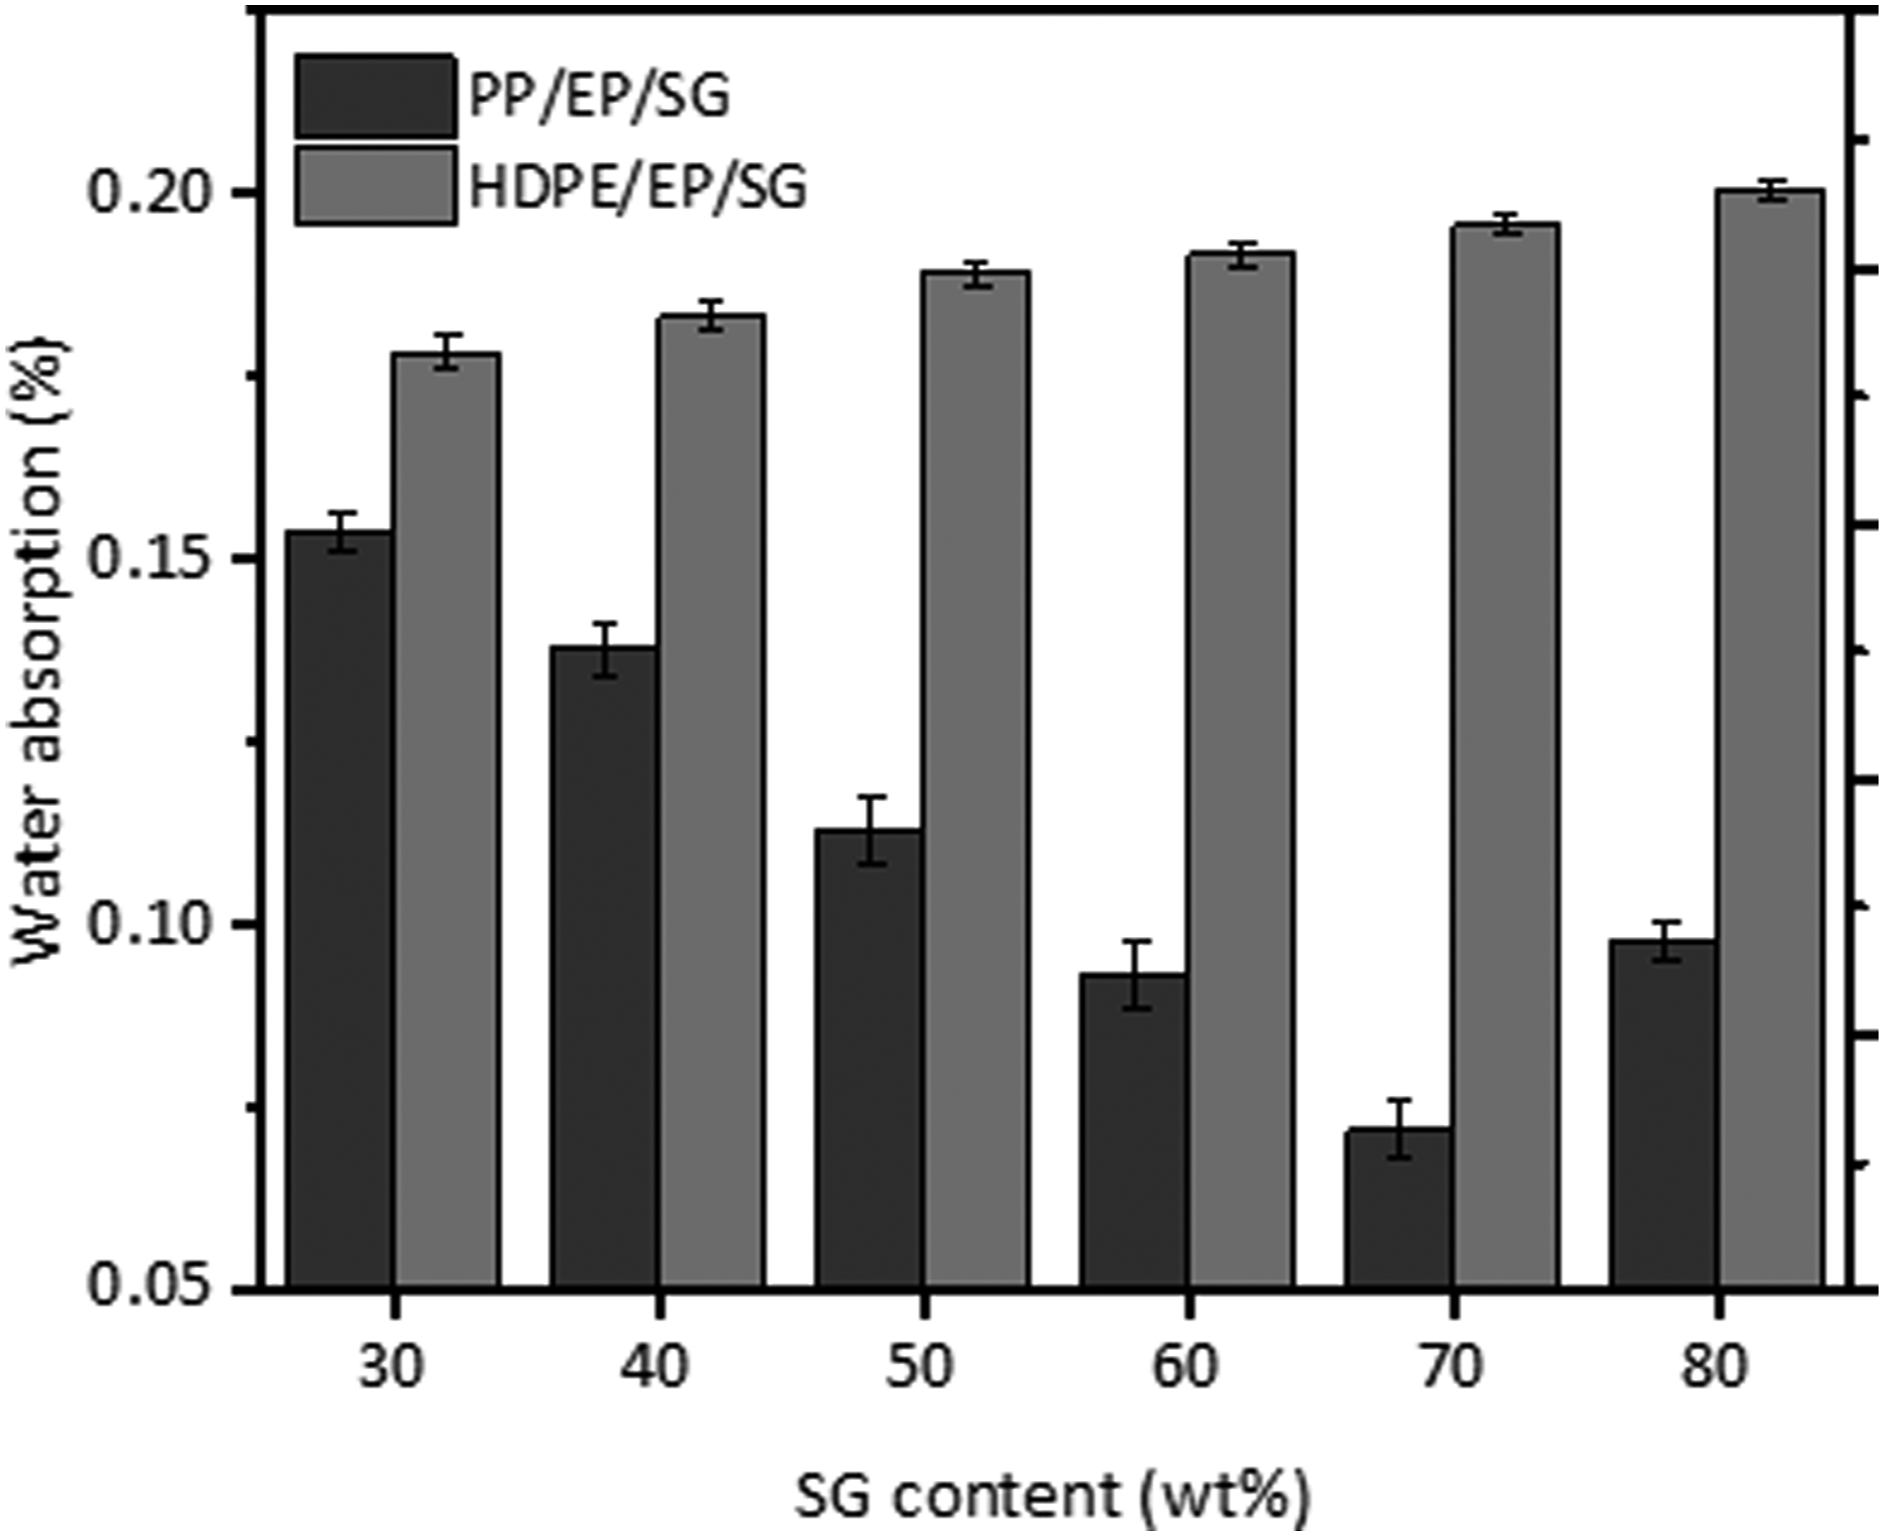
A different trend is observed for HDPE/EP/SG; water absorption increased with SG content all through. The difference in the behavior can be explained in terms of the poor interfacial adhesion in HDPE/EP blend relative to PP/EP blend. Some authors have attributed decrease in water absorption of polymer/graphite composites with increasing filler content to the tortuous pathways created for water diffusion as a result of the hydrophobic nature and barrier effect of platelet structure of graphite.38,47 However, other studies have reported increase in water uptake in graphite-filled polymers due to increased porosity.21,22 This implies that water absorption behavior of polymer/graphite composites cannot be generalized, and results of experimental analysis for specific filler-matrix systems give a more reliable information about water permeation. Therefore, to gain a better understanding of water absorption behavior of the PP/EP/SG and HDPE/EP/SG composites, effect of SG content on their porosity was studied.
As shown in Figure 9, porosity of both PP/EP/SG and HDPE/EP/SG composites increased with increase in SG concentration. This can be due to decreased degree of filler wetting by the polymer as a result of decreasing resin content, which results into formation of more closed porosity in the composites. Also, at the same SG content, HDPE/EP/SG composites exhibit higher porosity than PP/EP/SG composites. This can be related to the inferior interfacial adhesion in HDPE/EP compared to PP/EP matrix. The higher porosity of HDPE/EP/SG composites can result in the porosity effect being more significant than effects of hydrophobicity and platelet structure of graphite, leading to increasing water absorption with increase in SG content. Also, presence of poorly bonded interfacial regions in HDPE/EP would lead to presence of more micro gaps, higher porosity, and water absorption in HDPE/EP/SG composites than PP/EP/SG composites. Porosity of PP/EP/SG and HDPE/EP/SG composites with varying SG content.
Under similar conditions, HDPE/EP-based composites are therefore more prone to water uptake than PP/EP-based composites. Since minimizing water uptake is required in many applications of CPCs, it can be said that PP/EP/SG composite will be a better material than HDPE/EP/SG composite in terms of water absorption.
Conclusion
Effects of SG content on flexural properties, density, moldability, and water absorption of PP/EP/SG and HDPE/EP/SG composites were investigated. TGA results revealed two-stage degradation of the PP/EP and HDPE/EP blends, which confirms presence of two phases in the blends. SEM studies revealed no distinct interface between PP and epoxy in PP/EP blend, while the interface between the two component polymers in HDPE/EP blend is distinct, which indicates an inferior interfacial adhesion in HDPE/EP blend compared to PP/EP blend. Interfacial region morphologies of the two blends suggest that, at the same compatibilizer concentration, MAH-g-PE in HDPE/EP blend was less effective in preventing coalescence of epoxy and reducing interfacial tension between the blend components than MAH-g-PP in PP/EP blend. Three-point bending tests showed that PP/EP/SG composites exhibit higher flexural modulus than HDPE/EP/SG composites at the same SG content. This can be attributed to higher flexural modulus of PP/EP blend due to higher modulus of PP compared to HDPE and inferior interfacial adhesion in HDPE/EP blend compared to PP/EP blend. Also, at the same filler loadings, PP/EP/SG composites showed lower density, porosity, and water absorption than the HDPE/EP/SG composites.
Footnotes
Declaration of conflicting interests
The author(s) declared no potential conflicts of interest with respect to the research, authorship, and/or publication of this article.
Funding
The author(s) disclosed receipt of the following financial support for the research, authorship, and/or publication of this article: This study is supported by the National Research Foundation and Telkom Centre of Excellence of South Africa, and research funds of Metallurgical Engineering, Vaal University of Technology.