
Abstract
In this study, graphene nanosheets (GNSs)/poly(dimethylsiloxane) (PDMS) nanocomposites and the novel polyaniline (PANI)-functionalized graphene nanosheets (GNSs)/poly(dimethylsiloxane) (PDMS) nanocomposites were fabricated successfully. GNSs and PANI-functionalized GNSs were dispersed in PDMS matrix at different nanofiller concentration and nanocomposites were prepared via solution casting method. PANI functionalization were performed by in-situ polymerization of aniline in the presence of GNSs and was used in order to be dispersed homogenously and efficiently in the PDMS matrix. Besides graphene layers were also isolated to hinder aggregation in the polymeric matrix. The effect of PANI functionalization of GNSs and filler concentration on dielectric, electrical and mechanical properties of nanocomposite films were investigated. According to dielectric measurements, the dielectric constant of polymer nanocomposites highly dependant on frequency, so dielectric constant was characterized in a wide frequency range (1 Hz–10 MHz) at room temperature, in this study. The dielectric constant of PDMS nanocomposites containing 1.50% GNSs and 1.50% PANI-GNSs increased by 111 times and 24 times, at 1 Hz, compared to pure PDMS, respectively. Besides, electrical conductivity increased 6868 and 1474 times with the addition of GNSs and PANI-GNSs, respectively. Optimized GNSs/PDMS and PANI-functionalized GNSs/PDMS nanocomposites can be candidate for soft actuators to be used in artificial muscle applications, in the future.
Keywords
Introduction
Polymeric composite materials with high dielectric constant and good electrical properties find a wide range of application in artificial muscles, actuators, high-K gate dielectrics, flexible electronic applications, memory devices, super-capacitors and sensors, they are lightweight, cheap and easy to process.1–5 Although, pure polymeric materials are with a low dielectric constant (less than ∼ 10), the addition of various conductive fillers can improve this value. 6 In the past, different metal 7 and ceramic 8 particles, high dielectric organic materials9,10 and conductive polymers 10 have been used for this aim. An efficient filler should be compatible with the polymer matrix, dispersed uniformly and homogenously in the matrix, and should transfer load applied, thermal energy and electrons efficiently. 11
Graphite is a naturally abundant and cheap material. Since, compared to fabrication of other carboneous materials (like carbon nanotubes), graphene from graphite is relatively cheap and requires easy techniques like wet chemical method. Improved Hummer’s method is most widely used method for wet chemical synthesis of graphene oxide. 12 Graphene (reduced graphene oxide) could be easily produced via graphene oxide by chemical and thermal reduction methods.13,14 Graphene has high specific surface area with its intrinsic structure as one atom thick and two-dimensional (2D) single carbon layer. Graphene has also spectacular properties including a Young’s modulus of 1 TPa and strength of 130 GPa 15 ; high thermal conductivity (above 3,000 W mK−1) 16 ; electron mobility of 2.53 × 10⁻⁴ m2 V−1 s−1 17 ; at room temperature, complete impermeability to any gases. 9
As a result advances in graphene research and application have taken place very fast 18 by triggering the studies about applications of graphene derivatives/polymer composites.19–22 The use of graphene as nanofillers, even at low addition rates, can significantly reduce the electrical percolation threshold without changing the properties of polymer matrix, negatively, since graphene has high aspect and surface-to-volume ratios.5,23–25 The graphene nanofillers added to the polymeric matrix provide an increase in the dielectric constant up to the percolation threshold while the material still remains in the insulating form. Addition of graphene nanofiller over the percolation threshold increases conductivity of the polymer composite where the graphene form pathways in which the electricity is transmitted. 6 Since the uniform distribution of the nanofiller in the polymeric matrix is important for the high efficiency, several studies using various chemical or physical methods5,6,26–28 were conducted to functionalize the filler.
There are some studies investigating different methods and materials to obtain improved graphene-based poly(dimethyl siloxane) (PDMS) composites6,29–31 while in PDMS nanocomposites, generally, the filler/matrix interfacial interactions are very poor due to their incompatible functional groups. 29 In the literature, the functionalized graphene layers for nanocomposites were obtained by using 3,5-di(trifluoromethyl)-aniline,29–32 polystyrene (PS), 33 hexadecylamine (HDA), 34 polyaniline (PANI), 35 polyvinyl alcohol (PVA), 36 poly(methyl methacrylate) (PMMA), 37 aniline, 38 and dodecylamine 39 etc. While graphene derivatives have been used in the preparation of polymer composites with conductive or enhanced dielectric properties thanks to their unique electrical properties, some problems such as aggregation have occurred during the preparation of polymer nanocomposites due to its nano dimension.
Therefore, in this study, we have produced and optimized graphene by polyaniline (PANI) so that the aggregation of the graphene layers is minimized. Graphene oxide synthesis was carried out as first step of reduced graphene oxide production. Graphene oxide was chemically reduced in order to remove the oxidized groups on the surface of graphene nanosheets and reduced graphene oxide was obtained. The surface chemistry of the reduced graphene oxide obtained was characterized by FT-IR and Raman spectroscopy and it was determined that it was successfully reduced. Afterwards, the functionalization of the graphene with polyaniline conducting form was carried out. The functionalized and non-functionalized graphene and the PDMS polymer were blended to produce polymer nanocomposite films and properties of the produced films were characterized.
Materials and methods
Materials
PDMS (Sylgard 184) base and curing agent were purchased from Dow Corning Corporation. Graphite powder was purchased from Fisher Scientific, USA. Aniline monomer, ammonium per sulfate (AMPS), Hydrochloric acid (37 wt%), phosphoric acid (85 wt%), sulfuric acid (98 wt%), tetrahydrofuran (ACS grade) and other required solvents were obtained from Sigma-Aldrich and used without further purification. Graphene was produced via following procedure given below.
Fabrication
Graphene oxide and reduced graphene oxide production
Graphene oxide was produced by the improved Hummers method. 12 Firstly, a mixture of 133 ml sulfuric acid/phosphoric acid in 9:1 ratio by volume was prepared from concentrated acids. 1 g of graphite powder and 6 g of KMnO4 were added to the acid mixture. The reaction flask was adjusted to 50°C for 30 min after stirring and continued overnight. After termination of the reaction, the mixture was poured onto 150 ml of distilled water ice and 1 ml of hydrogen peroxide was added, followed by stirring for a further 30 min. The mixture was centrifuged at 9000 rpm for 30 min and then the yellow supernatant was removed with yellow-brown graphene oxide. The graphene oxide was washed 1x with ethanol once with concentrated HCl and separated by centrifugation in both steps. The resulting graphene oxide powder was washed with distilled water and the supernatant fraction was centrifuged until the pH reached 7. The cleaned graphene oxide was vacuum filtered and dried at 45°C. Then 1.78 ml of 55% hydrazine hydrate was added to 100 ml of distilled water and 100 mg of graphene oxide powder was dispersed in this solution. The reaction was continued at 90°C for 12 h. The reduced graphene oxide powder was filtered under vacuum, washed five times with purified water and dried under 45°C after the final filtration.
Functionalization of graphene oxide with polyaniline
Functionalization of graphene oxide with polyaniline was made according to. 38 Aniline and graphene oxide were weighed in 2:1 ratio by mass. The weighed aniline and graphene oxide were dispersed in 320 ml and 1 M HCl solution. Ammonium persulfate was prepared by weighing in relation to aniline at a molar ratio of 1:8 and dissolved in 80 mL of 1 M HCl solution. Prepared ammonium persulfate solution was added dropwise to the aniline/graphene oxide dispersion. The polymerization was continued for 12 h and at 0°C. The emerald green polyaniline/graphene oxide powder (PANI/GO) was filtered under vacuum and washed five times with pure water and dried under 45°C after the final filtration. PANI/GO powder was reduced with hydrazine hydrate. 1.78 ml of 55% hydrazine hydrate was added to 100 ml of distilled water and 100 mg PANI/GO powder was dispersed in this solution. After reduction, the emerald green color of the nanoparticles turned dark blue. This color change is due to the fact that polyaniline in the hydrazine forms into the de-doped form. PANI/reduced GO (PANI/rGO) was filtered off and dispersed in 400 ml of 1 M HCl and stirred for 12 h. After this procedure, the color observed turned to green again. PANI/rGO was subjected to standard filtration, washing and drying processes.
Fabrication of PANI-functionalized GNSs/PDMS nanocomposites
Dow Corning® Sylgard® 184 Silicone Elastomer Kit, a two-part silicone, was used as the polymer matrix in this study. GNSs suspension in THF was sonicated with probe sonicator then PDMS base and curing agent were added and stirred. PANI-functionalized GNSs/PDMS nanocomposite films were prepared using the solution casting method. In the preparation of nanocomposites, concentrations of 0.25%, 0.75%, 1.00%, and 1.50% were used. This concentration range has been determined based on our previous experience and literature. 40 Preparation of GNSs/PDMS and PANI-functionalized GNSs/PDMS nanocomposites were presented in Figure 1.

Preparation of GNSs/PDMS and PANI-functionalized GNSs/PDMS nanocomposites.
Characterization
There are several important factors that determine the dielectric properties of polymer nanocomposites, the type of the polymer matrix, the characteristic of the nanoparticle (aspect ratio, surface/volume ratio, electrical conductivity), manufacturing method and the degree of distribution of nanoparticles in the polymer matrix.39,41–45
When using electrically conductive nanofillers for polymer nanocomposites, dielectric constant can be estimated using the effective dielectric constant (1), assuming that the conductive filler concentration is f:

where ∊m is the dielectric constant of the insulation polymer matrix; q is a critical exponent (∼1 for a three-dimensional compound) and fc is the electrical percolation threshold.7,46,47
With this equation, when the concentration of the conductive fillers approaches the percolation threshold, a significant increase in the dielectric constant can be achieved. When the conductive filler concentration is near the leakage threshold, a large amount of conductive GNSs are isolated by very thin layers of isolated polymer and thus forms a network of nano/micro-capacitors in nanocomposites; this network significantly increases the dielectric constant of nanocomposites. 47 In addition, the Maxwell-Wagner-Sillars (MWS) polarization effect, i.e. the compression of free circulation in the interface of the insulation polymer and the conductive filler, also plays an important role in increasing the dielectric constant.4,48,49 However, the MWS polarization effect often contributes to the increase of the dielectric constant in the low frequency range. 50 MWS polarization effect increases with increasing nanofiller concentration and this leads to the improvement of permittivity. 51 Dielectric characterization was performed with impedance analyzer (Novocontrol Technologies, Alpha-AN) in the frequency range of 1 Hz–10 MHz at room temperature.
The surface morphology was investigated via a field emission scanning electron microscope (FE-SEM) (LEO GEMINI 1530, Carl Zeiss) at 10 kV and 7.4 mm working distance. The samples were coated with thin gold/platinum alloy film using a sputter coater (Leica / ACE600) to prevent the accumulation of charge on their surface.
Chemical structure of graphene oxide was characterized in the range of 4000–400 cm−1 with a 4 cm−1 spectral resolution on a Thermo scientific Nicolet i550 model FTIR spectrometer with Smart Orbit-Diamond model ATR on transmittance mode and Thermo Scientific DXR Raman Microscope at a 532 nm laser excitation level at room temperature.
Results and discussion
FT-IR analyze
FT-IR analyze was used to approve both graphene oxide formation and graphene oxide reduction in the process. Figure 2 shows the FT-IR spectra of graphite, graphene oxide and GNSs. As seen in Figure 2, there were no functional groups on the graphite surface, so no peaks were observed. FT-IR spectrum of graphene oxide showed the oxidation of graphite at 3200 (–OH) and 1728 (–C=O) cm−1 peaks. 13 These results clearly showed that the graphite was successfully oxidized to obtain graphene oxide. It was observed that the functional groups were removed after reduction. This shows that the reduction has been carried out successfully.

FT-IR spectrum of graphite, graphene oxide and GNSs (reduced graphene oxide).
Raman analyze
Raman analyze was also used to approve both graphene oxide formation and graphene oxide reduction in the process. Figure 3 shows the Raman spectrum of graphite, graphene oxide and GNSs. The in-phase vibration of the graphite lattice at 1575 cm−1 (band G) and the (weak) band of disorder caused by graphite edges (D-band) at about 1347 cm−1 were observed.39,41 The Raman spectrum of graphene oxide showed a larger and wider D-band due to a wide oxidation (1345 cm−1) and a higher frequency shift in the G-band (1583 cm−1). 52 The oxidation process increased the number of oxygenated functional groups resulting in the passage of the sp 2 carbon hybrid to a sp 3 carbon hybrid and increased the number of defects. 53 The chemical reduction of graphene oxide nanosheets resulted in a reduction in peak density for both D and G bands.52–54 Thus, both FTIR and Raman data confirmed the successful synthesis of graphene oxide and graphene (reduced graphene oxide).

Raman spectrum of graphite, graphene oxide and graphene (reduced graphene oxide).
SEM results
The morphology of graphene and PANI-functionalized graphene in PDMS nanocomposites were shown in Figure 4. The amount and distribution of nanofillers in the PDMS directly affects the effectiveness of nanocomposites in developing various material properties. 40 In the production of polymer nanocomposites, it is very important to distribute the nanomaterials homogeneously in the polymer matrix, since nanomaterials tend to clump together and agglomerate. Above the critical concentration, conductive nanofillers agglomerate and the enhancement of properties such as electrical conductivity and dielectric constant ceases. The filler concentration in which values such as electrical conductivity and dielectric constant increase dramatically is called the percolation threshold.55,56 Very low percolation threshold values as 0.1 vol.% can be reached with nanofillers with a large surface area such as graphene 57 In light of this information, the nanofiller concentrations are kept in the range between 0.25 wt.% and 1.5 wt% in the studies. In our case, PANI was physically bonded to graphene and thus the graphene nanosheets were isolated from each other. 38 In addition, the isolation by PANI has provided a solution to the agglomeration problem of graphene nanosheets. Therefore, as seen in the Figure 4, the nanofiller material was distributed in a partially uniform manner and the particle size diameter is greater than 2 µm. SEM images also revealed that the particle size of PANI-functionalized graphene was greater than that of graphene particles (Figure 4). That is, according to the SEM images, the particle size of the PANI-functionalized graphene flakes directly affected the surface area of the filler-matrix interface and thus the dielectric properties of the nanocomposite.

SEM images of (a) graphene/PDMS nanocomposite and (b) PANI-functionalized graphene/PDMS nanocomposite.
Dielectric and electrical results
Dielectric and electrical properties of graphene/PDMS nanocomposites
In Figure 5(a), the dielectric constant of the graphene/PDMS nanocomposite changes depending on the frequency. The MWS effect shows a higher dielectric constant at low frequency. 50 It is seen that the 1.50% graphene additive increase the dielectric constant by 110 times at a frequency of 1 Hz. Figure 5(b) shows the change in dielectric constant of 100 Hz of graphene/PDMS nanocomposites. While the dielectric constant showed a slight increase up to the addition of 1.00% nanofiller, there was a sudden increase in the addition of 1.50% nanofiller. Figure 5(c) illustrates the change in Tan δ (dielectric loss) values depending on the frequency. As seen in this graph, the increase in concentration causes an increase in Tan δ values, although there is no demand.

(a) Dielectric constant of non-functionalized graphene/PDMS nanocomposites depending on frequency, (b) dielectric constant of non-functionalized graphene/PDMS nanocomposites depending on concentration at 100 Hz, (c) dielectric loss (Tan δ) of non-functionalized graphene/PDMS nanocomposites depending on frequency.
On the other hand, the addition of graphene also affects the electrical conductivity. There is also an increase in electrical conductivity by increasing graphene concentration as described in reference. 55 The conductivity of polymer nanocomposites is affected by the physical, chemical and electrical properties of the added nanomaterial. In particular, besides many parameters such as the size of the nanomaterial, its conductivity and the quality of its dispersion in the polymer, it is also affected by the nanomaterial-matrix interface properties. Because, the interface phase affects the electrical conductivity of nanocomposites due to its effect of lowering the percolation threshold. 58 The concentration at which the electrical conductivity increases by several orders of magnitude is called the percolation threshold. The increase in electrical conductivity of polymer nanocomposites is explained by percolation theory.59–62 In addition, the nanofillers do not need to be physically contacted in order to increase the electrical properties in the real scenario. Thanks to the tunneling effect, the charge carriers help to carry the electron from one conductive filler to another. 58 In our case, one of the key mechanisms for electrical conductivity is the transport of charge between the graphene plates by the tunneling effect. In this case, the distance between graphene plates is important.58,59,63 and should be investigated more in future studies. Figure 6(a) shows the effect of graphene concentration on electrical conductivity depending on the frequency. In Figure 6(b), the effect of nanofiller concentration on electrical conductivity was seen at 100 Hz. Nanofiller showed a near-linear increase in electrical conductivity due to increased concentration. Increasing graphene concentration was able to form conductive pathways and the pathway formation was maintained by higher graphene concentrations. As can be seen, the threshold concentration required for electrical conductivity was reached around 0.25 wt.%. While PDMS film with 1.0 mm thickness had 2.383 × 10⁻¹¹ S/m electrical conductivity at 100 Hz, PDMS films with 1.50% GNSs added were found to have 1.63671 × 10⁻⁷ S/m electrical conductivity at 100 Hz.

Electrical conductivity of non-functionalized GNSs/PDMS nanocomposites (a) depending on frequency,
Dielectric and electrical properties of PANI-graphene/PDMS nanocomposites
In addition, the surface of the graphene nanoplates was used to enhance the properties of PDMS by functionalizing with polyaniline, a conductive polymer. While calculating the extra nanofiller material, the amount of PANI is included in the calculation. In this case, the GNS content of GNSs/PDMS nanocomposites and PANI-GNSs/PDMS nanocomposites are not the same in order to keep the amount of conductive additives in the polymer nanocomposite equal. This should be taken into account when comparing prepared nanocomposites. Figure 7(a) shows the variation of the dielectric constant of the PANI-GNSs/PDMS nanocomposite depending on the frequency. Here, the curves of all GNSs/ PDMS nanocomposites prepared with different conductive nanomaterial concentrations look similar. The higher frequency of dielectric constant decreases due to the effect of MWS while showing higher dielectric constant value at low frequency. 64 In Figure 7(b), the effect of PANI-GNSs concentration on dielectric constant at 100 Hz is observed. In the addition of 0.25% nanofiller added approximately 3.5 times, there was a small increase in the addition of 0.75% and 1.00% nanofiller, while a 1.00% increase in the addition of 1.00% nanofiller. Figure 7(c) shows the change in the Tan δ values of PANI-GNSs/PDMS nanocomposites according to the frequency. As seen in the graph, the PDMS shows a linear loss value of approximately 0.002, virtually independent of the frequency of the film. In the addition of nanofiller, with the addition of filler, the value of Tan δ increases and increases at different frequency values.

The dielectric constant of the functionalized PANI-GNSs/PDMS nanocomposites (a) depending on the frequency, (b) depending on concentration at 100 Hz, (c) dielectric loss (Tan δ) of PANI-functionalized graphene/PDMS nanocomposites depending on frequency.
Dielectric enhancement with PANI-GNSs addition was investigated in similar studies.65,66 In Feng’s work, 65 dielectric constant values could not reached dielectric constant of 1.50% PANI-GNSs/PDMS even with 20 times higher filler concentration. In another work 66 dielectric loss value was two times higher than PANI-GNSs/PDMS composite at 1.00% filler concentration. In Figure 8(a), the electrical conductivity of PANI-graphene/PDMS nanocomposites with frequency, Figure 8(b) shows the change in the concentration of electrical conductivity at 100 Hz. The electrical conductivity of the PDMS film was 2.383 × 10⁻¹¹ S/m at 100 Hz. The conductivity of PANI-GNSs/PDMS composites increased with the filler concentration due to increasing conductive pathway formation. Polyaniline allowed graphene to prevent re-stacking and aggregation 38 Although polyaniline is a conductive polymer, its electrical conductivity is very low compared to graphene. However, it still contributes to dielectric and electrical properties. For this reason, while calculating the filler percentages, the total mass of polyaniline and graphene was expressed as the additive amount in samples containing PANI-functionalized graphene. However, the amount of graphene it contains is much less. For this reason, the amount of graphene in samples with the same percentage graphene added and PANI-functionalized graphene added is not the same. This was approved by experimentally by showing the difference between electrical conductivity results of GNSs/PDMS and PANI-GNSs/PDMS given in Figures 6 and 8, respectively.

Electrical conductivity of functionalized PANI-GNSs/PDMS nanocomposites (a) depending on frequency, (b) depending on concentration at 100 Hz.
Mechanical analysis of graphene/PDMS and PANI-graphene/PDMS nanocomposites
The mechanical tests were performed according to ASTM D882-12 test standard. Stress-strain curves and Young’s modulus were shown in Figures 9 and 10, respectively.
Graphene / PDMS nanocomposites showed a decrease in tension and an increase in maximum elongation with increasing filler concentration. Additionally, Young’s modulus reduced correlatively with filler concentration. In PANI-GNSs filled PDMS nanocomposites, PANI-Graphene reinforcement have caused a dramatic reduction in stress values. Based on these results, it can be said that the mechanical properties of GNSs and PANI-GNSs filled PDMS nanocomposites should be improved for advanced applications such as artificial muscles or flexible wearable electronics that require better mechanical properties.
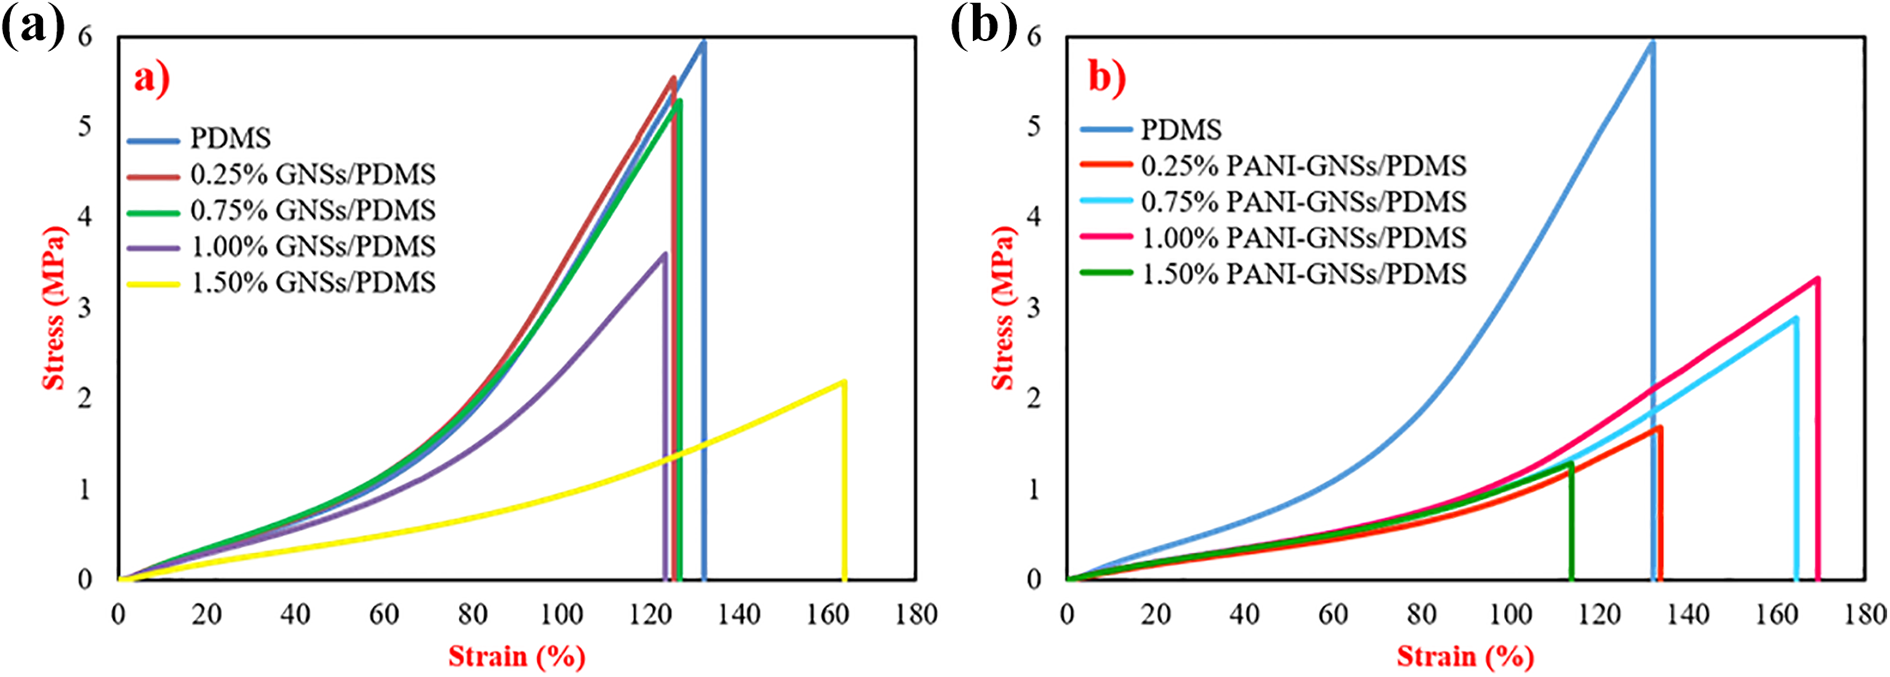
Stress-strain curves of (a) GNSs/PDMS nanocomposites and (b) PANI-GNSs/PDMS nanocomposites

Young’s modulus graphs of (a) GNSs/PDMS nanocomposites and (b) PANI-GNSs/PDMS nanocomposites
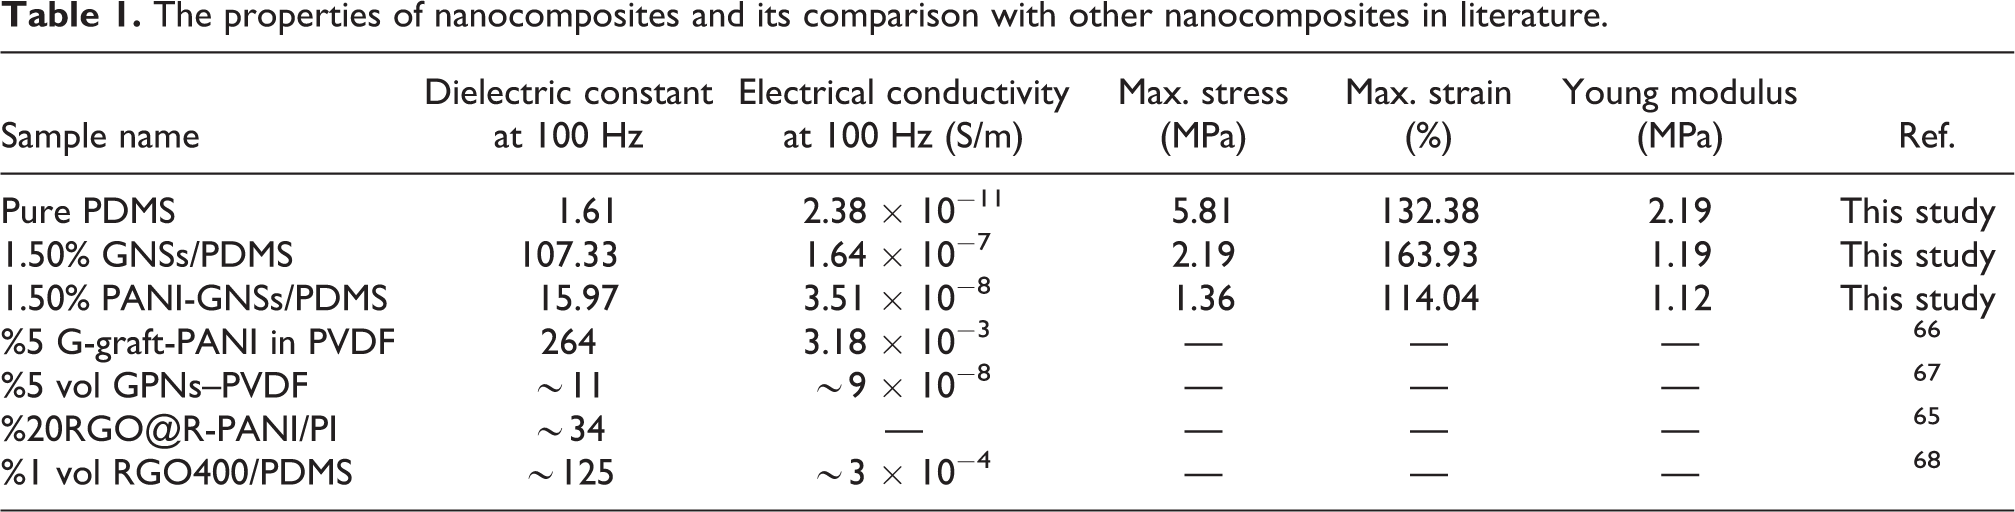
Table 1 also summarizes the properties of GNSs and PANI-GNSs-reinforced PDMS nanocomposites produced in this study and in other studies. As can be seen, it can be said that the properties of the nanocomposites we obtained are comparable with the materials in other studies in the literature.
The properties of nanocomposites and its comparison with other nanocomposites in literature.
Conclusion
GNSs/PDMS, PANI-functionalized GNSs/PDMS nanocomposites have been successfully synthesized by the solution casting method. 61 Morphological, chemical, dielectric and electrical properties of the obtained nanocomposites were investigated. As a result of adding GNSs and PANI-functionalized GNSs into PDMS, significant increases in dielectric constant, dielectric loss and conductivity were achieved. A great difference was observed between the dielectric properties of nanocomposites containing the PANI-functionalized GNSs and only GNSs. For example, while the dielectric constant of PDMS nanocomposites containing 1.50% graphene is 107 at 100 Hz, the dielectric constant of PDMS nanocomposites containing PANI-GNSs is approximately 16 at 100 Hz. The reason for this difference is that although PANI is a conductive material, its conductivity value is much lower compared to graphene, which has affected the dielectric constant value. Compared to pure PDMS, the dielectric constant of PDMS increased by 111 times at 100 Hz with only 1.50% graphene addition and 24 times with 1.50% PANI-graphene addition. On the other hand, electrical conductivity increased 6868 and 1474 times with the addition of GNSs and PANI-GNSs, respectively. These nanocomposite materials with improved dielectric and electrical properties can be an important candidate for capacitor, flexible electronics, dielectric elastomer, and artificial muscle applications.
Footnotes
Declaration of conflicting interests
The author(s) declared no potential conflicts of interest with respect to the research, authorship, and/or publication of this article.
Funding
The author(s) disclosed receipt of the following financial support for the research, authorship, and/or publication of this article: This study was supported by Bursa Technical University Scientific Research Project (BAP) No: 2015-01-008.