
Abstract
Herein, we are reporting the synthesis and characterization of polythiophene (PTh) and its novel nanocomposites with zinc tungstate (ZT) and graphene/zinc tungstate (G/ZT) hybrid for Direct current (DC) electrical conductivity based cigarette smoke sensing at room temperature. X-ray diffraction, Fourier-transform infrared, Raman, scanning electron microscopy, transmission electron microscopy, ultraviolet–visible spectroscopy and thermogravimetric analysis techniques were used for the characterization of the as-prepared materials. The results showed that the DC electrical conductivity and sensing performance of PTh significantly improved by incorporation of ZT and G/ZT into it. PTh/G/ZT-3 (i.e. PTh/G/ZT nanocomposite containing 15 wt% G/ZT) was found to be the best sensor in terms of sensing response (81.5%) and reversibility (90.55%) along with the most stable semiconductor under isothermal and cyclic ageing conditions. Sensing response of PTh/G/ZT-3 was also tested in the exposure to various components of cigarette smoke (namely ammonia, carbon dioxide, ethanol, formaldehyde, acetone, benzene, toluene, phenol) and the highest sensing response was observed in the exposure to ammonia. The significant increase in conductivity of PTh/G/ZT nanocomposites was explained by the transfer of polarons from PTh to graphene, that is, creation of a hole in graphene where they achieved rapid mobility along with the extended π-conjugated system. Finally, a sensing mechanism was proposed through adsorption–desorption of cigarette smoke on the surface of PTh/G/ZT where electronic interactions between polarons of PTh and various components of cigarette smoke (mainly ammonia and ethanol) affected the change in DC electrical conductivity.
Introduction
Even today, it is an exciting challenge for the researcher to fabricate the highly sensitive, selective and recoverable chemical/gas/vapour sensors working at room temperature. On the way to achieve better sensing performances, the primary demands are the synthesis of the materials which have a very high surface area and excellent stability of electrical conductivity. 1 -6 It is a familiar fact that cigarette smoke is very hazardous for human health because it causes cancer, lung diseases and heart diseases. When cigarette burns, nearly 4000 chemical components are produced. The majority of them are tar, oxides of carbon that is, CO2 and CO, oxides of nitrogen, ammonia, chlorinated dioxins, hydrogen cyanide, furan, polycyclic aromatic hydrocarbons and so on. 7 The major challenge in the sensing of cigarette smoke is to identify which constituent is accountable for the variation in electrical conductivity during sensing. To overcome this issue, we carried out several experiments to check the conductivity response in the presence of different constituents of cigarette smoke such as ammonia, carbon dioxide, ethanol, formaldehyde, acetone, benzene, toluene and phenol.
Conducting polymers (CPs)-based nanomaterials are one of the most competent in the field of chemical/gas/vapour sensors at room temperature. 1,7 -12 The nanocomposites of these CPs have been prepared by encapsulation or mixing of inorganic nanoparticles within their matrix. 8,9,11 There are several CPs, for instance polypyrrole, polythiophene (PTh) and polyaniline (Pani) and their nanocomposites, which have become the topic of massive interest in devising chemical/gas/vapour sensors, 1,13 -16 energy devices, 17,18 electronic and optical devices. 19 -24 Recently among the various CPs, PTh and its nanocomposites have generated significant attention in the field of chemical/gas/vapour sensor because of their different doping and de-doping mechanism on exposure to various chemicals/gases leading to variation in their electrical conductivity/resistance. 25 -30 Recently, a large number of researchers have reported the chemical/gas/vapour sensors based on nanocomposites of PTh with different inorganic nanoparticles such as graphene, 25 ZrO2, 26 Al2O3, 28 WO3 29 and SnO2. 30
Zinc tungstate (ZT) (ZnWO4), owing to its excellent and unique physical and chemical properties have fascinated the researchers having the extraordinary application prospective in numerous areas such as electronic and optical characteristics, 31 photoluminescence, 32 photovoltaic, 33 gas/vapour sensor, 34,35 photocatalysis 36 and lithium-ion batteries. 37 Graphene, one of the fascinating materials, also termed as the wonder material, has attracted considerable attention attributable to its extraordinary properties, for instance, high surface area and greater carrier mobility. 38,39 The product obtained by the combination of ZT with graphene exhibits significantly enhanced features as compared to pristine ZT. 37 -40
Herein, we have utilized the properties of the PTh, ZT as well as graphene (G) and synthesized ZT nanoparticles; further, they were decorated on graphene nanosheets to prepare G/ZT hybrid. PTh and its nanocomposites were synthesized with the incorporation of 5%, 10% and 15% (by weight) of G/ZT as well as with ZT through the in situ chemical oxidative mode of polymerization using CHCl3 as a solvent while anhydrous FeCl3 acts as an oxidant. In our best knowledge, we have not found any report based on the nanocomposite of PTh with G/ZT and ZT. In our best understanding, this is the first attempt to synthesize and characterize PTh/G/ZT and PTh/ZT nanocomposites along with their DC electrical conductivity based cigarette smoke sensing studies.
Experimental
Materials
Thiophene (Sigma-Aldrich, Aligarh, India), acetone, chloroform, methanol and anhydrous ferric chloride (Fisher Scientific, Aligarh, India), ZT (ZnWO4) and G/ZT were prepared by a method in the existing pieces of literature and symbolized as ZT and G/ZT, respectively. 40
Preparation of PTh, PTh/ZT, and PTh/G/ZT nanocomposites
Herein, we employed the cost-effective and straightforward in situ chemical oxidative mode of polymerization to prepare the PTh, PTh/ZT and PTh/G/ZT nanocomposites having the varying mass percentage of ZT and G/ZT. In this scheme, chloroform and anhydrous FeCl3 were utilized as a solvent and oxidant, respectively. Two millilitres (25 mmol) of thiophene monomers were transferred into a beaker containing 100 mL chloroform and then ultrasonicated for 60 min. Subsequently, the required amount of G/ZT was transferred into the above monomer (thiophene) solution followed by further ultrasonication for 90 min. In the course of the sonication, the molecules of the thiophene monomers get adsorbed on the large surface area of G/ZT. Then 8.12 g (50.04 mmol) of anhydrous ferric chloride was dissolved into 200 mL chloroform and then subjected to stirring for 20 min to produce a homogeneous suspension. The above suspension was then transferred into the monomer and G/ZT mixture drop by drop with the continuous stirring condition for 24 h. The resulting PTh/G/ZT nanocomposite was subjected to a filtration process along with carefully repeated washing with methanol, then with double-distilled water and finally with acetone. The as-prepared nanocomposite was kept in a vacuum oven for 18 h at 60°C. After complete drying, it was carefully crushed into very fine particles and preserved in a desiccator to carry out further experiments. The PTh/G/ZT nanocomposites having 5%, 10% and 15% (by weight) of G/ZT were named as PTh/G/ZT-1, PTh/G/ZT-2 and PTh/G/ZT-3, respectively. PTh/ZT was also prepared by the identical procedure using ZT instead of G/ZT. PTh nanoparticles were also synthesized without incorporation of G/ZT or ZT by employing an identical process.
Morphological and structural characterization
The morphological and structural characterization of PTh, PTh/ZT and PTh/G/ZT nanocomposites were carried out by X-ray diffraction (XRD), Fourier-transform infrared (FTIR), Raman, ultraviolet–visible spectroscopy (UV-Vis), scanning electron microscopy (SEM), transmission electron microscopy (TEM) and thermogravimetric analysis (TGA) techniques with the help of a Bruker (Japan) D8 diffractometer with Cu Kα radiation at 1.5418 Å, Perkin-Elmer (USA) 1725 instrument on KBr pellets, Varian (USA) FT-Raman spectrometer, Perkin-Elmer Lambda-850 spectrophotometer, JEOL, JSM, 6510-LV (Japan), JEM 2100, JEOL (Japan) and Perkin-Elmer (Pyris Diamond) instrument, respectively.
DC electrical conductivity and sensing experiments were carried out with the help of the four-in-line probe instrument attached with a Proportional Integral Derivative (PID) controlled oven manufactured by Scientific Equipment (Roorkee, Uttarakhand, India). The following equation was employed for the evaluation of DC electrical conductivity

where σ, I, V, W and S used for symbolization of the DC electrical conductivity (Scm−1), current (A), voltage (V), the thickness of the pellet (cm) and probe spacing (cm), respectively. 25,26 The pellets utilized for the DC electrical conductivity and sensing experiments were made with 250 mg of materials using a hydraulic pressure machine operating at a pressure of 70 kN applied for 100 s. For evaluating the DC electrical conductivity stability in the accelerated isothermal conditions, the pellets were subjected to heat at 50°C, 70°C, 90°C, 110°C and 130°C in an air oven. Then, the conductivity was calculated at the relevant temperature at an interval of every 5 min. For evaluating the stability under cyclic ageing conditions, the conductivity experiments were carried out for five successive cycles within a wide range of temperature from 50°C to 130°C. 25,26
Results and discussion
XRD studies
In Figure 1, XRD patterns of PTh, PTh/ZT, PTh/G/ZT-1, PTh/G/ZT-2, PTh/G/ZT-3 and G/ZT are presented. In the case of PTh (Figure 1(a)), a wide diffraction peak observed within the range of 2θ = 15–25° designate the amorphous nature of the polymer. 25,26 In case of G/ZT (Figure 1(f)), the peaks were observed at 2θ = 22.86°, 29.38°, 31.8°, 36.31°, 42.58°, 47.96° and 55.58° which were in good agreement with previously published reports. 34,35,37 In the case of PTh/ZT (Figure 1(b)), the strongest peaks observed at 2θ = 30° may correspond to the presence of ZT in nanocomposites. In case of PTh/G/ZT-1, PTh/G/ZT-2 and PTh/G/ZT-3 (Figure 1(c) to (e)), the maxima of the distinctive peak of PTh moves to a somewhat greater angle which may potentially be accredited to the possible electronic interaction involving PTh chains and G/ZT.

XRD patterns of (a) PTh, (b) PTh/ZT, (c) PTh/G/ZT-1, (d) PTh/G/ZT-2, (e) PTh/G/ZT-3 and (f) G/ZT.
FTIR studies
FTIR spectra of PTh, PTh/ZT, PTh/G/ZT-1, PTh/G/ZT-2 and PTh/G/ZT-3 are illustrated in Figure 2.The spectrum of pristine PTh (Figure 2(a)) revealed a wide absorption band at about 3415.32 cm− 1 may be ascribed to –OH stretching vibration. The peaks at 1640.26 cm−1 and 1405.85 cm−1 may be related to the stretching vibration modes of C=C and C–C present in thiophene ring, respectively. The out-of-plane bending modes of vibrations of C–H bonds present in PTh ring were observed at 1099.63 cm−1 and 1011.34 cm−1. The peak located at 785.85 cm−1 revealed the C–H out-of-plane deformation modes of vibrations of thiophene ring as a result of polymerization. The appearance of a peak at 451.18 cm−1 may be attributed to the deformation mode of C–S–C bond present in the thiophene ring. The band located at 2919.69 cm−1 may be assigned to the stretching vibrations of C–H bond. The FTIR spectra of PTh/ZT and PTh/G/ZT nanocomposites revealed the analogous peaks like PTh, but the peaks are relocated to somewhat smaller wavenumbers as illustrated in Figure 2. This peak shifting may be an indication of an electronic interaction concerning PTh, ZT and G/ZT due to the successful polymerization of thiophene monomers on the surface of ZT and G/ZT. These results were found to be very similar to the existing pieces of literature. 25,26,28 -30

FTIR spectra of (a) PTh, (b) PTh/G/ZT-1, (c) PTh/G/ZT -2, (d) PTh/G/ZT-3 and (e) PTh/ZT.
SEM studies
Figure 3 illustrates the surface morphologies of PTh, PTh/ZT, PTh/G/ZT-1, PTh/G/ZT-2 and PTh/G/ZT-3. The SEM micrographs of PTh (Figure 3(a) and (b)) reveal the morphology possesses flaky and nanorods like structures. In G/ZT (Figure 3(c)), ZT nanoparticles are deposited on the graphene nanosheets. In PTh/ZT (Figure 3(d)), the nanorods became more significant along with flaky structure. The morphology of PTh/G/ZT-3 appeared to be thicker as compared to PTh together with certain flaky as well as sheet-like structures. In PTh/G/ZT-3, ZT nanoparticles decorated on graphene nanosheets could not spot, which shows that the ZT nanoparticles decorated on graphene nanosheets may have a nucleating influence on the polymerization of thiophene and entirely enclosed by the PTh matrix. Also, PTh/G/ZT-3 became highly porous which may be attributed to the excellent sensing response due to greater adsorption sites resulting in fast diffusion of cigarette smoke in the pores which offer greater interaction of polarons with analyte gas. 2,13
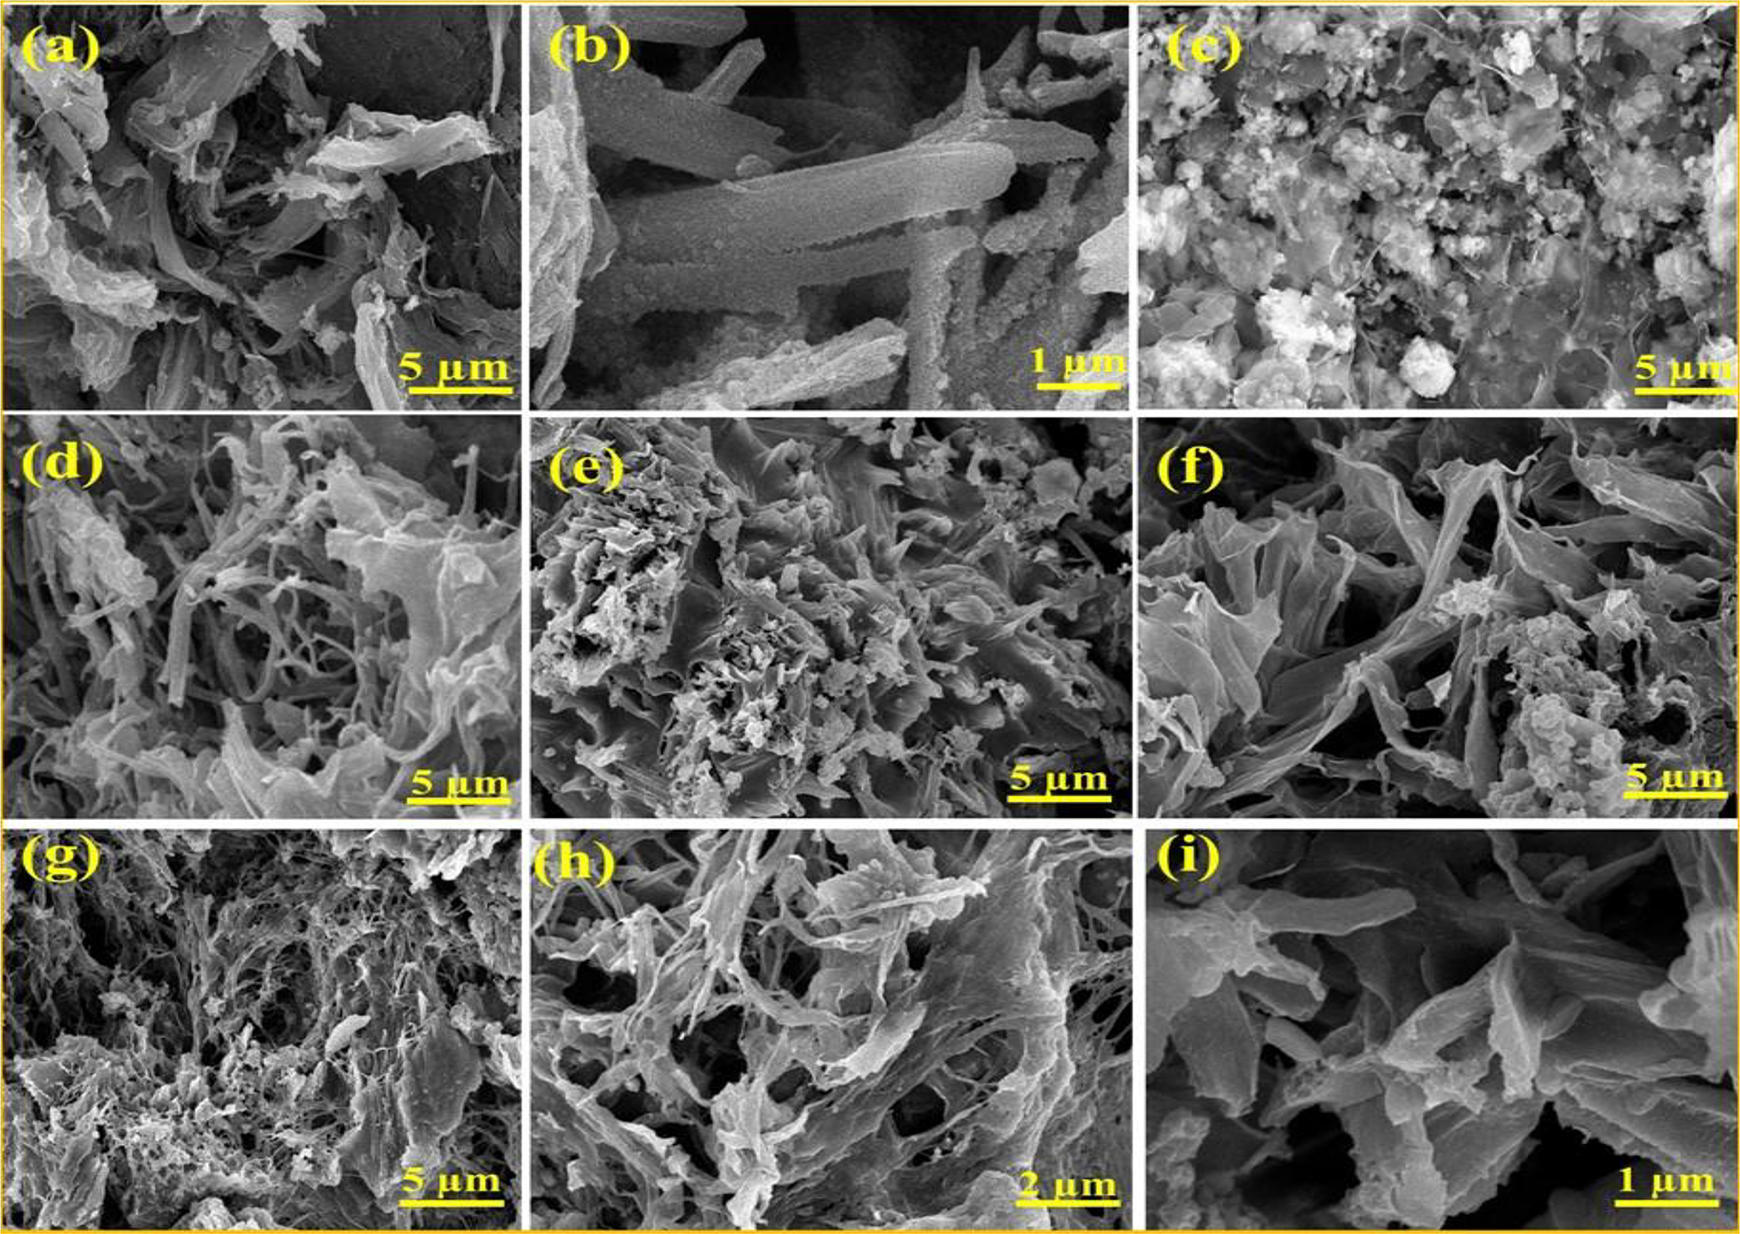
SEM micrographs of (a and b) PTh, (c) G/ZT, (d) PTh/ZT, (e) PTh/G/ZT-1, (f) PTh/G/ZT-2 and (g, h and i) PTh/G/ZT-3 at different magnifications.
TEM studies
TEM images of PTh, PTh/ZT, PTh/G/ZT-1, PTh/G/ZT-2 and PTh/G/ZT-3 are presented in Figure 4. From Figure 4(a), the nanorods along with flakes of PTh could be observed. The complete deposition of ZT nanoparticles on the graphene nanosheets can be observed in TEM images of G/ZT, as shown in Figure 4(b). The TEM image of the PTh/ZT in Figure 4(c) gives an idea that ZT nanoparticles successfully incorporated within the PTh matrix. In the preparation of the PTh/G/ZT, we deposited PTh on the surface of G/ZT, as shown in Figure 4(d) to (f). The efficient electronic network between PTh and graphene nanosheets with the help of a bridge formed by ZT nanoparticles could be explained by TEM analysis, and which may be responsible for higher DC electrical conductivity along with excellent sensing response as well as the reversibility of PTh/G/ZT-3.

TEM micrographs of (a) PTh, (b) G/ZT, (c) PTh/ZT, (d) PTh/G/ZT-1, (e) PTh/G/ZT-2 and (f) PTh/G/ZT-3.
Raman spectroscopy
Raman spectroscopic study was carried out to ensure the interaction between PTh and G/ZT. The typical Raman spectra of PTh, PTh/ZT and PTh/G/ZT-3 are revealed in Figure 5. The Raman spectrum of PTh (Figure 5(a)) shows two main peaks where the first prominent peak at 1448.20 cm−1 corresponds to C=C stretching while the second small peak at 1036.45 cm−1 related to C–C stretching along with C–H wagging component. 41 The characteristic peaks of PTh at 1036.45 cm−1 and 1448.20 cm−1 moved to 1043.39 cm−1 and 1454.20 cm−1 in case of PTh/ZT (Figure 5(b)), whereas in case of PTh/G/ZT-3 (Figure 5(c)) these peaks witnessed at 1046.05 cm−1 and 1456.42 cm−1. The shift in the characteristic peaks of PTh may correspond to electronic interaction involving PTh and G/ZT which favours the transmission of charge from ZT to graphene nanosheets and thus developing additional holes in PTh and graphene. 8

Raman spectra of (a) PTh, (b) PTh/ZT and (c) PTh/G/ZT-3.
Thermogravimetric analysis
The TGA curves of PTh, PTh/ZT, PTh/G/ZT-1, PTh/G/ZT-2 and PTh/G/ZT-3 are revealed in Figure S1 in the Online Supplemental Material. From the figure, it is obvious that both the remaining weight and the decay temperature increase by combining ZT and G/ZT with pristine PTh. All the PTh/G/ZT nanocomposites were more stable than PTh/ZT, indicating the effect of graphene on thermal stability. The results indicated that as the amount of G/ZT increases in PTh/G/ZT, the thermal stability also increases.
Optical studies
The UV-Vis absorption peaks of PTh, PTh/ZT and PTh/G/ZT nanocomposites are given in Figure S2 in the Online Supplemental Material. The peak witnessed at 308 nm in case of PTh is accredited to the π−π* electronic transition of thiophene. 28 For PTh/ZT, PTh/G/ZT-1, PTh/G/ZT-2 and PTh/G/ZT-3 nanocomposites, the characteristic band of PTh red-shifted to 310 nm, 314 nm, 316 nm and 321 nm, respectively, and may be ascribed to the upsurge in the degree of π-conjugation of PTh by creating a well-organized linkage by an electronic transition from ZT to graphene nanosheets.
DC electrical conductivity studies
The initial DC electrical conductivity of PTh, PTh/ZT, PTh/G/ZT-1, PTh/G/ZT-2 and PTh/G/ZT-3 nanocomposites was determined through a standard four-in-line probe technique. The conductivity of PTh was found to be about 5.53 × 10⁻⁴ Scm−1, whereas the conductivities were found to be about 3.98 × 10⁻³, 8.52 × 10⁻³, 5.07 × 10⁻² and 9.74 × 10⁻² Scm−1 for PTh/ZT, PTh/G/ZT-1, PTh/G/ZT-2 and PTh/G/ZT-3, respectively. The conductivity related to PTh considerably boosted after encapsulation of ZT through the formation of a well-organized network of the π-conjugated system in the PTh chains as a consequence of polymerization of thiophene on the surface of ZT. Therefore, the electronic interaction involving the lone pairs of electrons of the sulphur atoms of PTh with ZT raises the number and mobility of the polarons/bipolarons which cause a significant boost in conductivity (Figure 6(a)). In the case of PTh/G/ZT nanocomposites, ZT may be considered as a bridge between PTh and graphene nanosheets. Therefore, ZT bridges facilitate an additional tunnelling drive of the charge carriers between PTh and graphene which create holes in graphene (Figure 6(b)). It is a well-known fact that charge mobility in graphene is very high (2.0 × 105 cm2 V− 1 s− 1) 39 as compared to the CPs (2.7 × 10− 5 cm2 V− 1 s− 1). 42 As the amount of G/ZT increases in the PTh/G/ZT nanocomposites, the bridges provided by ZT also increase, which may help in the creation of a greater number of holes in graphene. Thus, electrical conductivity increases due to the rapid and unobstructed movement of charge carriers along with the extended π-conjugated structure of graphene. The highest electrical conductivity was witnessed for the PTh/G/ZT-3.

The plausible mechanism for enhanced conductivity of (a) PTh/ZT and (b) PTh/G/ZT nanocomposite.
Stability under isothermal ageing conditions
The stability in terms of DC electrical conductivity retaining the ability of PTh, PTh/ZT, PTh/G/ZT-1, PTh/G/ZT-2 and PTh/G/ZT-3 was examined under an accelerated isothermal ageing environment as represented in Figure 7. The equation employed for the calculation of relative DC electrical conductivity (σr, t) at a particular temperature was as follows
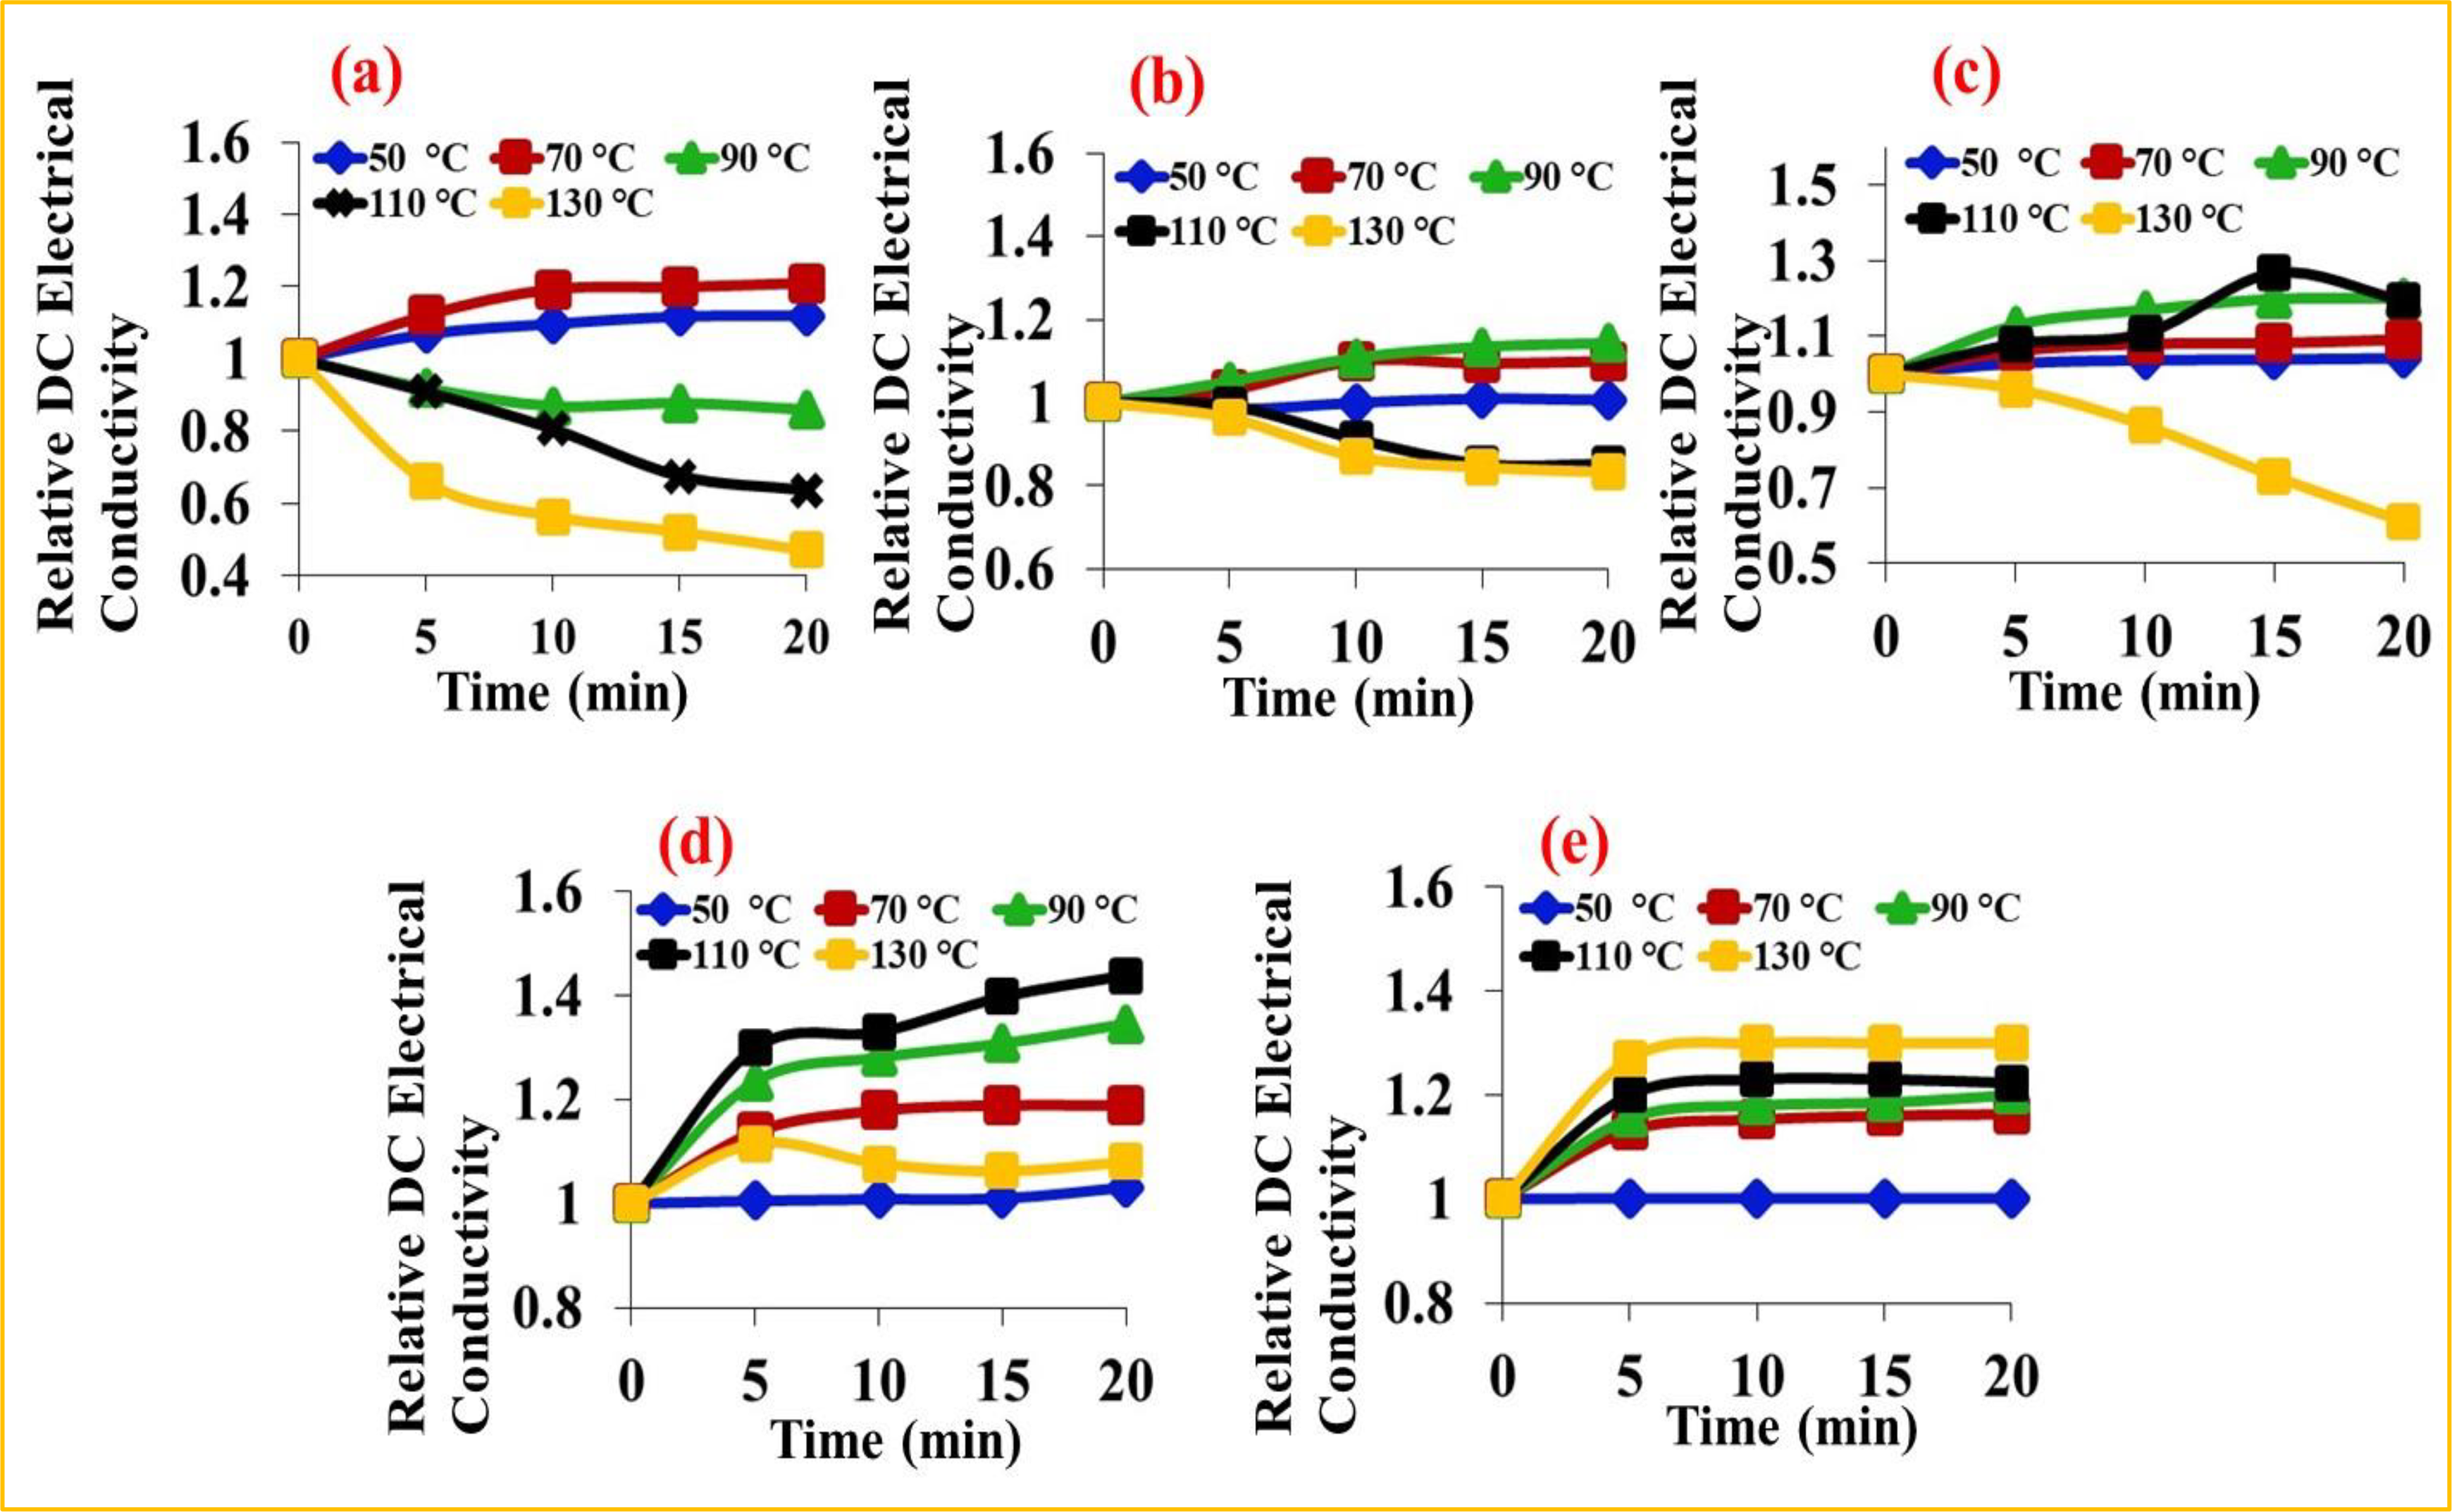
Relative DC electrical conductivity versus time of (a) PTh, (b) PTh/ZT, (c) PTh/G/ZT -1, (d) PTh/G/ZT-2 and (e) PTh/G/ZT-3 under isothermal ageing conditions.

where σt and σ0 symbolize the DC electrical conductivity at time t and zero, respectively. 25,26 The conductivity retaining ability (i.e. stability) of PTh was satisfactory at 50°C and 70°C. In the case of PTh, direct heat at the temperatures above 70°C resulted in a regular dropping of conductivity which may be caused by damage of materials as well as the loss of the doping agent. The PTh/ZT appeared to be highly stable at 50°C, 70°C and 90°C while the stability of PTh/G/ZT-1 was greatly enhanced up to 110°C. PTh/G/ZT-2 showed high stability up to 110°C and gain in conductivity with increasing temperature was also greater than that in PTh/G/ZT-1. PTh/G/ZT-3 exhibited the highest gain in conductivity with increasing temperature up to 130°C with the greatest stability among all the samples. The gain in conductivity may be due to greater mobility of polarons at higher temperatures. These results showed that PTh/G/ZT-3 could be a promising semiconducting material in various electrical and electronic applications even at 130°C due to its outstanding isothermal stability.
Stability under cyclic ageing conditions
The following equation was used to calculate the relative DC electrical conductivity (σr)

where σT and σ50 correspond to the DC electrical conductivity at the temperature T (°C) and 50°C, respectively. 25,26 The outcome of these experiments revealed that the conductivity rose steadily for every single cycle following a regular trend as a result of a rise in the mobility of polarons at higher temperatures, as revealed in Figure 8. PTh/G/ZT-2 and PTh/G/ZT-3 displayed the greatest upsurge in DC electrical conductivity with excellent stability. As a result, it may be concluded that the PTh/G/ZT-2 and PTh/G/ZT-3 were the most stable semiconductors among all the materials under cyclic ageing environments. These two materials could be promising materials in numerous technological fields which demand stable conductivity for many repetitions even at higher temperatures.

Relative electrical conductivity of (a) PTh, (b) PTh/Z, (c) PTh/G/ZT -1, (d) PTh/G/ZT-2 and (e) PTh/G/ZT-3 under cyclic ageing conditions.
Sensing
The sensing responses of PTh, PTh/ZT, PTh/G/ZT-1, PTh/G/ZT-2 and PTh/G/ZT-3 based pelletized sensors were calculated in terms of change in their DC electrical conductivity during complete exposure to cigarette smoke for 60 s (Figure 9). The sensing experiment procedures were as follows: after connecting the fabricated sensor pellet with four probes, it was kept in a sealed compartment comprising an inlet for introducing cigarette smoke for 60 s. In the cigarette smoke, the conductivity of sensor decreased continuously till 60 s. In this stage, at first cigarette smoke was adsorbed on the sensor surface, and an electronic interaction involving polarons of PTh and the lone pairs of electrons or π-electrons present in the various constituents of cigarette smoke reduced the mobility of polarons causing a decrease in conductivity. 43,44 After that, sensor pellet was exposed in the ambient air for another 60 s. In the air, an immediate spike in conductivity was detected due to retrieval of the mobility of polarons through the desorption of cigarette smoke from sensor surface which diminished the electronic interaction of polarons with constituents of cigarette smoke. The sensing responses, that is, change in conductivity, were found to be 2.12 × 10⁻⁴ (38.33%), 1.95 × 10⁻³ (48.99%), 5.42 × 10⁻³ (63.61%), 3.62 × 10⁻² (71.40%) and 7.94× 10⁻² Scm−1 (81.51%) for PTh, PTh/ZT, PTh/G/ZT-1, PTh/G/ZT-2 and PTh/G/ZT-3, respectively. The highest sensing response of PTh/G/ZT-3 based sensor may be potentially attributed to its highest electrical conductivity in addition to the vast surface area provided by G/ZT which offers a greater number of adsorption sites as compared to other samples.
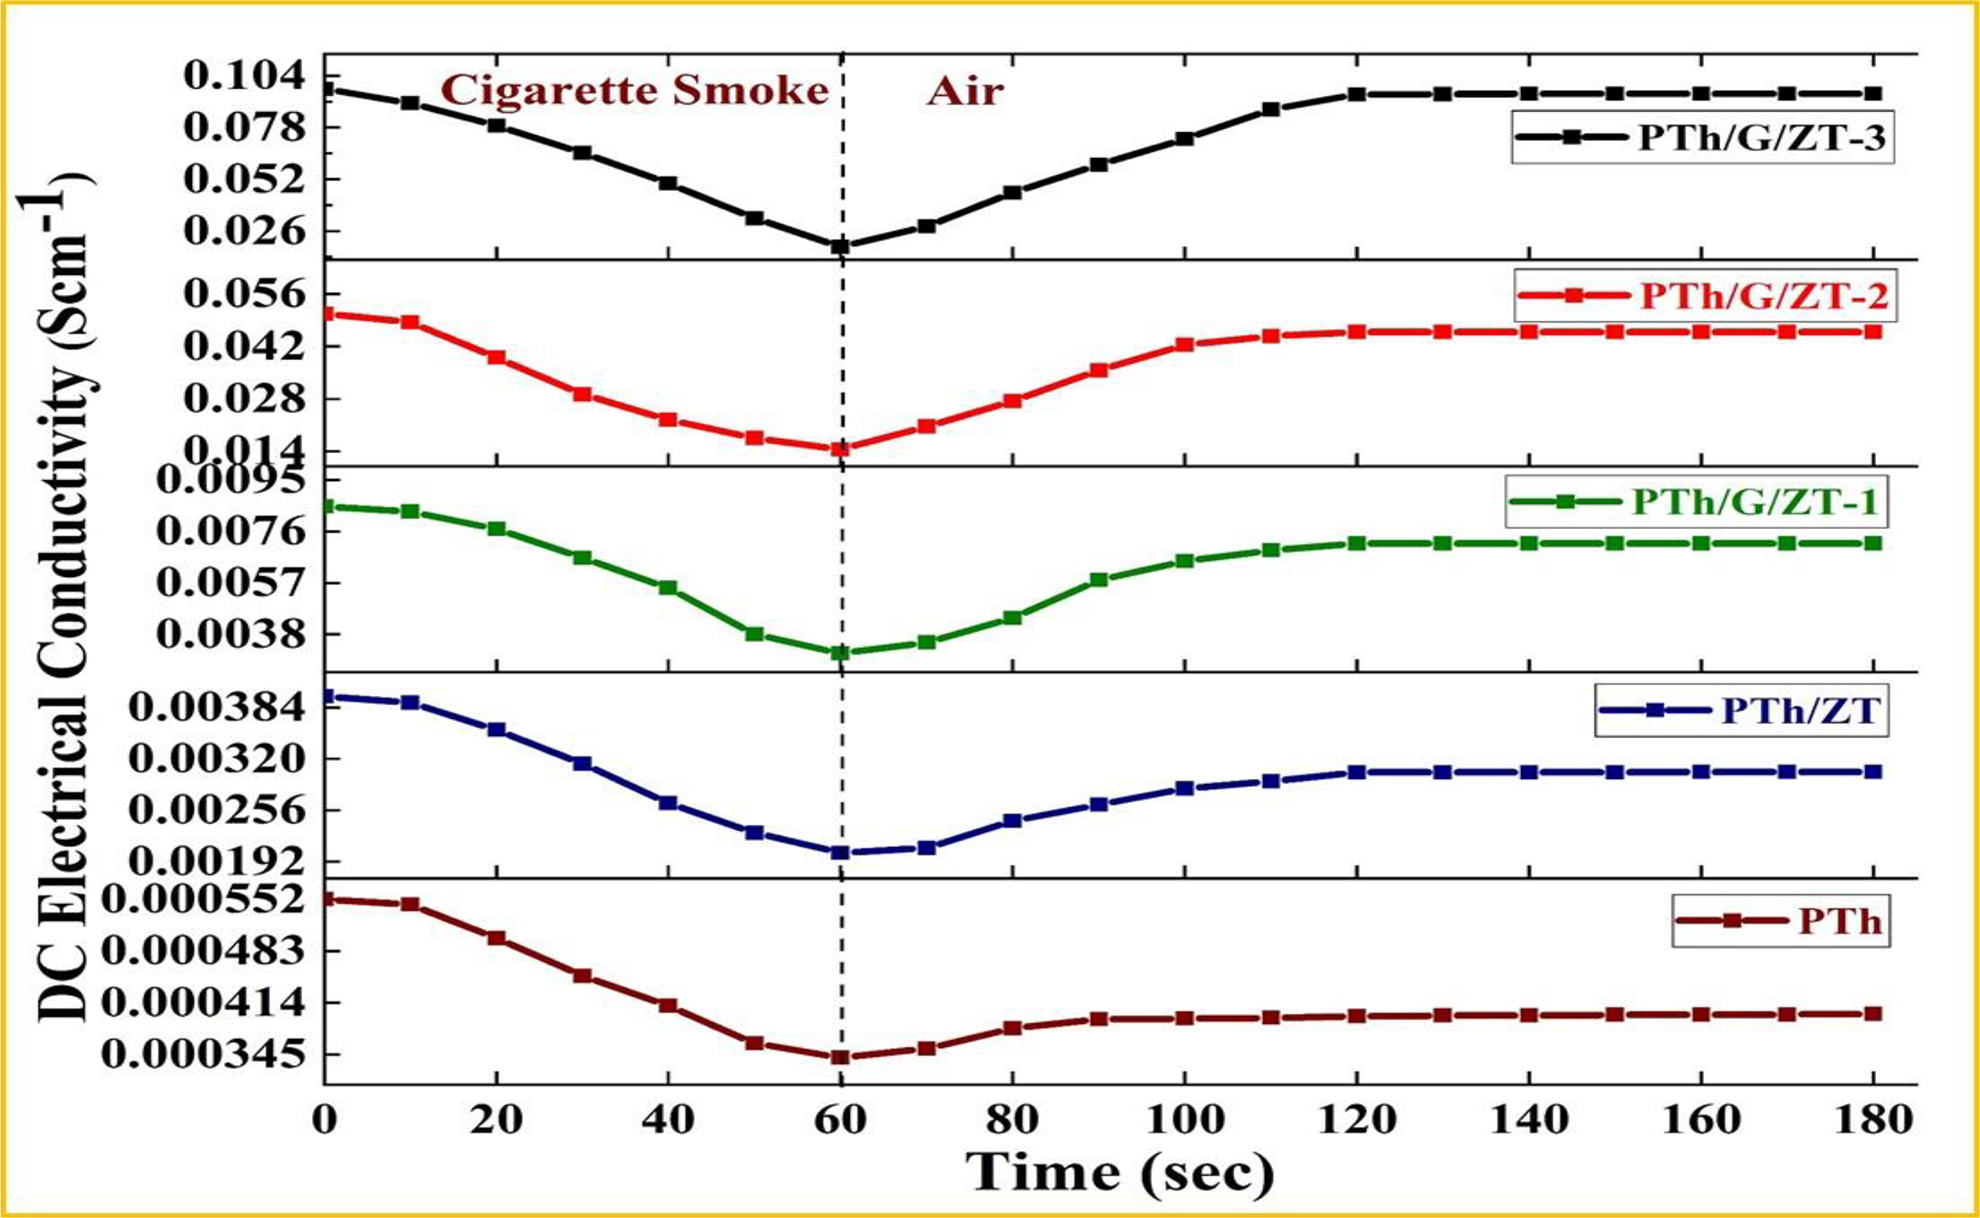
The sensitivity of PTh, PTh/ZT, PTh/G/ZT-1, PTh/G/ZT-2 and PTh/G/ZT-3 on exposure to cigarette smoke followed by exposure to ambient air.
Reversibility
The reversibility (i.e. retrieval of initial conductivity) of all the sensors was determined through first exposing them in the cigarette smoke for 20 s and after that another 20 s in the ambient air for the overall period of 360 s comprising nine successive cycles as depicted in Figure 10. After the completion of the ninth cycle, the reversibility in terms of the conductivity recovery was 41.59%, 51.00%, 72.41%, 81.45% and 90.55% of initial conductivity for the PTh, PTh/ZT, PTh/G/ZT-1, PTh/G/ZT-2 and PTh/G/ZT-3, respectively. These results showed that a small amount of graphene could significantly improve the reversibility, which is very beneficial for continuous use of the sensor. Therefore, PTh/G/ZT-3 could be an excellent material for the fabrication of highly efficient cigarette smoke sensors exhibiting quick and high sensing response along with excellent reversibility at room temperature.

Reversibility of PTh, PTh/ZT, PTh/G/ZT-1, PTh/G/ZT-2 and PTh/G/ZT-3 on alternate exposure to cigarette smoke and ambient air.
Components of cigarette smoke accountable for the change in conductivity
The sensing response of PTh/G/ZT-3 in the environment of ammonia, carbon dioxide, ethanol, formaldehyde, acetone, benzene, toluene and phenol was calculated to identify which component of cigarette smoke was the most responsible for conductivity change during exposure for 60 s (Figure 11). As soon as the sensor pellet was exposed to the atmosphere of these gases/vapours, they got adsorbed on the surface and interaction between polarons of PTh and lone pairs on nitrogen atoms in ammonia (NH3) or lone pair on the oxygen atom of carbon dioxide/formaldehyde/ethanol/acetone/phenol, or π-electrons present in benzene/toluene/phenol reduced the mobility of charge carriers (polarons). As a result of these electronic interactions, the electrical conductivity decreases due to the reduction in the movement of charge carriers. The maximum change in the DC electrical conductivity detected for ammonia may be attributed to the superior accessibility of weakly bound lone pairs of the electrons which strongly interacts with polarons of PTh and thus significantly reduces their mobility. As revealed in Figure 11, ammonia and ethanol may be the most responsible constituents for sensing response towards the cigarette smoke.

Change in DC electrical conductivity of PTh/G/ZT-3 sensor due to various components of cigarette smoke.
Suggested mechanism for sensing
Herein, we suggested a plausible sensing mechanism based on the adsorption–desorption process of cigarette smoke on the vast and porous surface of PTh/G/ZT-3 based sensor, as illustrated in Figure 12. Accordingly, the different aspects of the origin of extraordinary electrical conductivity in PTh/G/ZT nanocomposites along with sensing performances towards cigarette smoke have been discussed to know the sensing mechanism correctly. As soon as cigarette smokes get adsorbed into the pores of the sensor, electronic interaction between polarons and lone pairs of electrons or π-electrons presented in the various components of cigarette smoke takes place. Consequently, the movement of polarons/bipolarons was obstructed, and thus a substantial decrease in the conductivity was witnessed. When the sensor was exposed in the ambient air, the cigarette smokes started to desorb from the pores of the sensor surface. As a result, the electrical conductivity started to revert towards the initial value. So, the adsorption–desorption process of cigarette smoke on the large surface area of PTh/G/ZT-3 based sensor significantly alters the motion of polarons/bipolarons which is the reason for the drop and rise in electrical conductivity in the environment of the cigarette smoke and the ambient air, respectively.

The suggested mechanism of interaction of cigarette smoke with PTh/G/ZT-3 nanocomposite.
Conclusions
In this study, we have synthesized the novel nanocomposites of PTh with ZT and G/ZT by in situ chemical oxidative polymerization using ferric chloride as both the oxidant as well as a doping agent. The as-prepared materials were characterized by SEM, TEM, FTIR, TGA, Raman, UV-Vis and XRD techniques. The initial conductivities were found to be 5.53 × 10⁻⁴ Scm−1, 3.98 × 10⁻³ Scm−1, 8.52 × 10⁻³ Scm−1, 5.07 × 10⁻² Scm−1 and 9.74 × 10⁻² Scm−1 for PTh, PTh/ZT, PTh/G/ZT-1, PTh/G/ZT-2 and PTh/G/ZT-3, respectively. The sensing responses of PTh, PTh/ZT, PTh/G/ZT-1, PTh/G/ZT-2 and PTh/G/ZT-3 based sensors were found to be 38.33%, 48.99%, 63.61%, 71.40% and 81.51% along with their reversibility responses of 41.59%, 51.00%, 72.41%, 81.45% and 90.55% after nine successive cycles, respectively. Ammonia might be the most accountable for change in conductivity among the various constituents of cigarette smoke (ammonia, carbon dioxide, ethanol, formaldehyde, acetone, benzene, toluene, phenol) tested here. We efficaciously described the sensing mechanism by the adsorption–desorption process of cigarette smoke on the large surface area of PTh/G/ZT-3, which substantially altered DC electrical conductivity. Thus, PTh/G/ZT-3 might be a very promising semiconductor in the various electrical application even at a high temperature of 130°C due to its outstanding isothermal and cyclic stability besides excellent cigarette smoke sensing performance.
Supplemental material
Supplemental Material, Supplementary_information - Polythiophene/graphene/zinc tungstate nanocomposite: Synthesis, characterization, DC electrical conductivity and cigarette smoke sensing application
Supplemental Material, Supplementary_information for Polythiophene/graphene/zinc tungstate nanocomposite: Synthesis, characterization, DC electrical conductivity and cigarette smoke sensing application by Ahmad Husain, Sharique Ahmad and Faiz Mohammad in Polymers and Polymer Composites
Footnotes
Acknowledgement
Ahmad Husain thankfully acknowledges Department of Physics and USIF, AMU.
Declaration of conflicting interests
The author(s) declared no potential conflicts of interest with respect to the research, authorship and/or publication of this article.
Funding
The author(s) received no financial support for the research, authorship and/or publication of this article.
Supplemental material
Supplemental material for this article is available online.
References
Supplementary Material
Please find the following supplemental material available below.
For Open Access articles published under a Creative Commons License, all supplemental material carries the same license as the article it is associated with.
For non-Open Access articles published, all supplemental material carries a non-exclusive license, and permission requests for re-use of supplemental material or any part of supplemental material shall be sent directly to the copyright owner as specified in the copyright notice associated with the article.