
Abstract
Previous publications showed that graphene sheets polymer nanocomopsites were prepared by incorporating previously prepared graphene into the polymer matrix through two or more successive steps. In this work, graphene sheets were exfoliated from graphite inside the polymer matrix solution for certain period in one step. This approach was easy to perform, low cost, high mass production of graphene and, almost, produces effective results. In this respect, electrolytic solution from poly(vinyl alcohol) (PVA) and salt was prepared and exfoliation process took place inside it for different times. After that, solution was dried to get films of PVA loaded with different concentrations of graphene sheets. Scanning electron microscopic and transmission electron microscopic images of exfoliated graphene sheets were studied. Raman spectroscopy of graphite, graphene nanosheets, and PVA-loaded graphene was studied. The dielectric permittivity, dielectric loss, and alternating current electrical conductivity were studied and had maximum values at 10 min of exfoliation time. Cole–Cole impedance plots show semicircles behavior with lowest radius for samples prepared at 10 min. The elastic modulus was found to have a maximum value at exfoliation time of 30 min.
Keywords
Introduction
One of widely used material is the polymeric material, which is a low cost besides excellent processability. Its relatively low electrical and thermal conductivities and low modulus make limitations for applications. To overcome these applications limitations, organic and/or inorganic fillers are added to produce polymer composite. The inorganic filler-composite material properties are enhanced due to the interfacial interaction between the filler and the polymer chains. The size, shape, and nature of the inorganic filler play an important role in the composite properties. As the size of the filler material diminishes, the surface area increases allowing more interfacial interactions that contribute to the composite properties. In general, the overall composite properties are strongly affected as the size scale of the filler phase reaches few nanometers. Thus, efforts are done to design new materials with novel properties. These materials have found applications as contact lenses, scratch-resistant coatings, optical waveguides, data storage devices, chemical filters, electrolytes, biosensors, and dental fillings.1–4
In recent years, graphene, as an inorganic filler, has attracted attention because of its unique mechanical, thermal, optical, and electronic properties. The single-atom thickness property of graphene makes it miracle material. The charge carriers’ mobility of graphene is high as 2 × 105 cm2 V−1 cm−1. 5 It has Young’s modulus, fracture strength, and thermal conductivity of 1100 GPa, 125 GPa, and 5000 W m−1 K−1, respectively.6,7 It also has a calculated specific surface area of 2630 m2 g−1. 8 There are two main approaches to produce graphene-based nanosheets, namely, top-down and bottom-up approaches. 9 The basic idea of the top-down method depends on the exfoliation of graphite or graphite oxide into one or more graphene sheets. One of the top-down cost-effective, environmentally friendly, and large-scale production of graphene is the use of ionic liquids (ILs) for the electrochemical exfoliation of graphite. The unique properties of ILs such as thermal stabilities, wide electrochemical potential window, negligible vapor pressure, good ion conductivity, low viscosity, and recyclability make them have advantages for electrochemistry, liquid/liquid extraction, catalysis, and chemical syntheses.10–12
ILs and water are used with different ratios as an electrolyte, while graphite anode and cathode are used as poles in this electrolyte.12,13 This technique produces graphene oxide directly from graphite with high density of defects that have mischievous effect on the carrier mobility. 14 Both the water/IL ratio and applied voltage play the roles of the quality of produced graphene. In order that exfoliation takes place, the applied voltage must be greater than the narrower electrochemical potential of water which then dissociated and produced oxygen and hydroxyl radicals. 14
On the other hand, poly(vinyl alcohol) (PVA) has many advantages in applications over other polymers because it is biologically degradable, biocompatible, chemically versatile, free of organic solvents and dyes, water soluble, easy to process, innocuous, low cost, available in large quantities, and nonflammable. The hydroxyl (–OH) groups of the hydrophilic PVA can interact with –OH or carboxyl groups (−COOH) present in GO to form a stable complex. 15 In last decade, there are huge publications for polymers loaded with graphene or graphene oxide and studied their physical properties.16–30
The common feature of these publications is that already synthesized graphene or graphene oxide sheets are incorporated inside PVA solution and then get the polymer nanocomposites in two successive steps. This technique is modified in the present work into one step.
In the present work, electrochemical exfoliation of graphite inside an electrolyte composed of PVA dissolved in NaCl solution for a certain period at room temperature and then cast to get PVA-loaded graphene oxide films. The alternating current (AC) electrical and mechanical properties of these films will be studied.
Experimental
Materials
PVA with molecular weight 89,000 and 99+% hydrolyzed was purchased from Sigma-Aldrich (St. Louis, Missouri, USA). Graphite rods used here were the central core rods of torch batteries. Graphite rods were unslung from batteries, cleaned, washed with ethanol, and dried for 1 h at 80°C, then fixed as shown in Figure 1.
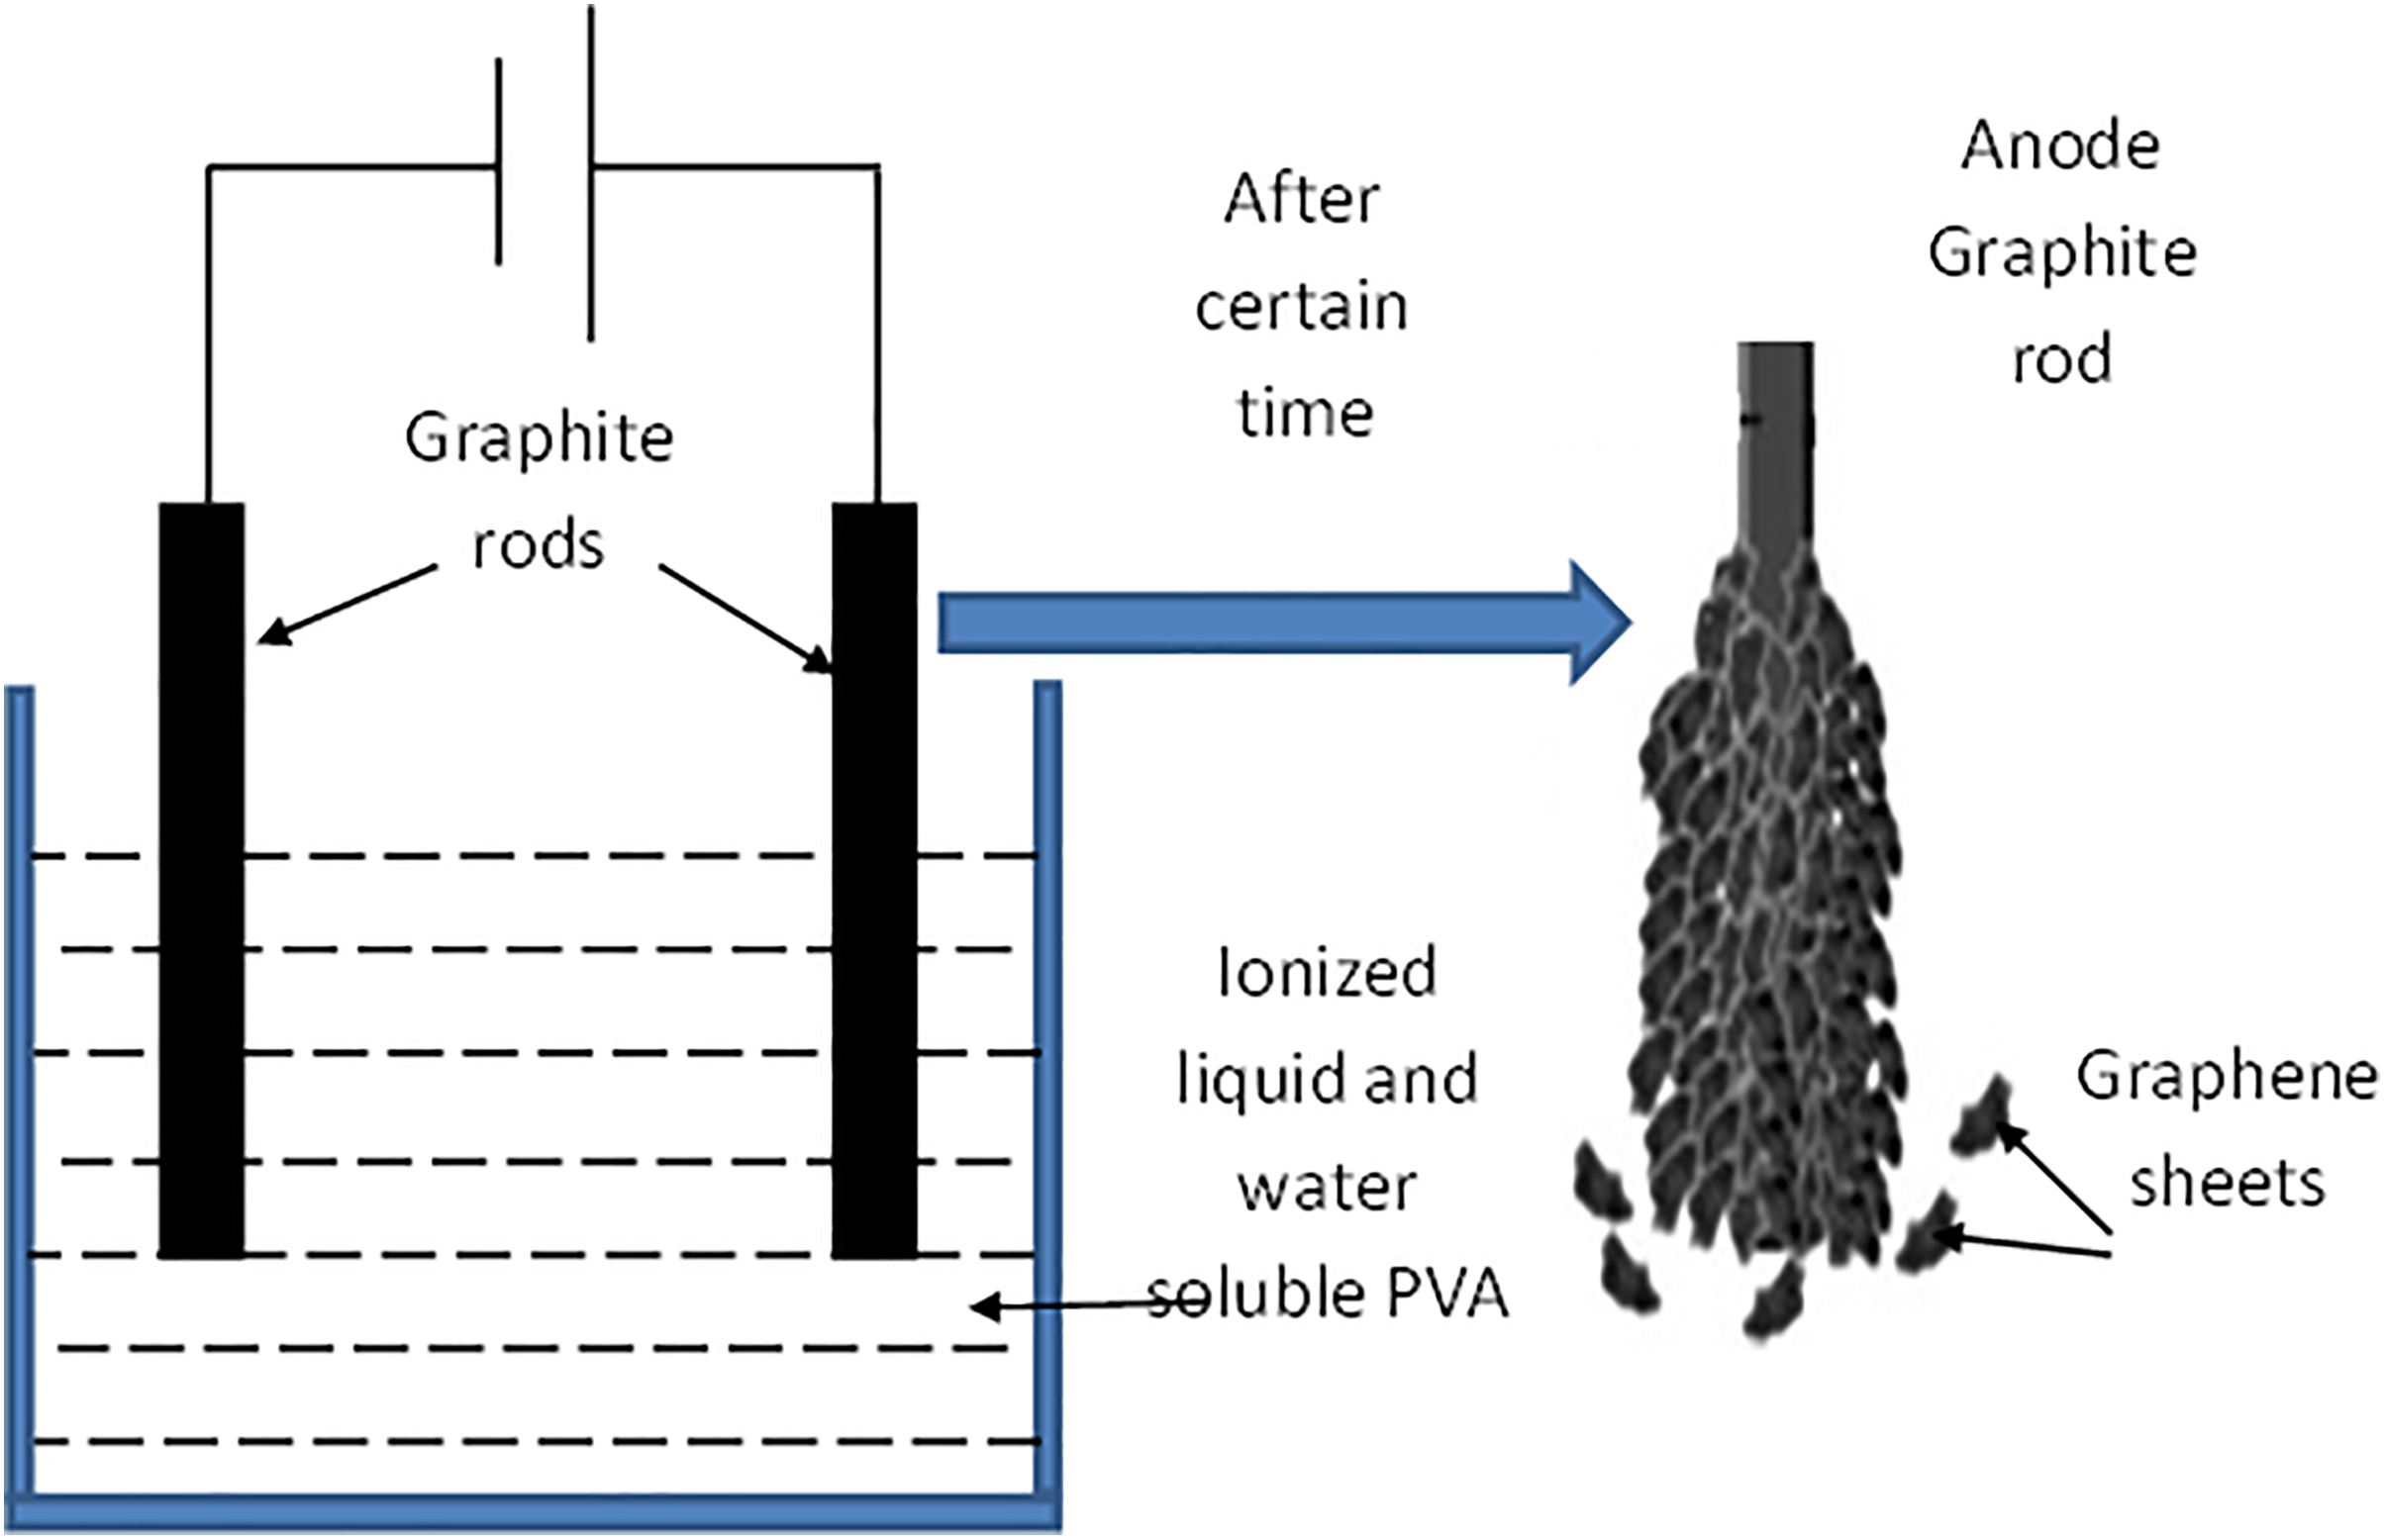
Schematic presentation of experimental setup and graphite anode exfoliation.
Samples preparations
Firstly, 10 mg of salt were dissolved in 30 ml of deionized water. The two graphite rods were fixed in a Teflon plate and connected from the upper ends to a direct current (DC) power supply. The other lower ends of the rods were immersed in the salt solution. The power supply was adjusted such that the output power remains constant at 1 W. The experiment was left for 60 min and the color of the transparent solution was noticed to change into brown and dark brown. The experiment was stopped and the solution was filtered and a black powder was produced. The powder was washed by ethanol and dried at 90°C for 2 h. Scanning electron microscopic (SEM) and transmission electron microscopic (TEM) images of this powder were shown in Figure 2(a) and (b), respectively, to ensure the presence of graphene sheets. Raman spectroscopy was done also on this powder to confirm the results.
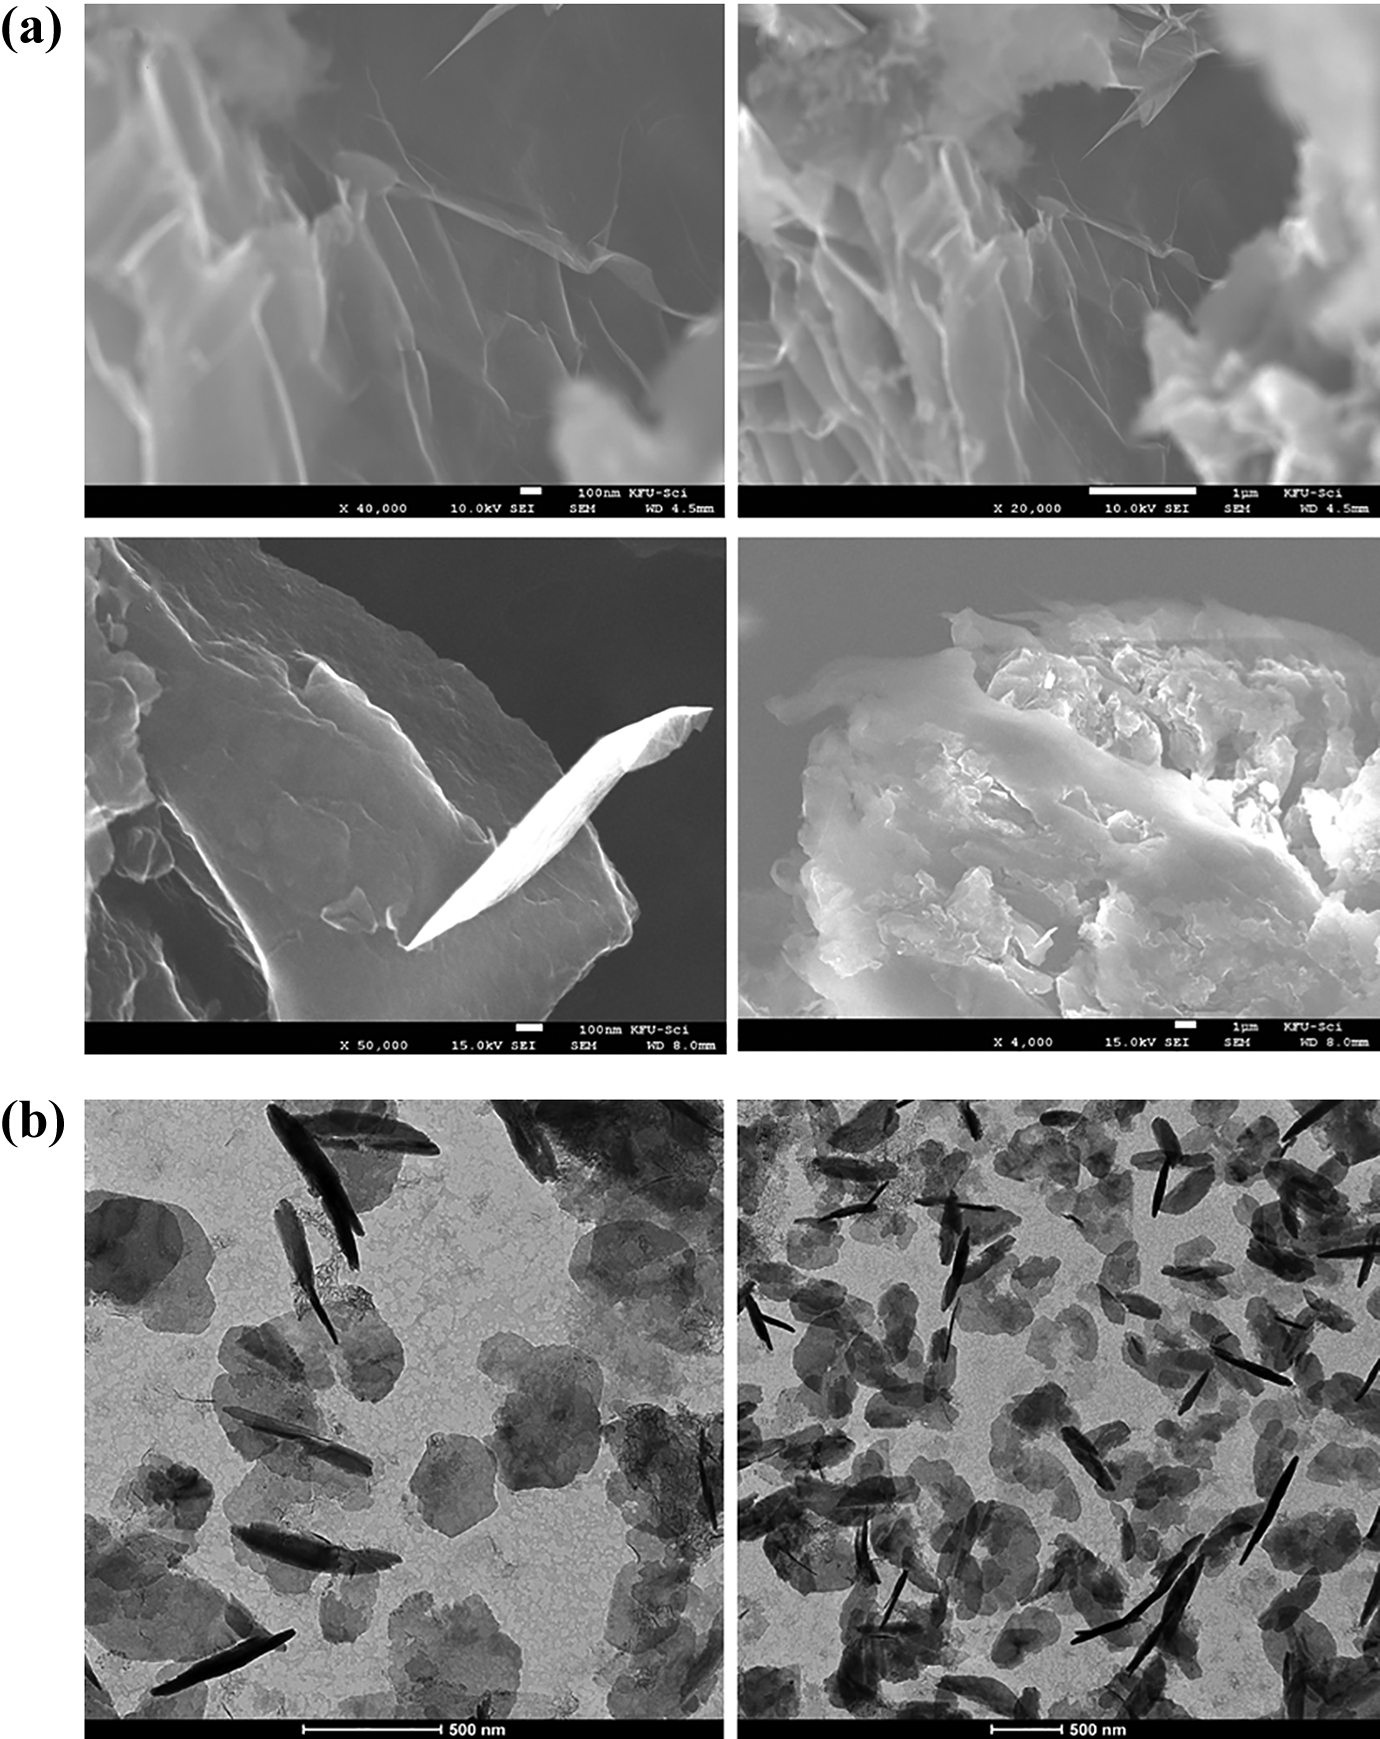
(a) SEM images of exfoliated graphene and (b) TEM images of exfoliated graphene.
Secondly, 1°g of PVA was dissolved in 20 ml of deionized water at 90°C and 10 mg of salt was also dissolved in 5 ml of deionized water. The two solutions were mixed to get an electrolytic solution. The two graphite rods were immersed in this solution under the same previously mentioned conditions in the previous paragraph with keeping the output power of the power supply constant at 1 W for all prepared samples. The process was continued and after a certain time, exfoliation of graphite rode anode took place and again the color of the electrolyte was noticed to convert from transparent to brown and dark brown. After certain time, the process stopped and the solution was ultrasonicated for 20 min and then cast in petri dish and left to dry at room temperature to get a film of PVA loaded with graphene sheets. The experiment was repeated many times for different exfoliation times of 0, 5, 10, 30, and 60 min to get films of PVA loaded with different concentrations of graphene.
Characterizations
Raman spectroscopy
Micro-Raman spectra for the used graphite before exfoliation, exfoliated graphene sheets, and PVA-loaded graphene sheets were acquired using the Horiba (Labram-evolution) spectrometer in the confocal geometry with the confocal hole size of 50 μm. He-Ne laser source (633 nm) was used at 25% numerical density filter and the Raman signal excitation and collection were performed from 50× wide distance objective. The spectral and spatial resolutions of the spectrometer were maintained at 2 cm−1 and 1 μm, respectively.
SEM and TEM spectroscopy
SEM photos were taken for exfoliated graphene sheets using low-vacuum high-resolution field emission Joel electron microscope. High-resolution transmission electron microscope (HR-TEM, Tecnai G20, FEI, The Netherlands) was used for the purpose of imaging.
TEM images were taken for the exfoliated graphene sheets using HR-TEM. Two different modes of imaging were employed; the bright field at electron accelerating voltage 200 kV using lanthanum hexaboride (LaB6) electron source gun and the diffraction pattern imaging.
AC electrical properties tests
Samples used were in the form of circular discs of diameter 1 cm and thickness of 0.1 mm held between two-brass electrodes. The electrical and relaxation properties were studied by impedance spectroscopy (IS) and measurements were performed using Novo control concept 50 system in the 1–107 Hz frequency range and under AC voltage of 0.1 V. The IS measurements were performed at room temperature.
Tensile tests
Samples used were in the form of strip films of length 3 cm, width 0.5 cm, and thickness 0.1 mm. All the mechanical tests were carried out using a Dynamic Mechanical Analyzer (DMA) Q800 (TA Instruments LLC, New Castle, Delaware, USA) instrument with film clamps.
The tensile stress–strain tests were carried out on film specimens at room temperature and at a force rate of 1.5 N min−1 using the DMA Q800 instrument.
All measurements and tests were repeated many times to ensure the reproducibility of results.
Results and discussions
Raman spectroscopy of graphite, graphene, and PVA-loaded graphene
Raman spectra of the used graphite and exfoliated graphene inside the salt solution are shown in Figure 3. Graphite has a layered planer structure (P63/mc) comprising of C-atoms arranged in honeycomb lattice in AB or ABC staking. The planer layer graphene has a 2-D coordination of C-atoms exhibiting hexagonal symmetry (P6/mmm). Using the group theory, the important atomic vibrational modes in graphitic systems are defect band (D-band), optical nonpolar phonon (E2g) or G-band and 2-D band due to second-order Raman scattering related to D-band. In 3-D graphite, the Raman modes are positioned at 1362, 1562, and 2690 cm−1. The 2-D band is particularly sensitive to the type and number of layers stacked; on increasing the number of layers, width and height of 2-D mode increase rapidly due to enhanced double resonance Raman (DRR) processes. 31 Actually, the DRR scattering takes place due to two electron–phonon scattering event, increases on increasing the number of layers; for instance, trilayer graphene, which has three-level splitting of electronic and phonon bands, shows large number of DRR process and broad 2-D peak. In this regard, the graphene layers always show reduced DRR scattering and thus less intense and smaller line width peaks. Clearly, the 2-D band in graphene is almost absent in comparison to broad 2-D band of graphite with line width Δ of 74 cm−1. Figure 4 shows the Lorentzian shape of the 2-D peak profile of graphene and graphite, which also demonstrates that 2-D graphite comprise of multiple Gaussians corresponding to each DRR process, while the 2-D graphene has only a couple of Gaussians—confirming in our samples only mono- or bilayer graphene is present. In addition, the G-mode of our graphene samples is positioned at 1600 cm−1 and shows an upshift approximately 19 cm−1 in comparison of the graphitic G-band and that fact conclusively confirms a pure single layer of graphene in our samples because an upshift of ≥10 cm−1 and ≥22 cm−1 are qualifying markers for bi- and monolayer graphene. 32 Moreover, the graphene samples are in reduced form and the obtained ratio of ID/IG is high and near unity, which implies stronger sp2 hybridization. 33
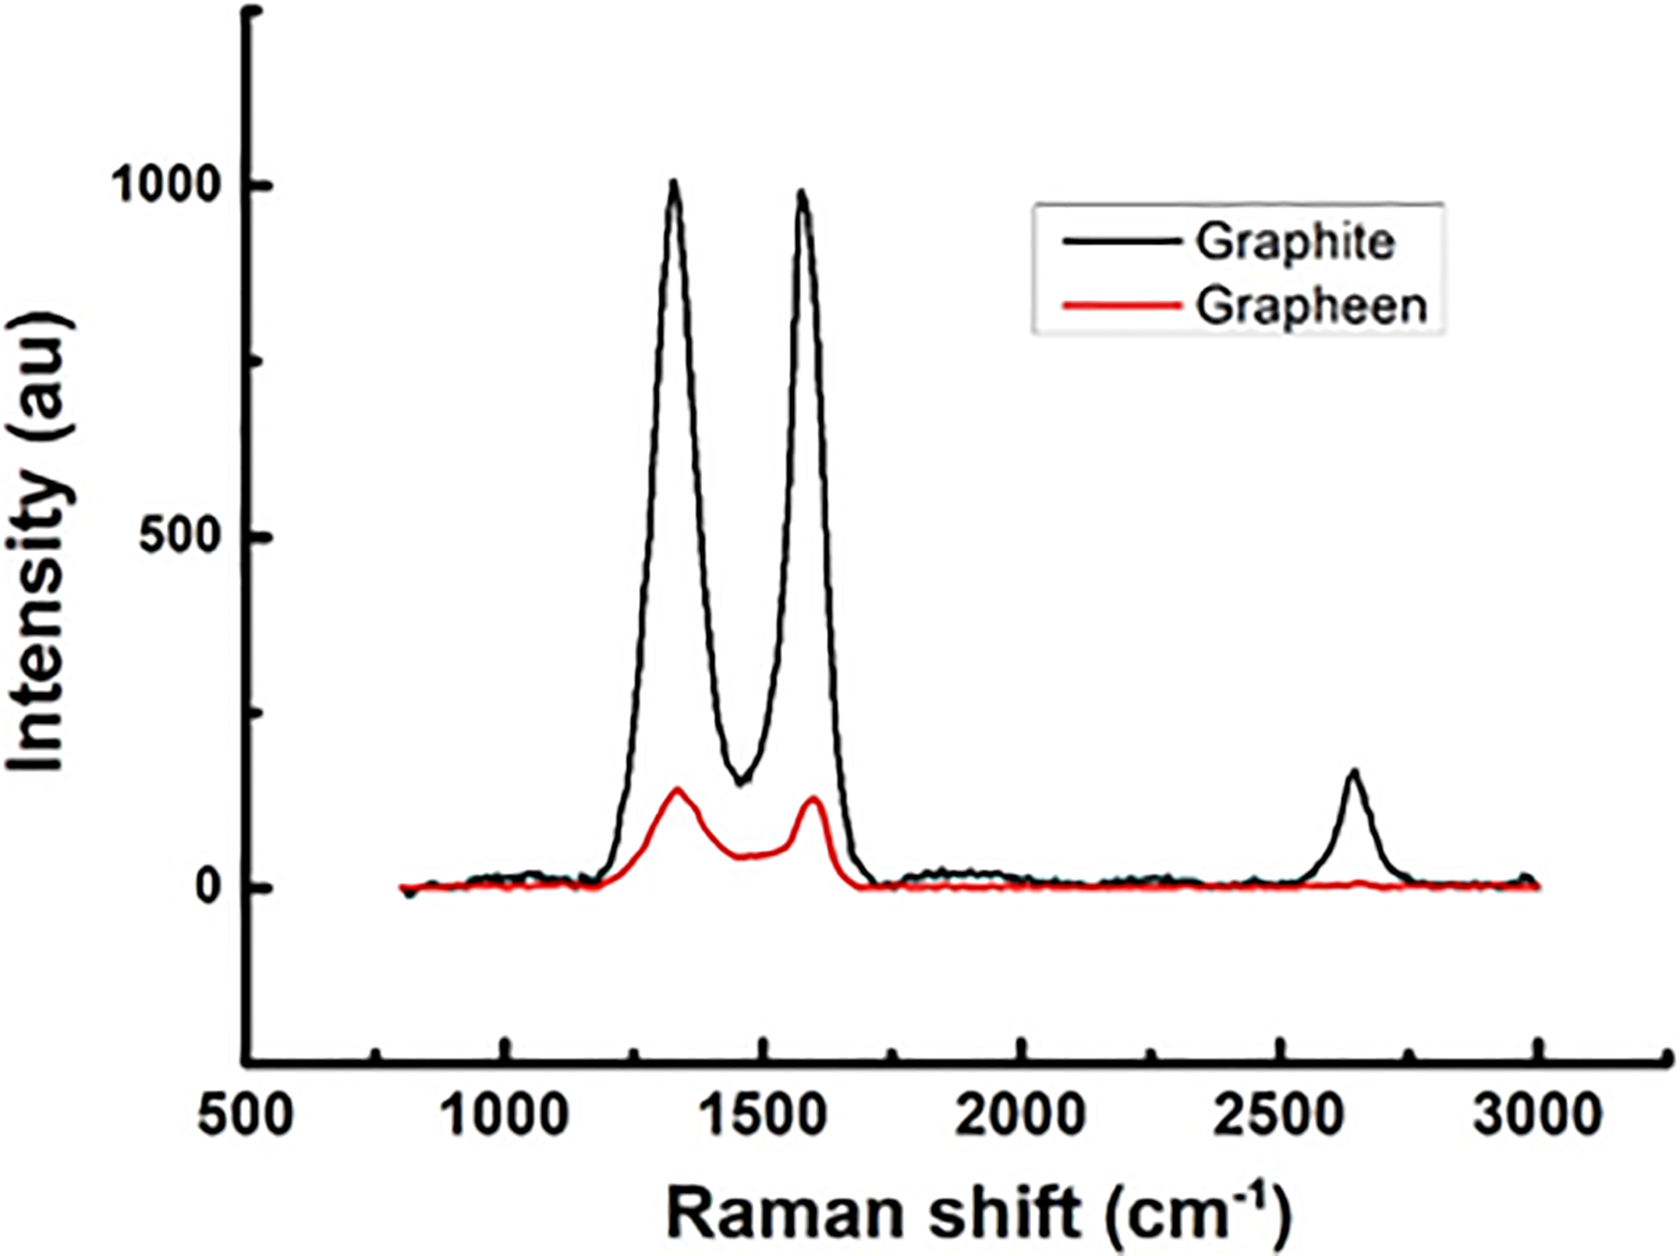
Raman spectroscopy of used graphite and electrochemically exfoliated graphene.
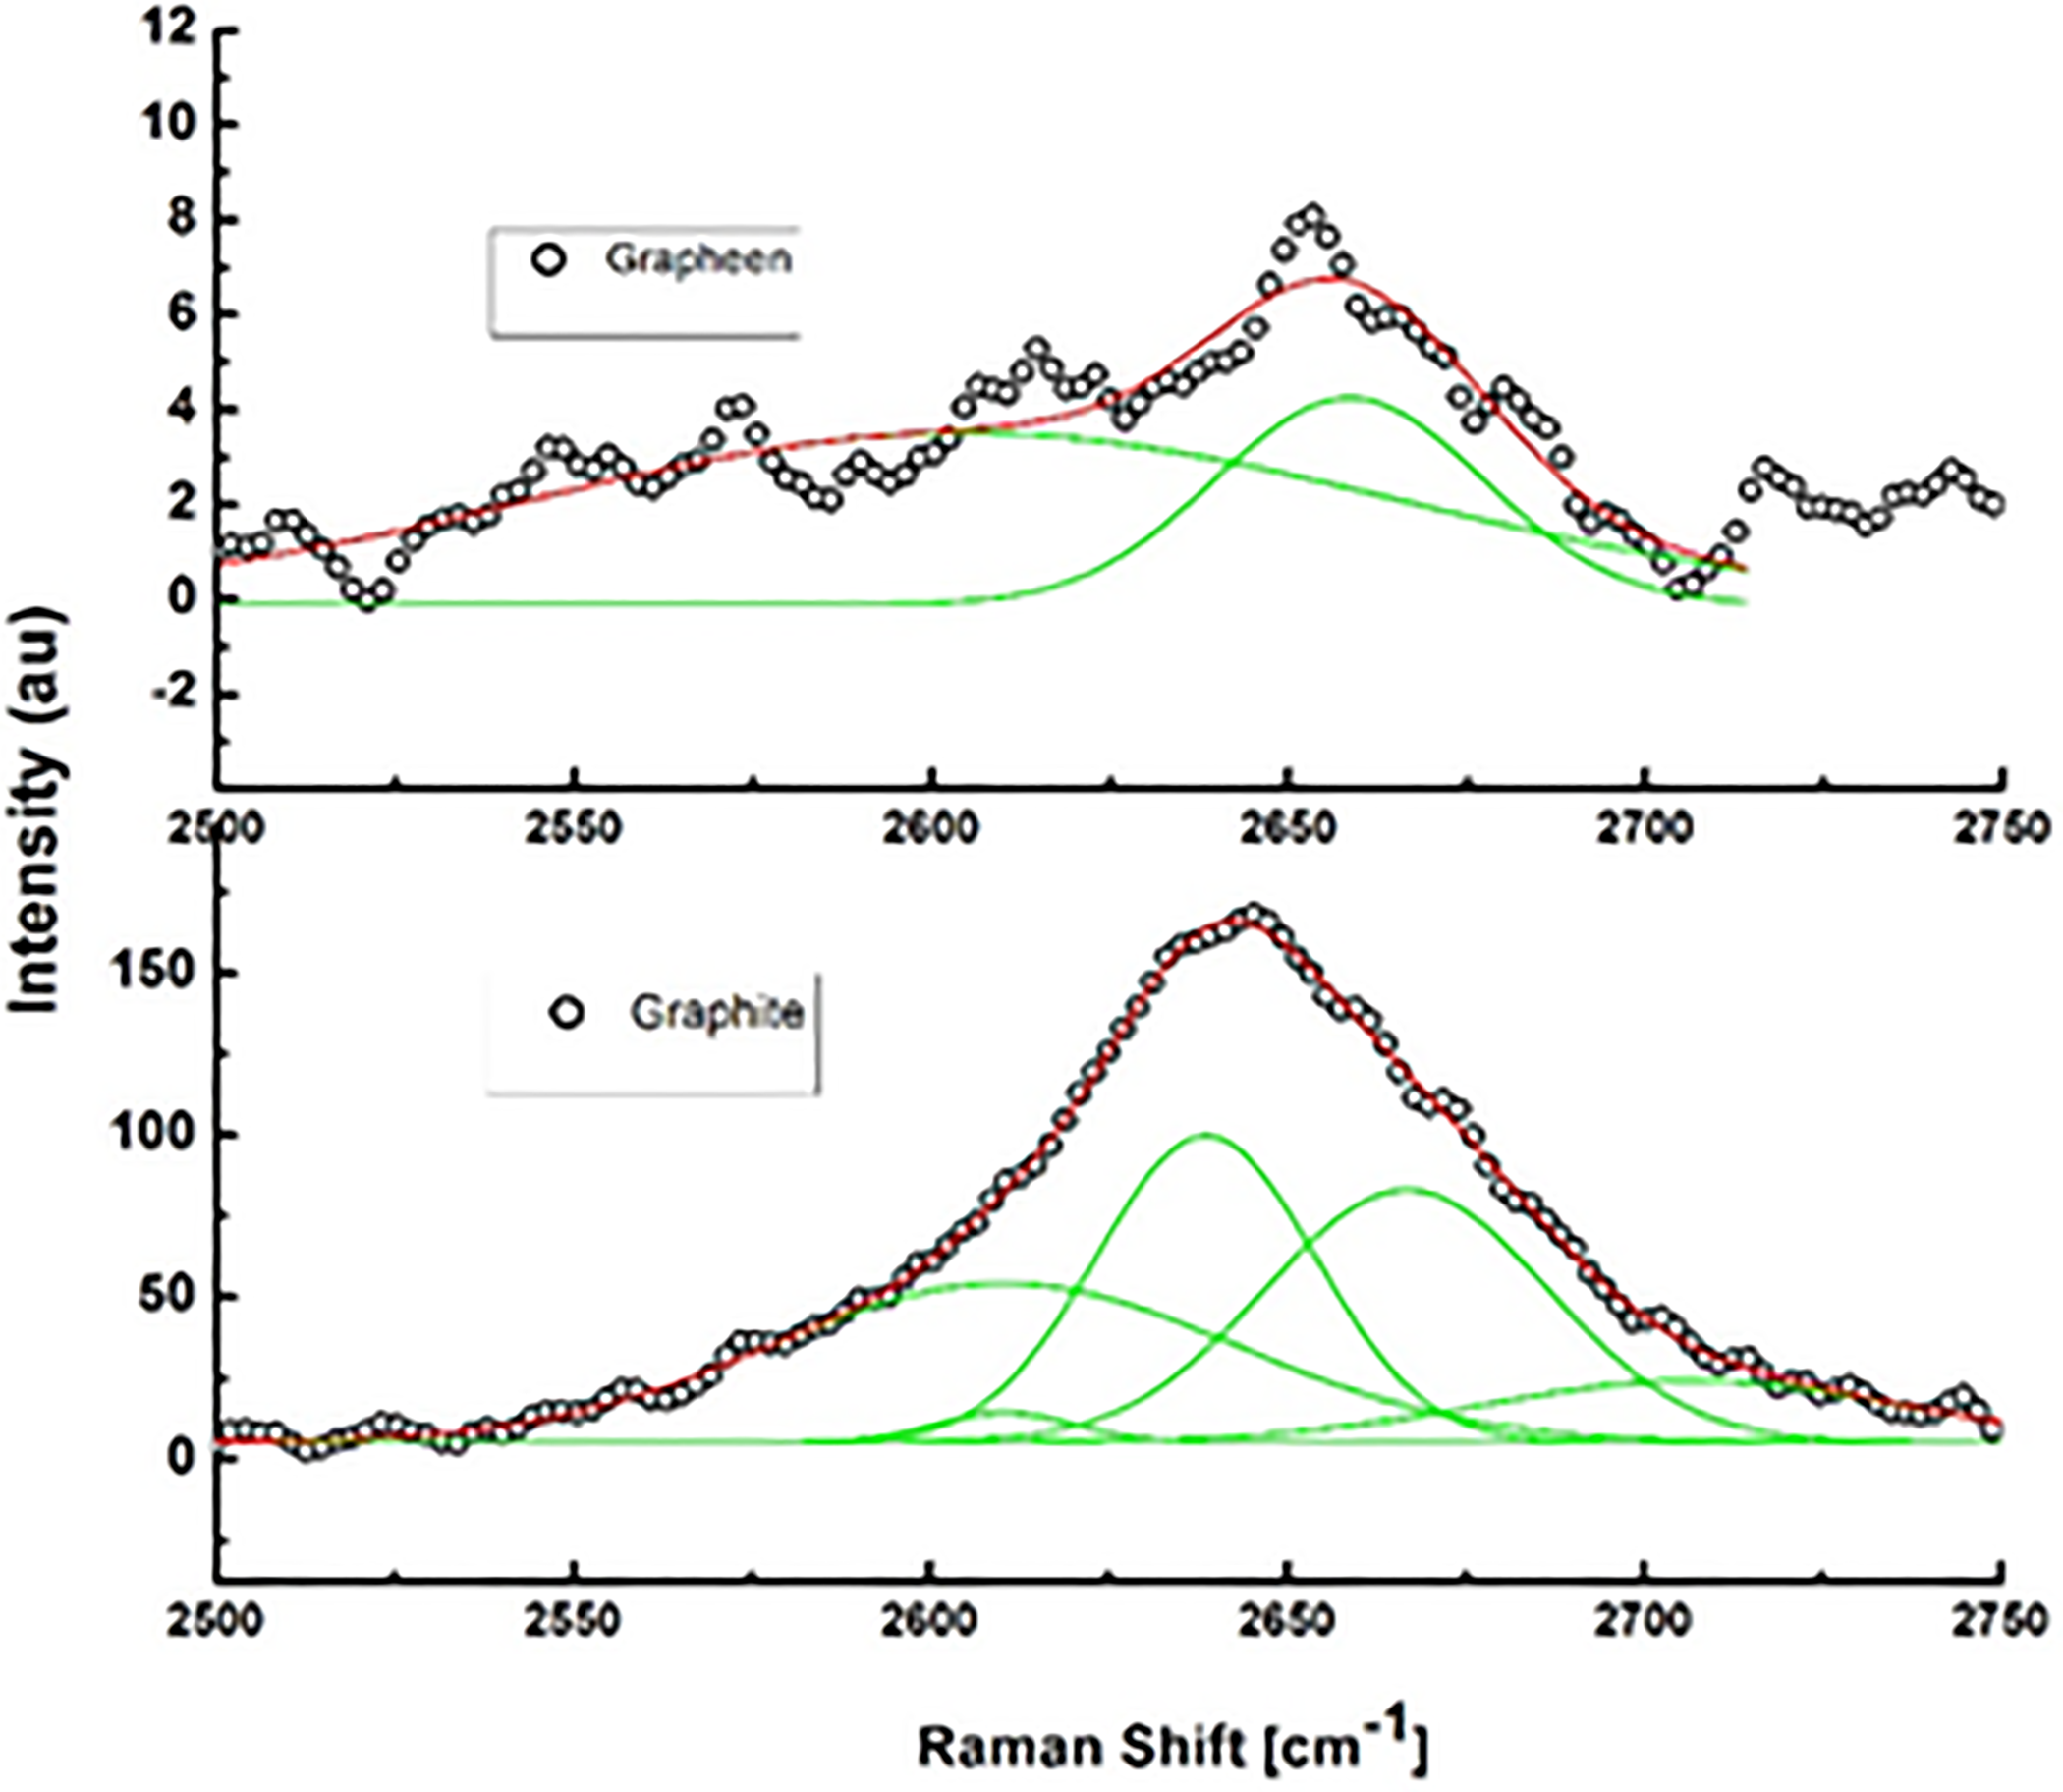
Lorentzian shape of the 2-D peak profile of graphene and graphite.
Figure 5 shows the Raman spectra of graphene/PVA for various durations of electrolysis. One can see the gradual percentage of graphene loading in the PVA composite increases with the increase in exfoliation time. From the bottommost Raman spectrum corresponding to pure PVA, the polymer-related characteristic Raman modes can be observed at frequency bands of 853, 918, 1106, 1360, 1437, and 1740 cm−1. The observed polymer Raman bands can broadly assigned to the assorted atomic vibrations related to C–C stretch, CH stretch, CH2 bend/δ-OH, CC-conjugated/C-sp2, and CO stretch, respectively. 34 Although, with the increase in graphene loading (increase in exfoliation time), the PVA ordering decreases as reflected from the diminished polymeric peaks in the composites’ spectra. However, the alcohol-related CH stretch modes approximately 1106 cm−1 and CO mode can be discernable from the figure in the samples prepared at exfoliation time greater than 30 min. It is important to note that upshift is observed in the pure PVA characteristic mode approximately 1439 cm−1. However, the composite loaded with graphene exfoliated at 5 min shows an upshift by 25 cm−1 indicating the presence of strain in polymer chains. Graphene nanosheets (GNs) exfoliated at small times of 5 and 10 min are expected to be of small concentrations and distributed in the polymer matrix, so their Raman peaks are very small as compared to PVA and cannot be seen in Figure 5. It is interesting to note that, after 30 min of exfoliated graphene loadings, the polymer characteristic mode completely disappear which means a decrease in the crystalline characteristics of the composites.
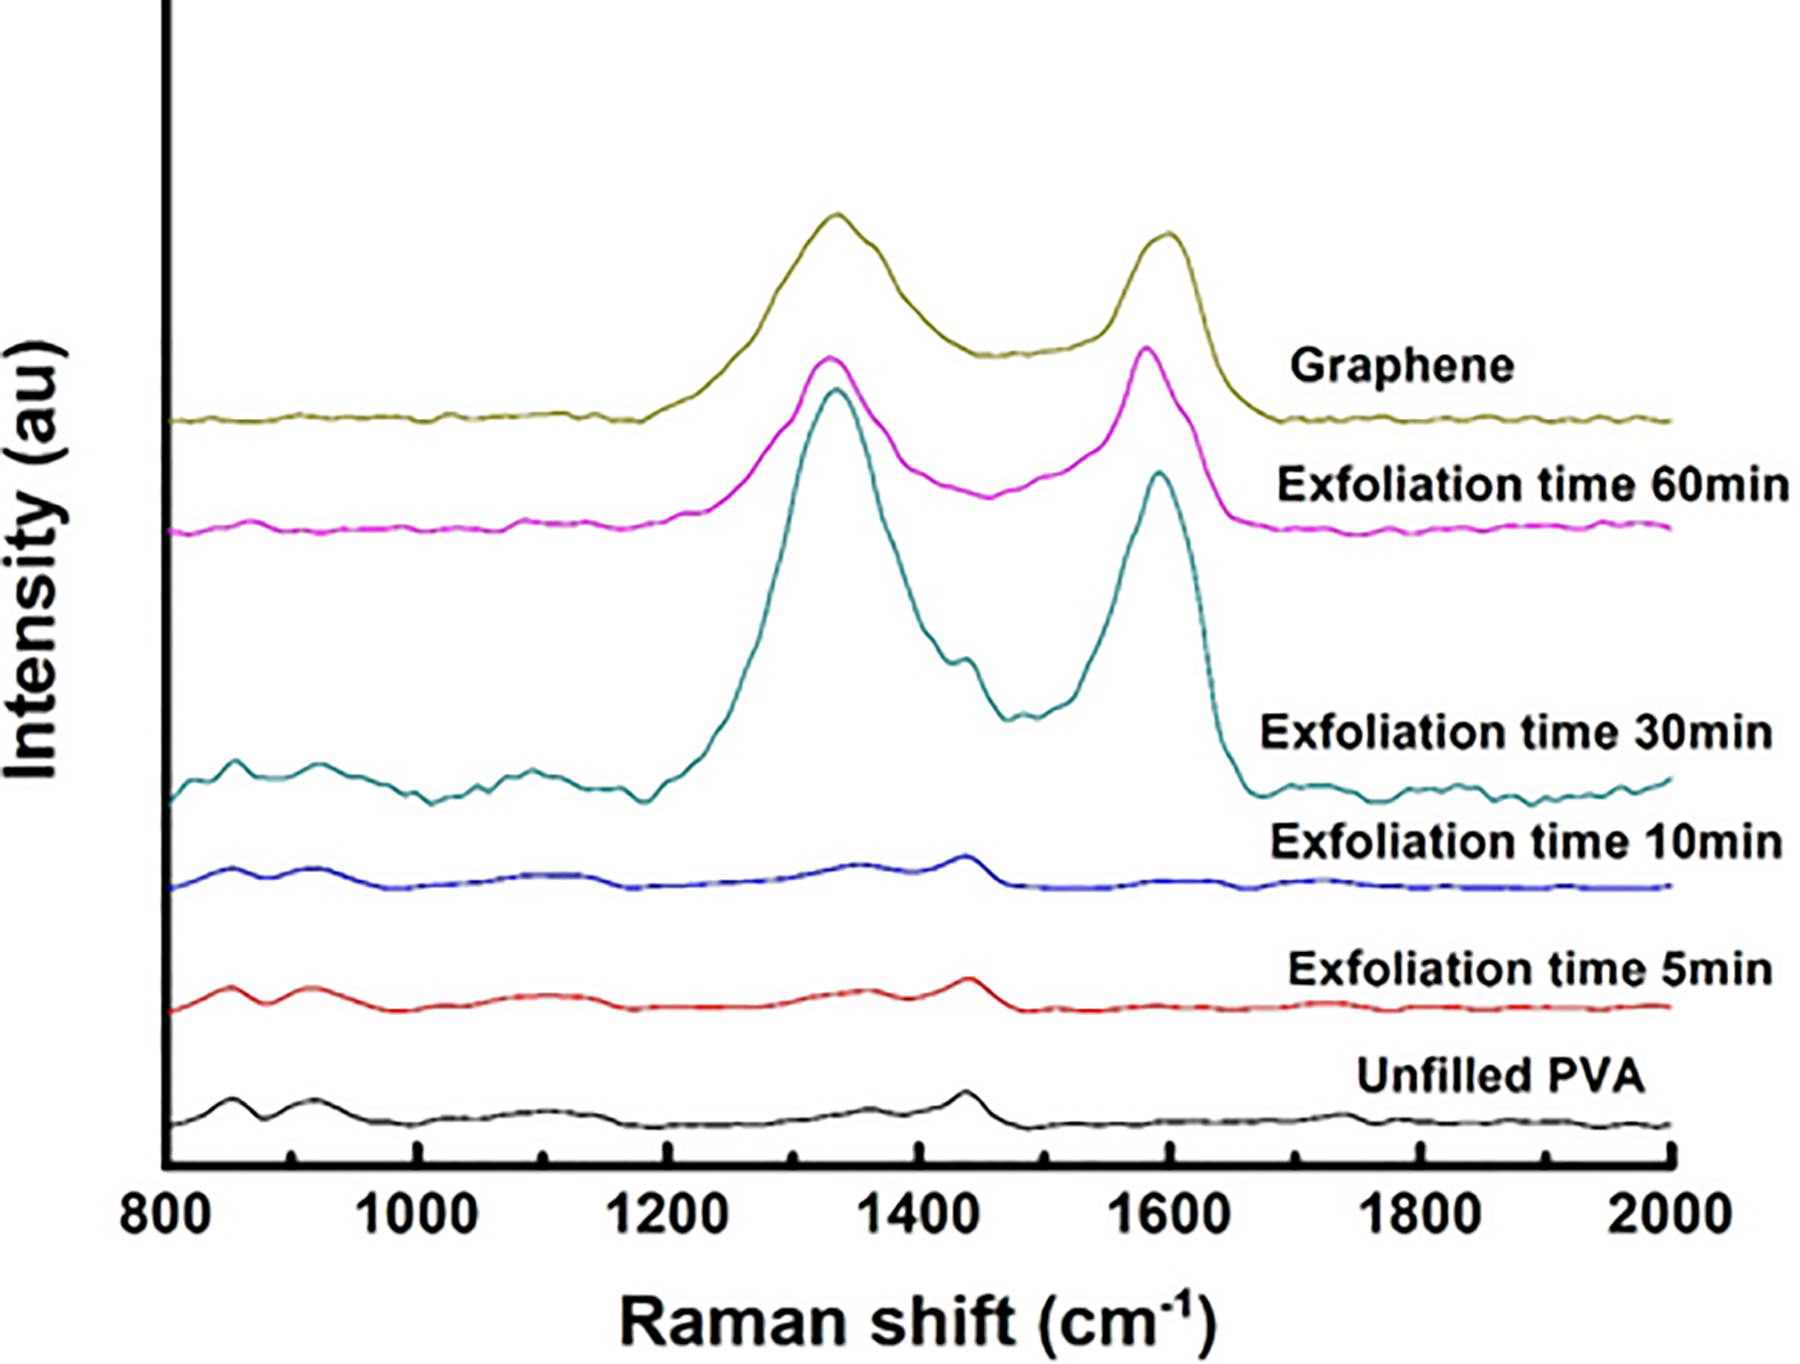
Raman spectroscopy of PVA loaded with electrochemically exfoliated graphene at different periods.
Dielectric properties of PVA loaded with GNs
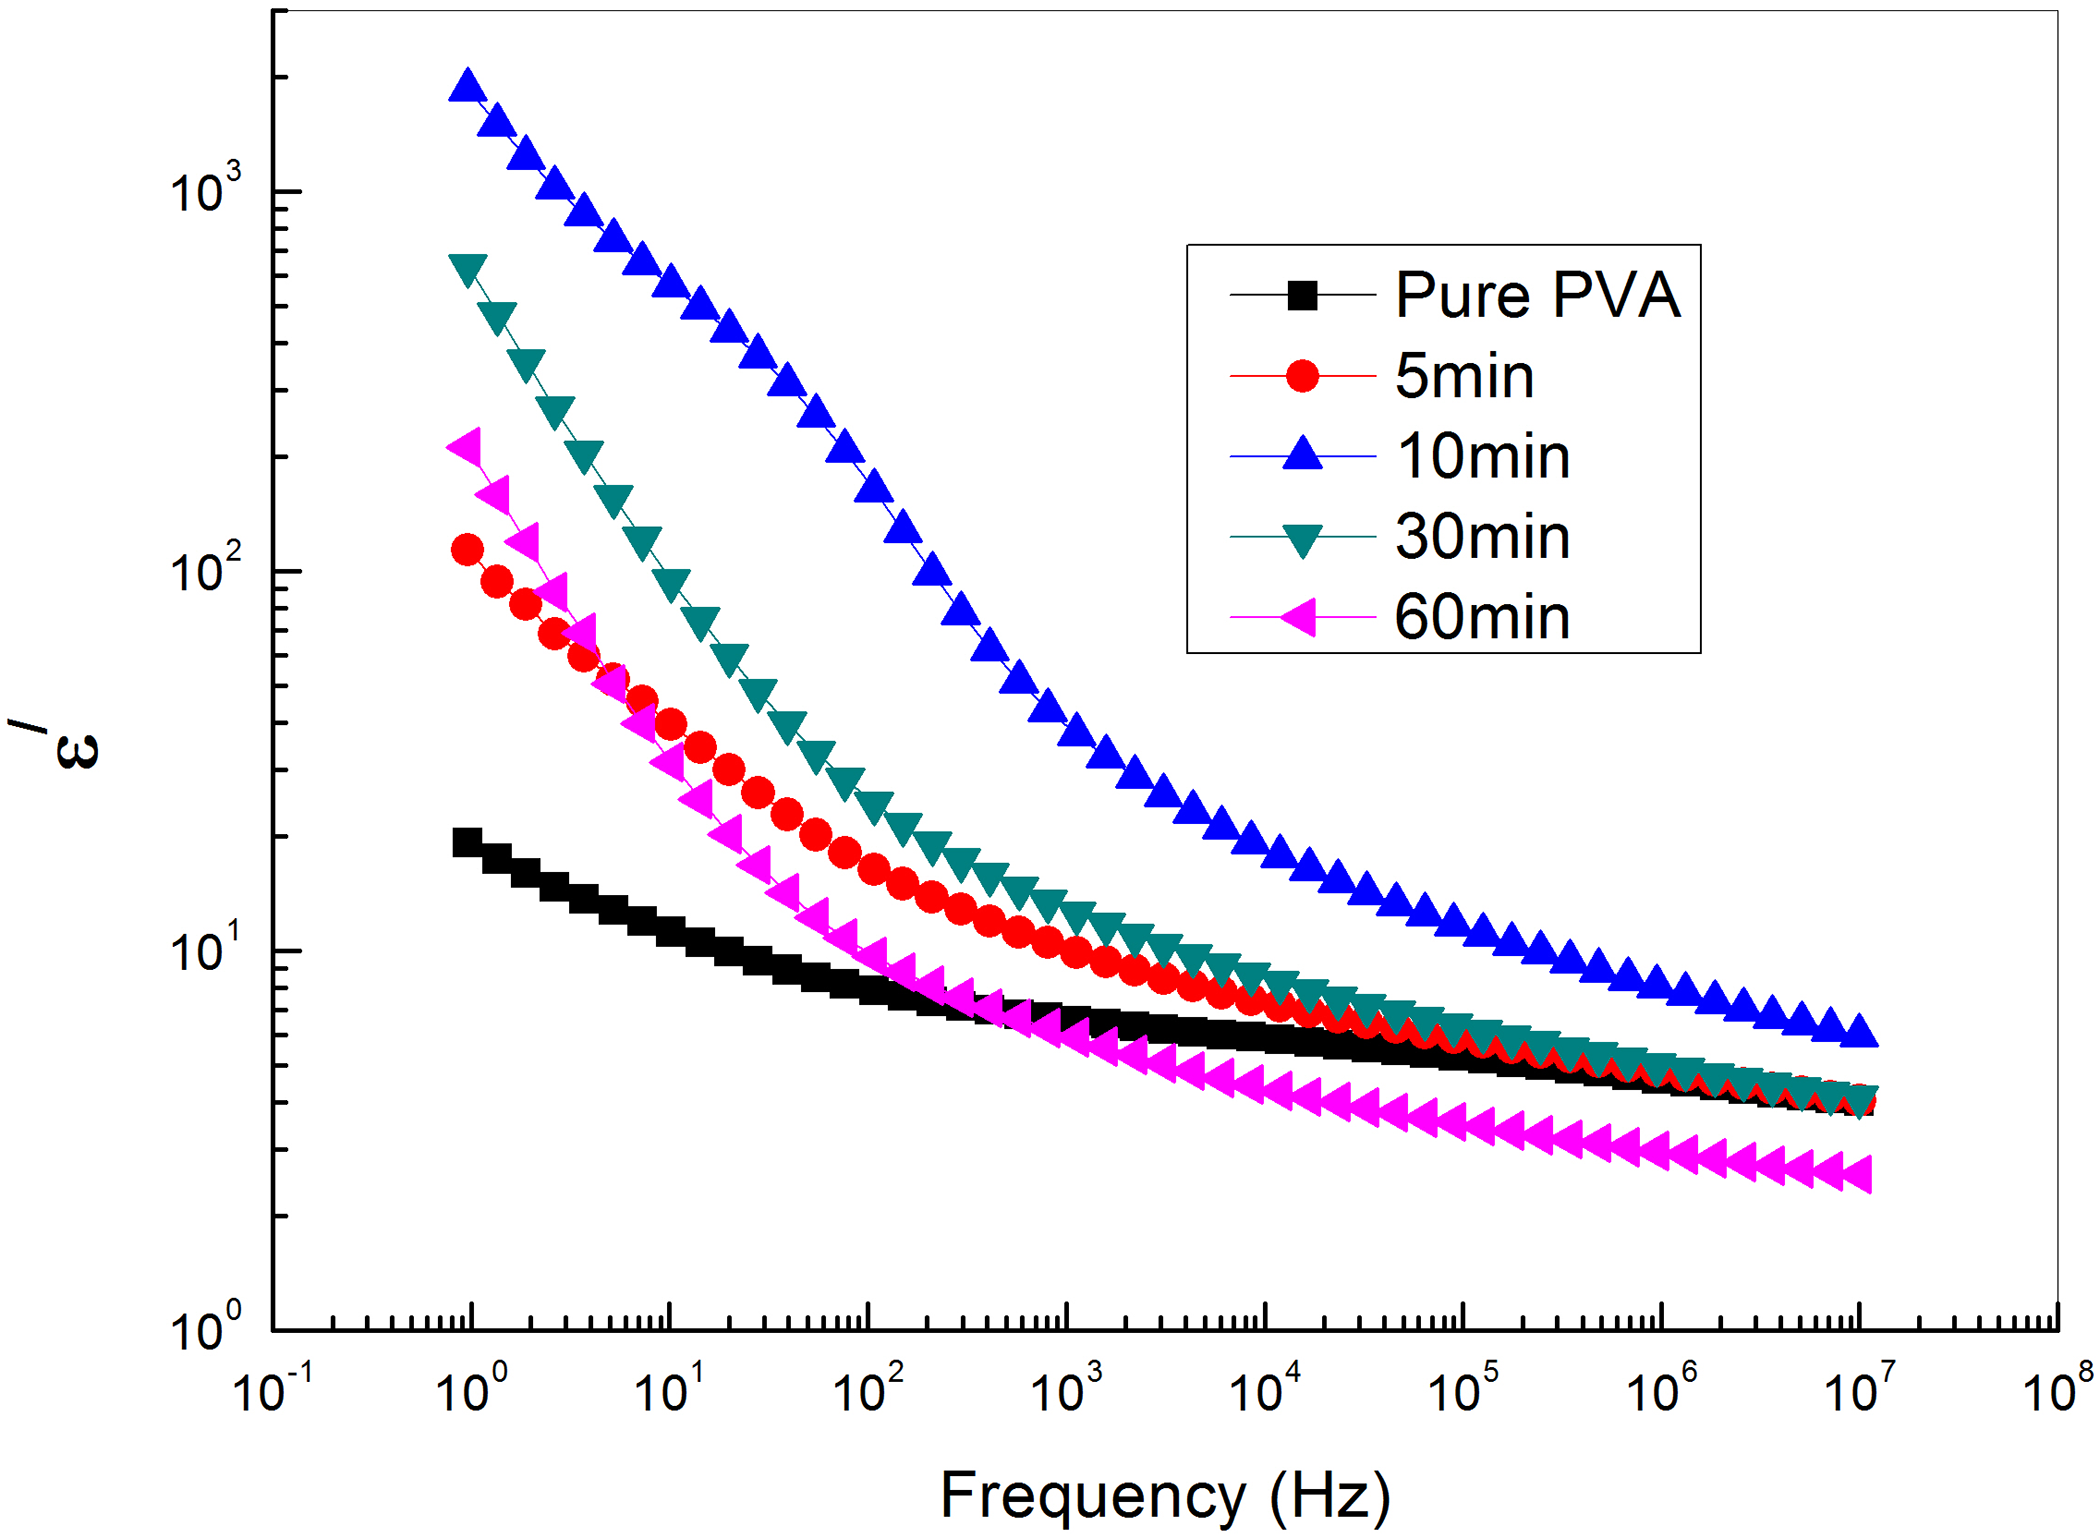
Figure 6 shows the frequency dependence of the dielectric permittivity ε′ of PVA loaded with different concentrations of GNs via exfoliation of graphite for different periods of 0, 5, 10, 30, and 60 min at room temperature. It is observed that the magnitude of ε′ decreases with increasing frequency. The Debye formula giving the complex permittivity related to free dipole oscillating in an alternating field 35 is as follows:

The frequency dependence of electrical permittivity of PVA loaded with graphene exfoliated at different time intervals.
The real art of ε* is given by:

where εs and ε∞ are the low- and high-frequency values of ε′, ω = 2πf, f being the measuring frequency and τ is the relaxation time. At high loading of GNs, the dielectric constant for highest frequencies approaches the dielectric constant for low GNs loadings, while at lower frequencies, there is an increasing contribution to the dielectric constant. A relatively high dielectric constant at low-frequencies phenomenon is a characteristic of a conducting polymer.36,37 At very low frequencies (
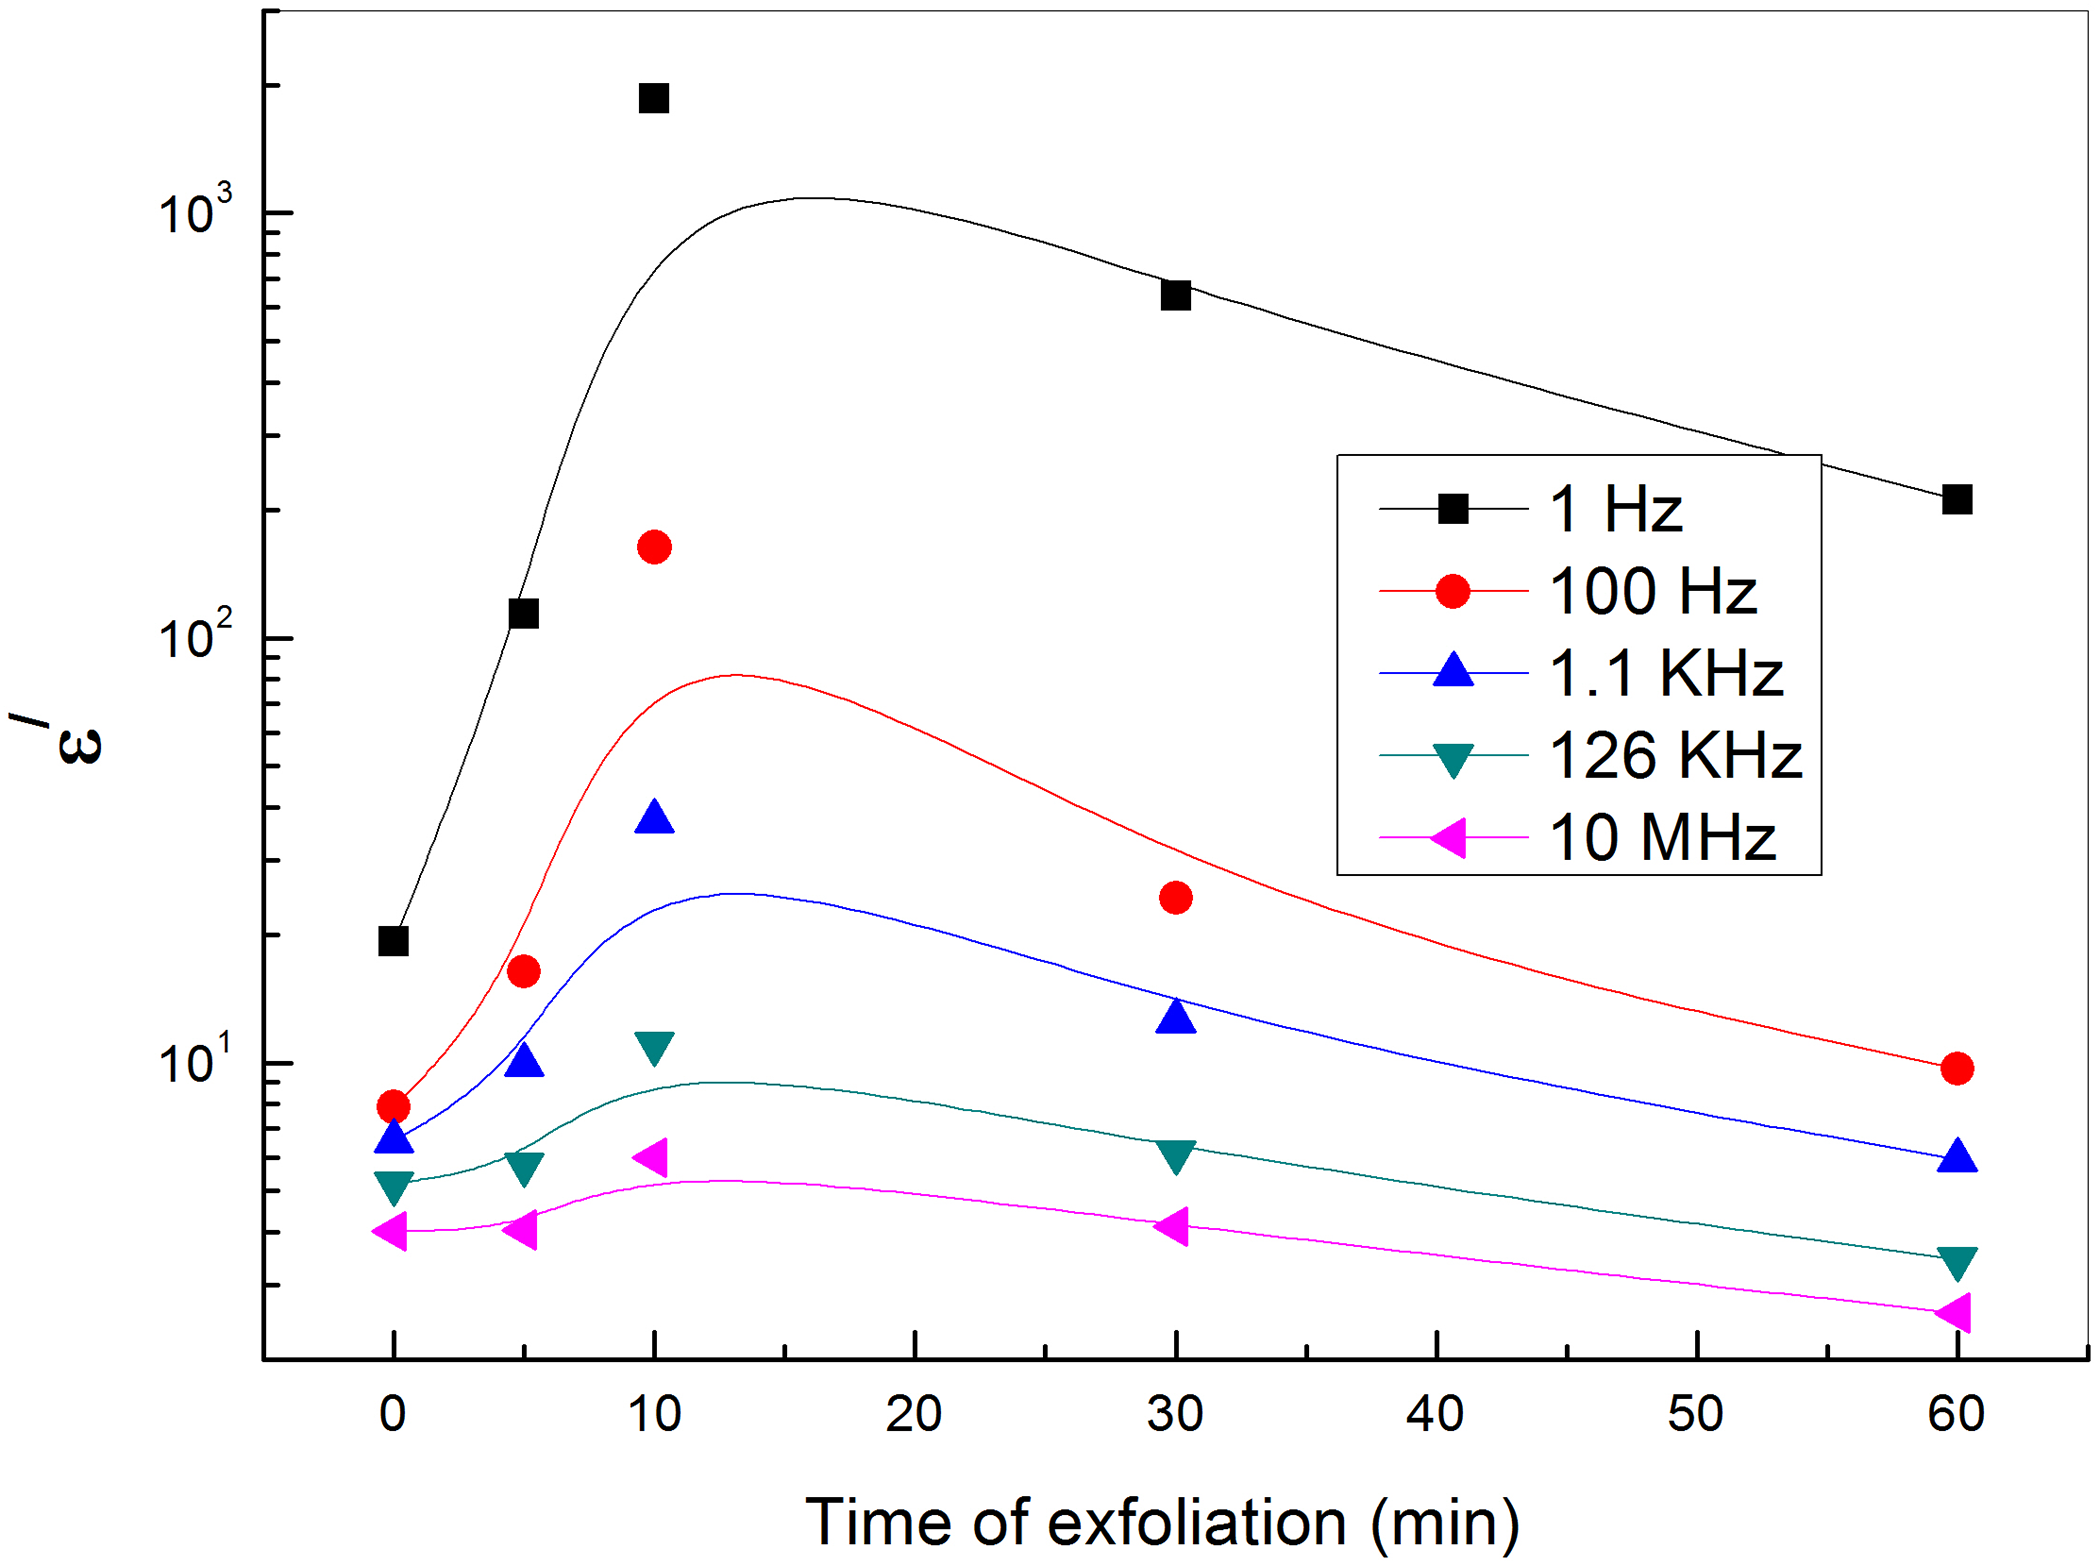
Dependence of the electrical permittivity on the exfoliation time for PVA-loaded graphene at different frequencies.
With regard to a conductor/polymer composite, its dielectric loss mainly consists of the loss of electric conduction and the loss of interfacial polarization. As the volume fraction of the conducting filler increases, the number of conductive paths will increase, leading to increased loss of electric conduction, therefore the dielectric loss of GNs/PVA nanocomposites increases as the content of GNs increases.38–40 On the other hand, at relatively low frequency, the loss of electric conduction makes more contribution to dielectric loss than that of interfacial polarization, so the dielectric loss of composites decreases with the increase of frequency as shown in Figure 8. Figure 9 shows the dependence of the dielectric loss on the time of exfoliation for PVA loaded with different concentrations of GNs at different frequencies and room temperature. The figure shows more losses at low frequencies. The dielectric loss at the low-frequency region becomes very high due to free motion of dipoles within the polymer composites and an increase in the dielectric loss with the increase of GNs (up to 10-min exfoliation time) content is attributed to the increase in polar groups. This increase can be ascribed to the motion of free charge carriers due to the formation of a continuous conductive pathway between and throughout the medium. According to the Maxwell–Wagner–Sillars process, polymer-filler interfacial (like donor–acceptor complexes) is necessary to get changes in dielectric properties. At exfoliation times greater than 10 min, GNs may aggregate in clusters leading to a decrease in interfacial surface area and so decreases the dielectric properties. 41
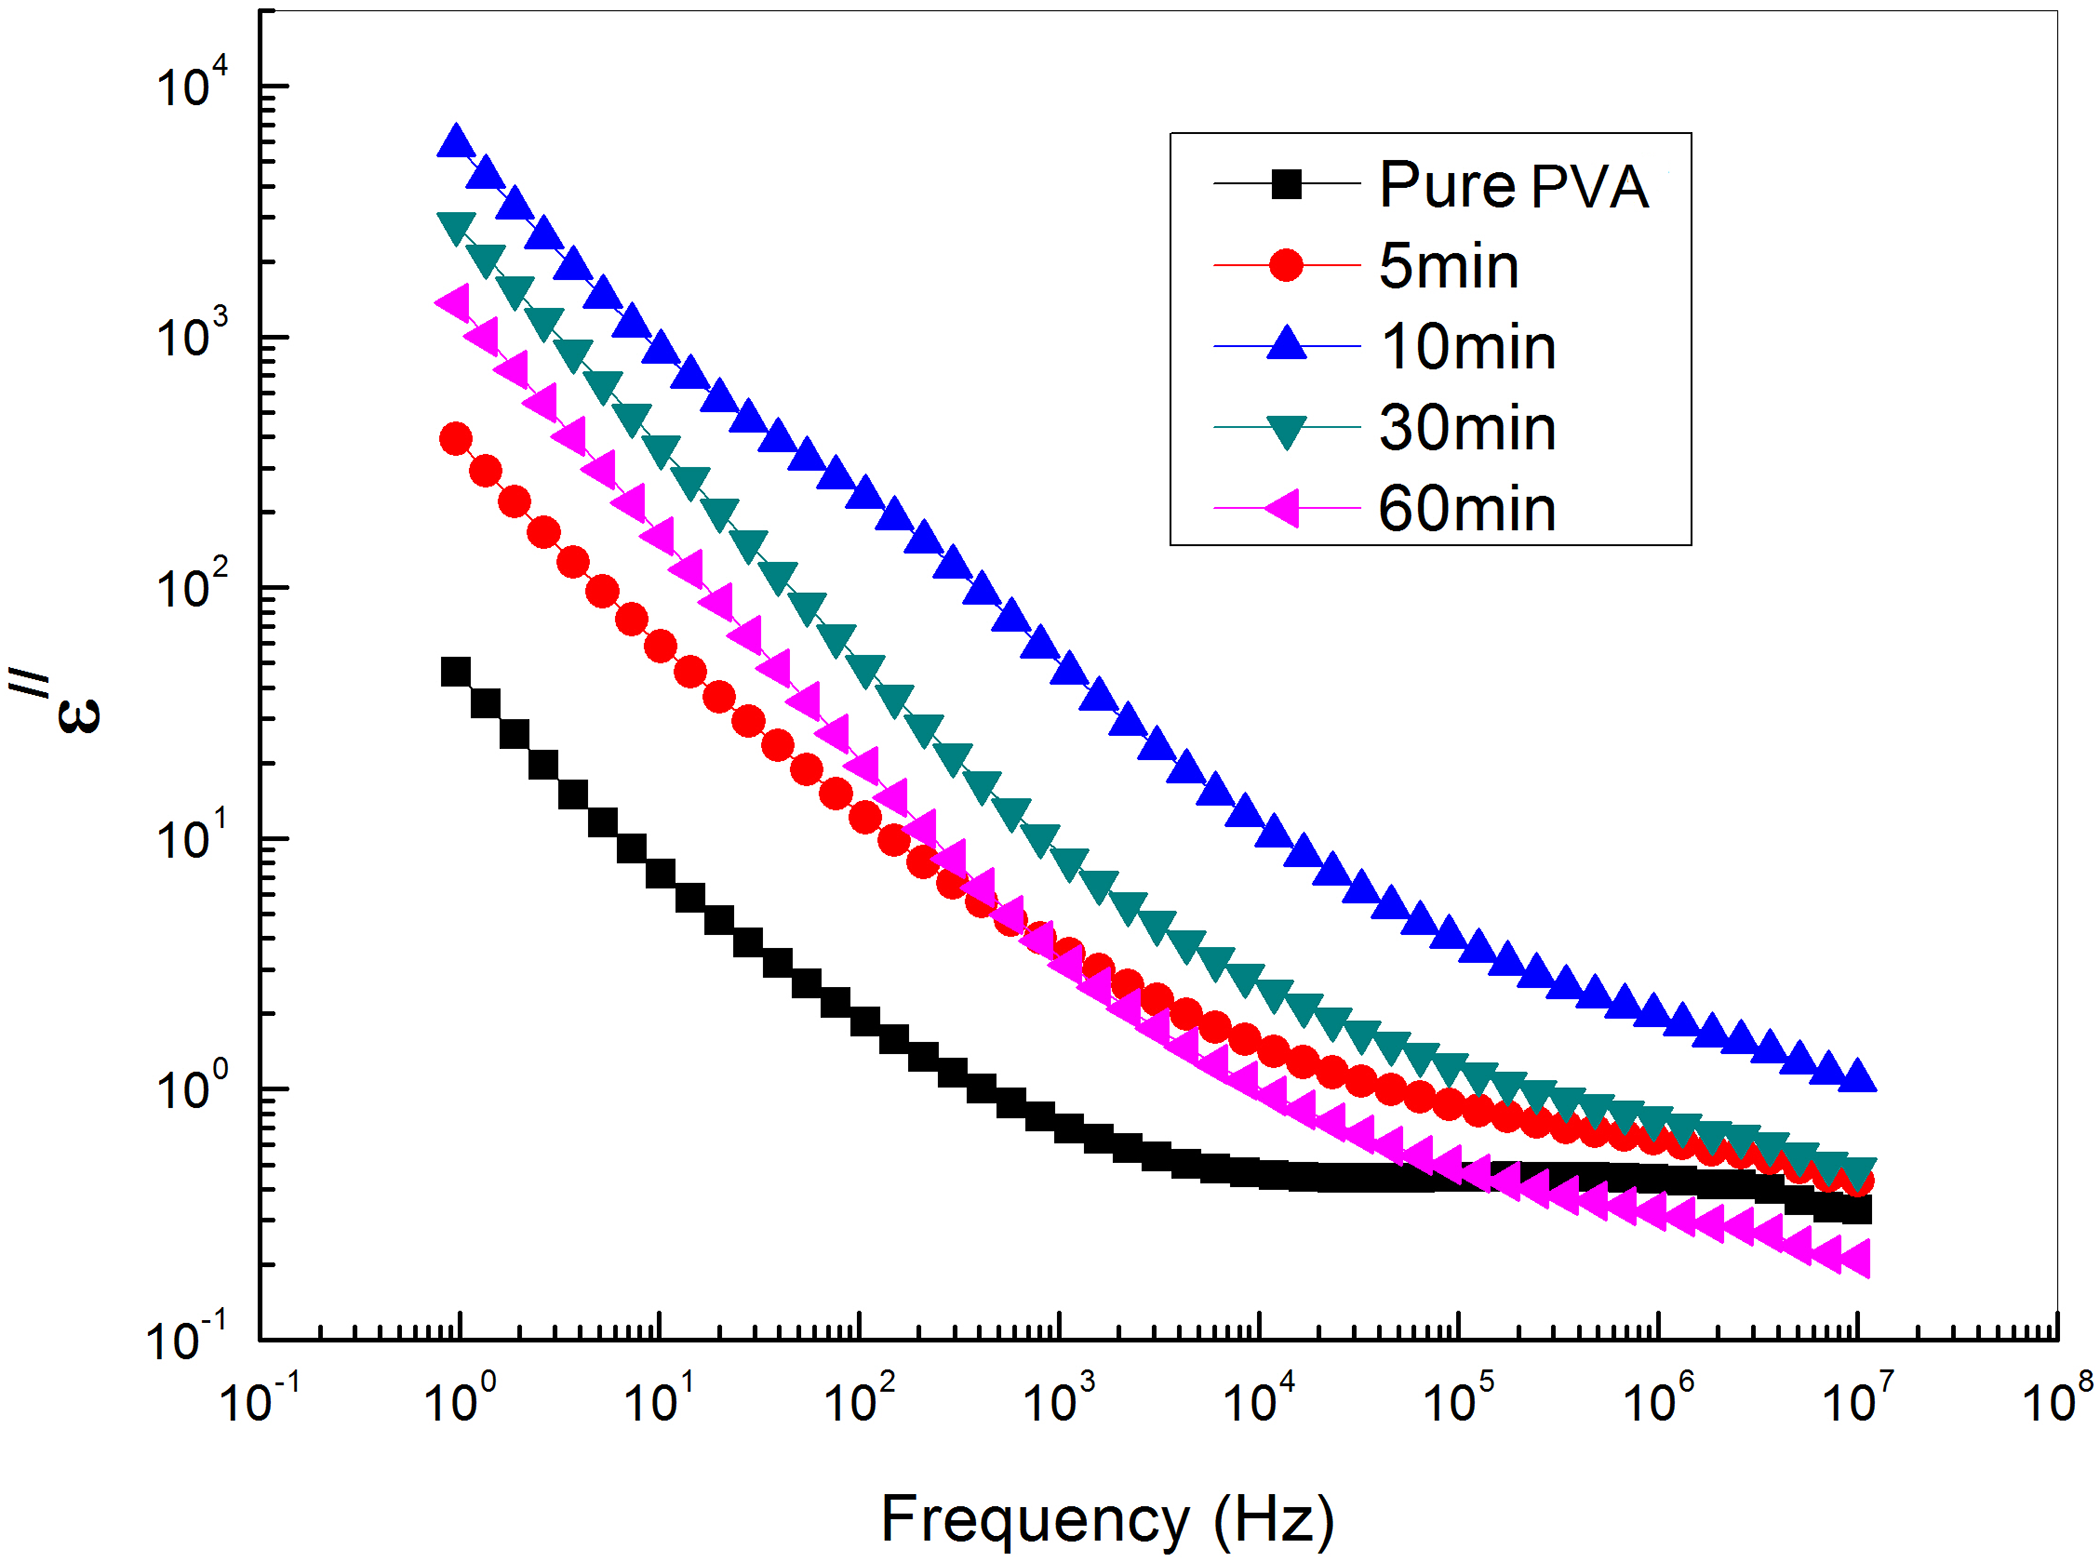
The frequency dependence of dielectric loss of PVA loaded with graphene sheets exfoliated at different time intervals.
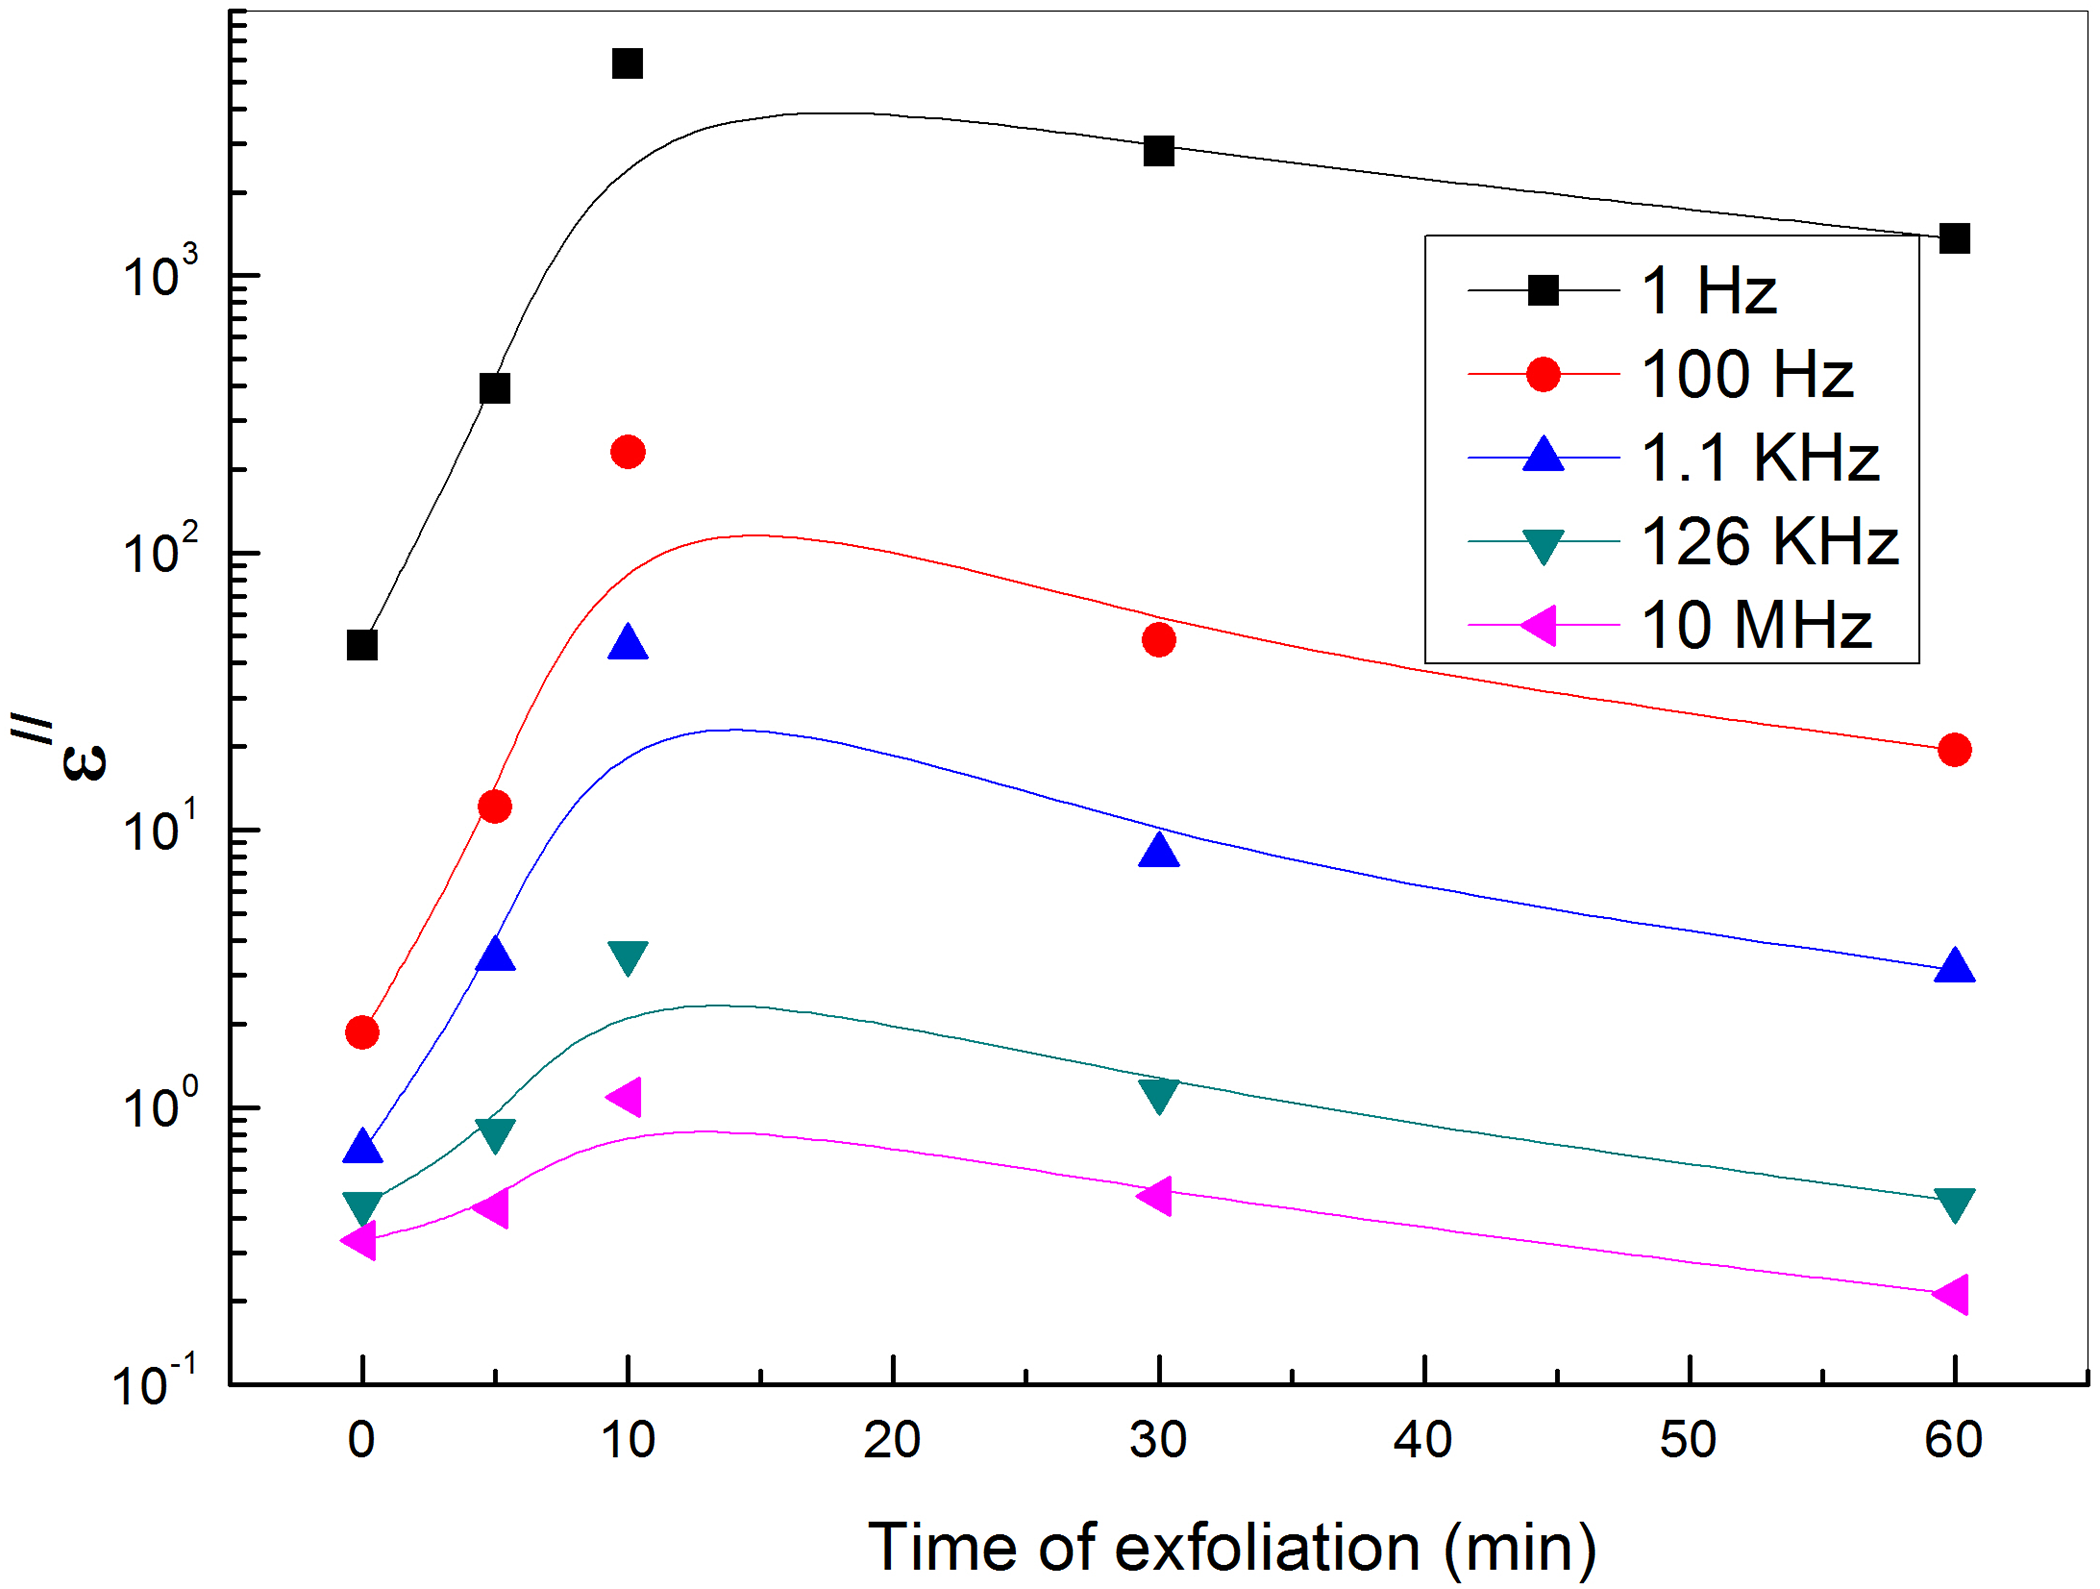
The dependence of the dielectric loss of PVA loaded with graphene sheets on the exfoliation time at different frequencies.
Figure 10 shows the frequency dependence of the alternating electrical conductivity of GNs/PVA at different exfoliation times and at room temperature. It can be observed that the electrical conductivity increase as the frequency increases as well as the time of exfoliation increases to 10 min. With regard to the magnitude of the conductivity, it is closely related with the content of GNs in corresponding composite.
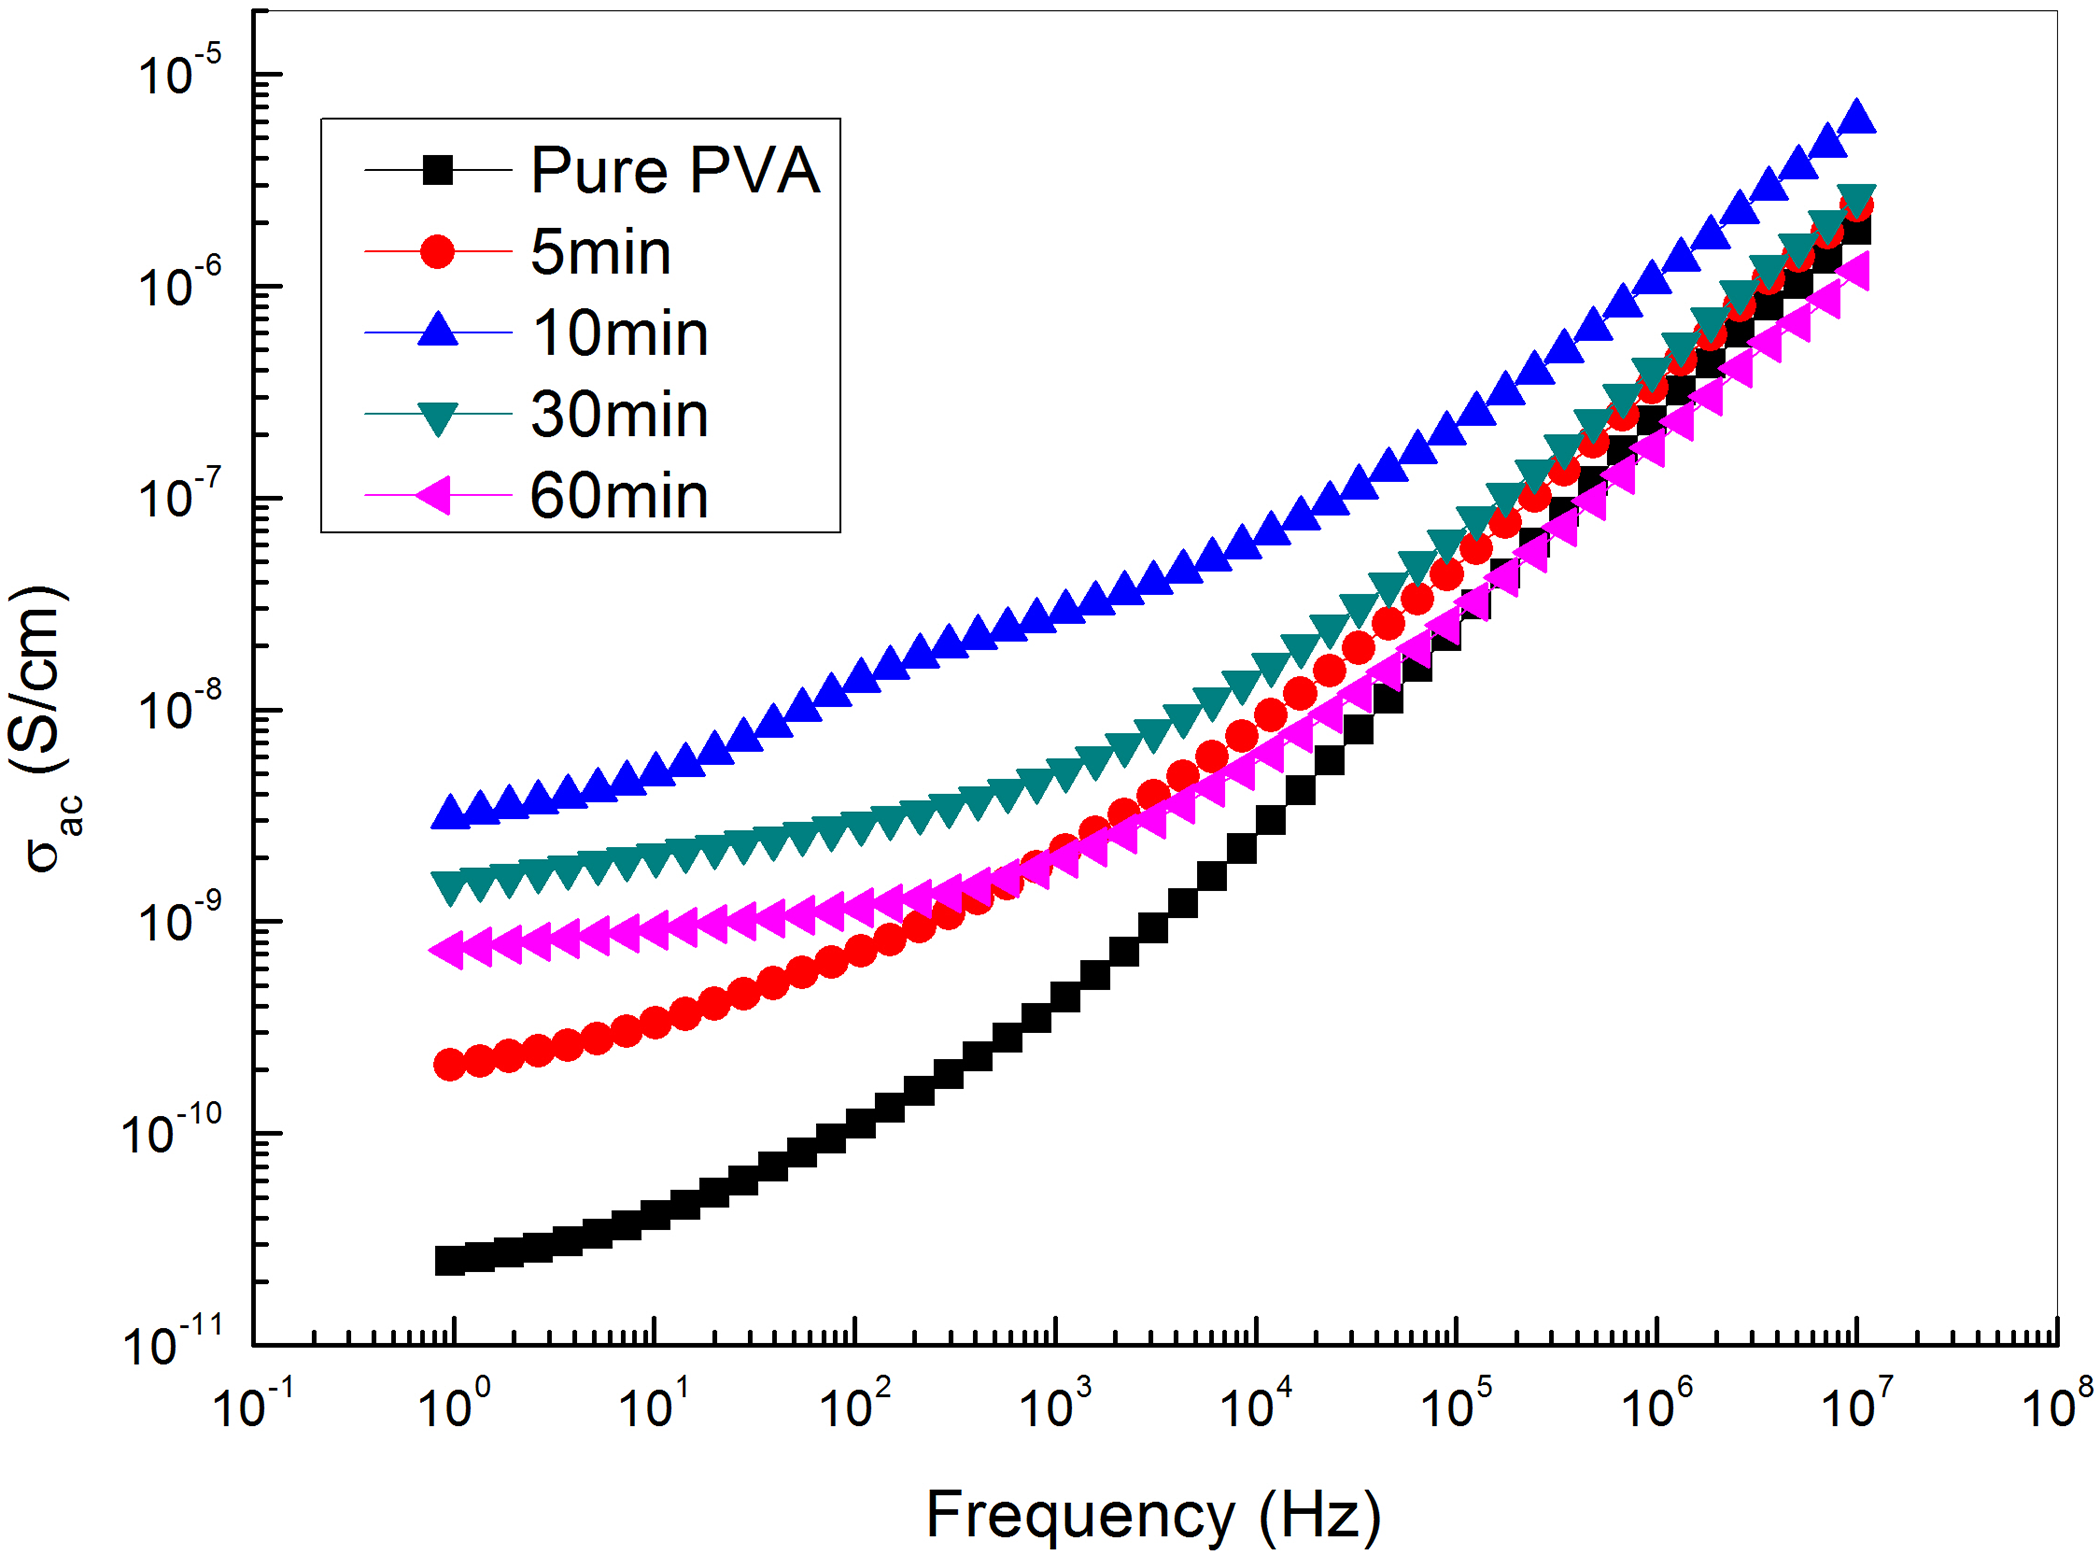
The frequency dependence of the AC electrical conductivity of PVA loaded with graphene sheets exfoliated at different times.
It is known that there are two mechanisms of electrical conduction 42 ; one is that the conductors in composites connect with each other to form conductive routes, and the obtained current is called as a leakage current. The other is that the conductors in composites do not connect with each other, but their distances are so small that the electrons can be transmitted through electron tunnels formed among conductors nearby, and the resultant current is named as a tunneling current. Generally, leakage current makes more contribution to conductivity than tunneling current. Therefore, the conductive mechanism of the composites is closely related to both the dispersion and the content of conductors as well as its purity. Specifically, when the content of GNs is very small, that is, the content of GNs is not sufficient to form the connecting networks. Hence, their conductive mechanism is tunneling currents. As the amount of GNs exceeds certain amount corresponding to exfoliation time greater than 10 min, defects in graphene sheets detected from Raman spectroscopy may resist the conduction between the conduction routes, which appear as a decrease in the electrical conductivity as shown in Figure 11. Moreover, exfoliation times greater than 10 min cause GNs to aggregate leading to a decrease in interaction surface area with polymer chains which is reflected as a decrease in the electrical properties and this will be discussed in details in the last paragraph after discussing the tensile properties.
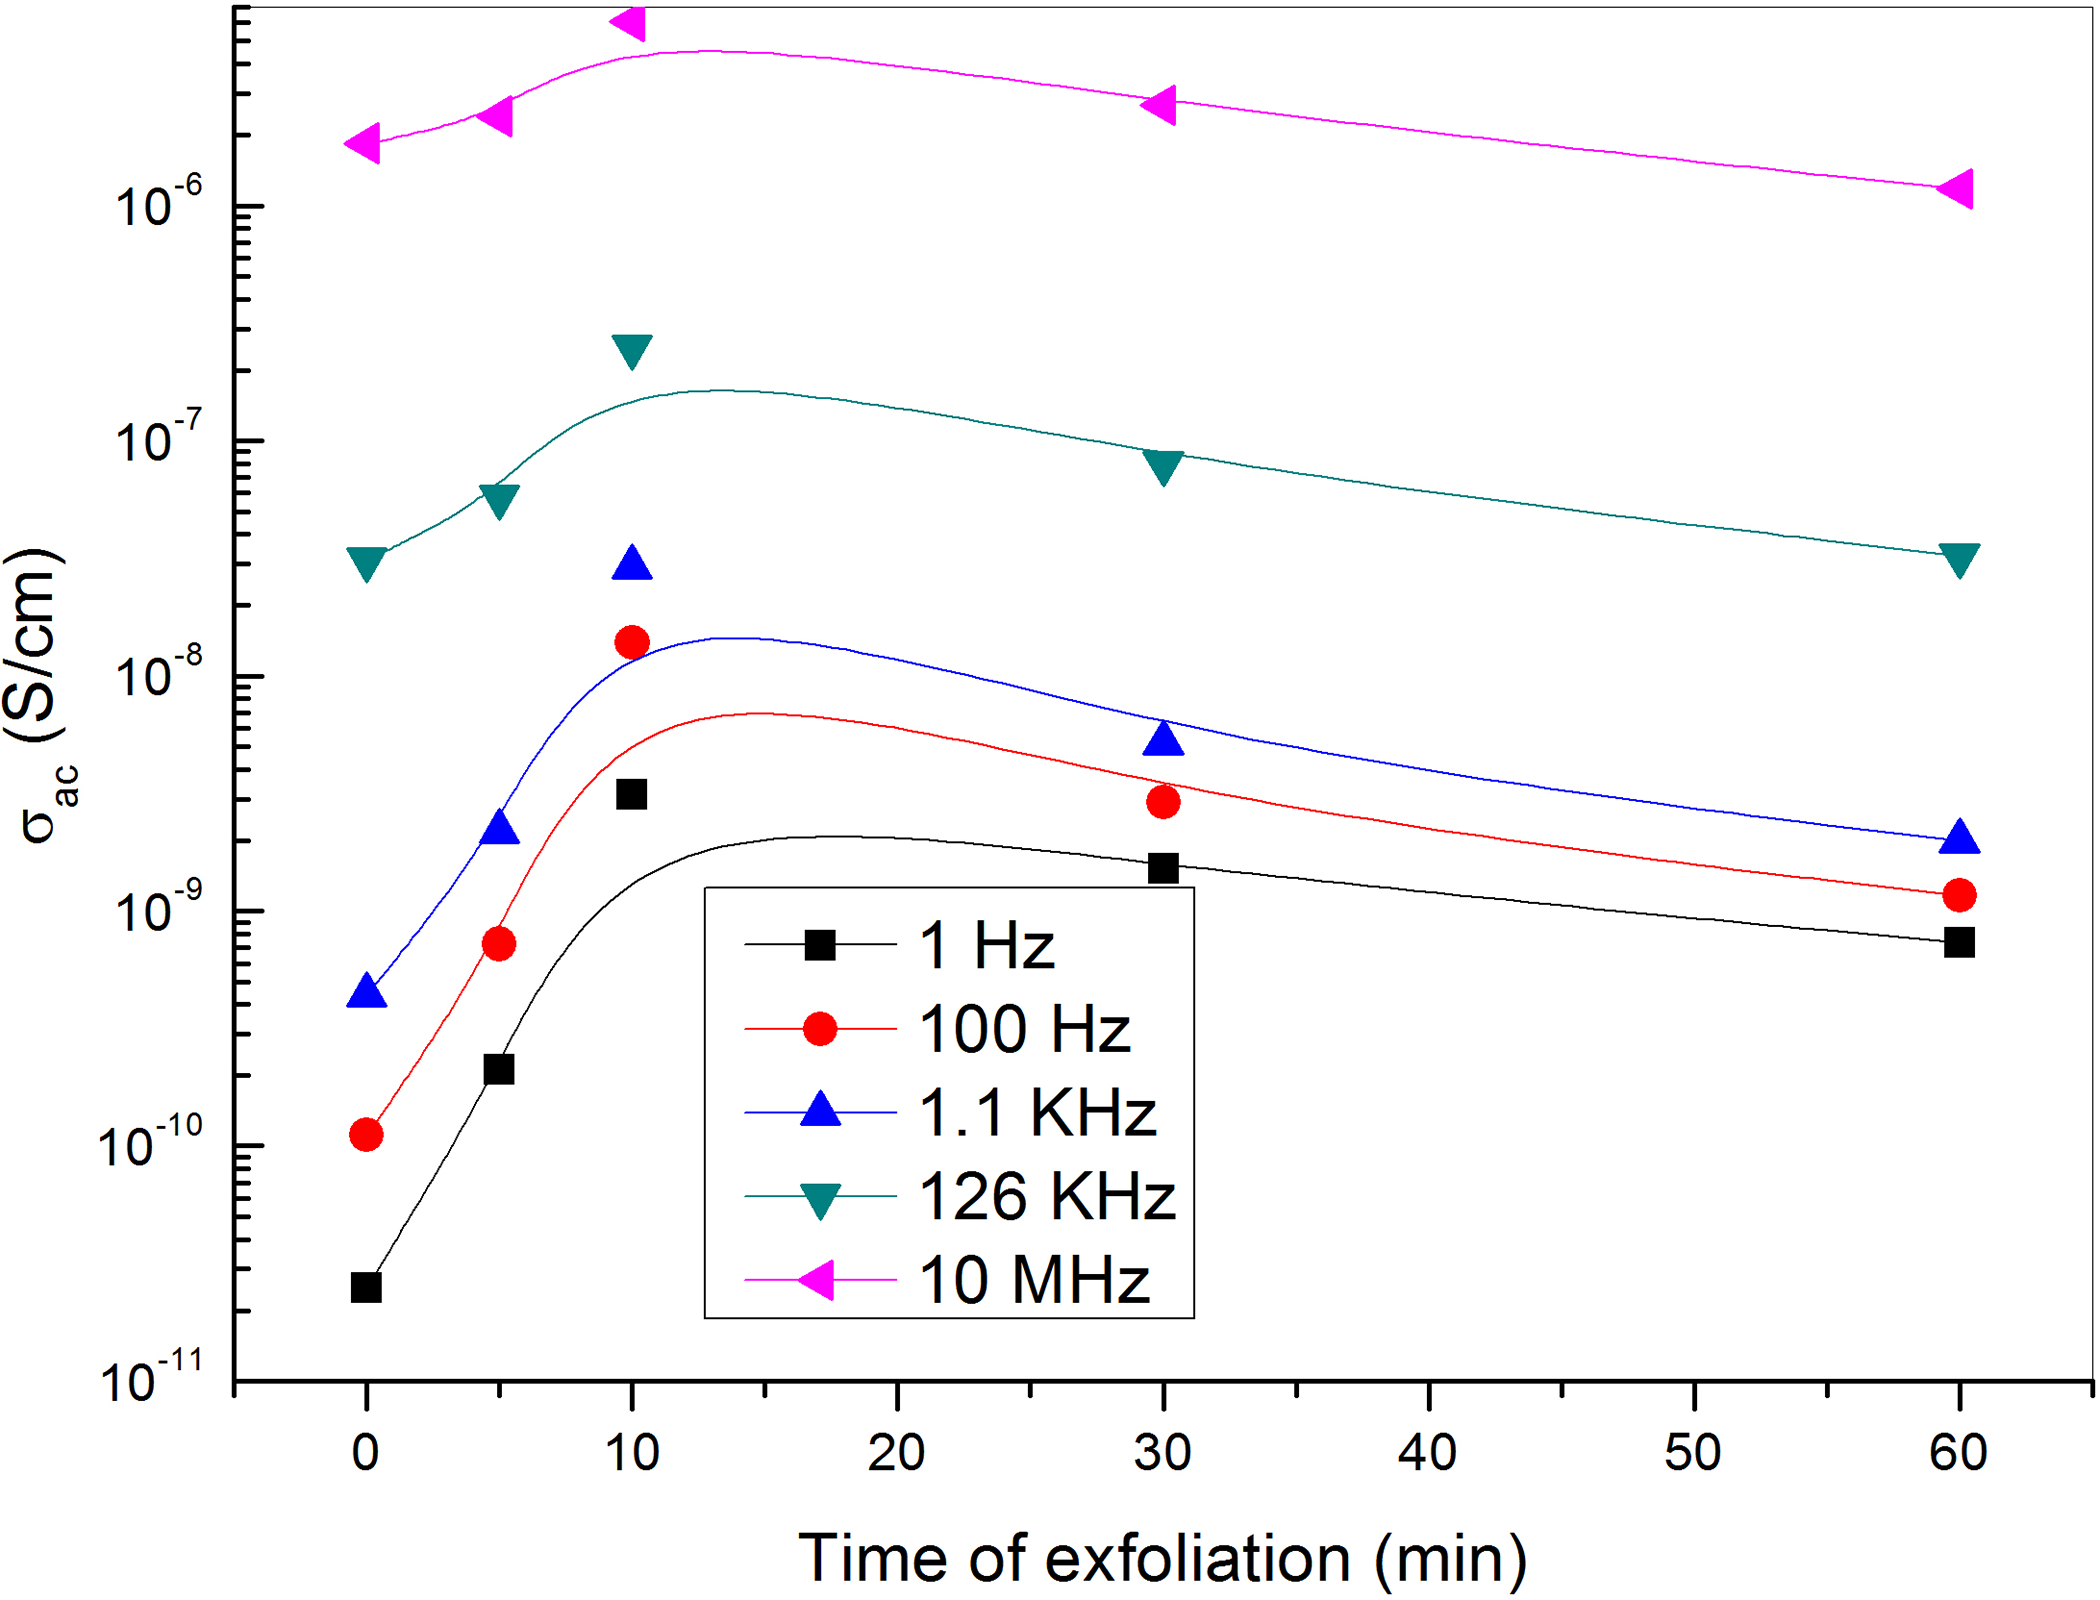
The dependence of the AC electrical conductivity of PVA-loaded graphene on the exfoliation time at different frequencies.
Figure 12 represents the impedance Z Cole–Cole plot of PVA loaded with graphene sheets exfoliated at different times and at room temperature. The Cole–Cole Z plot consists of a high-frequency semicircle represented by a bulk resistor connected in parallel with a frequency-dependent capacitor and a low-frequency spike represented by a constant phase element. In this case, the motion of ions may occur through the polymer matrix free volume, which can be represented by a resistor. Capacitors represent the polarized immobile polymer chains in the alternating field. The ionic motion and polymer chains bulk polarization are in parallel and therefore the semicircle at high frequency can be observed.
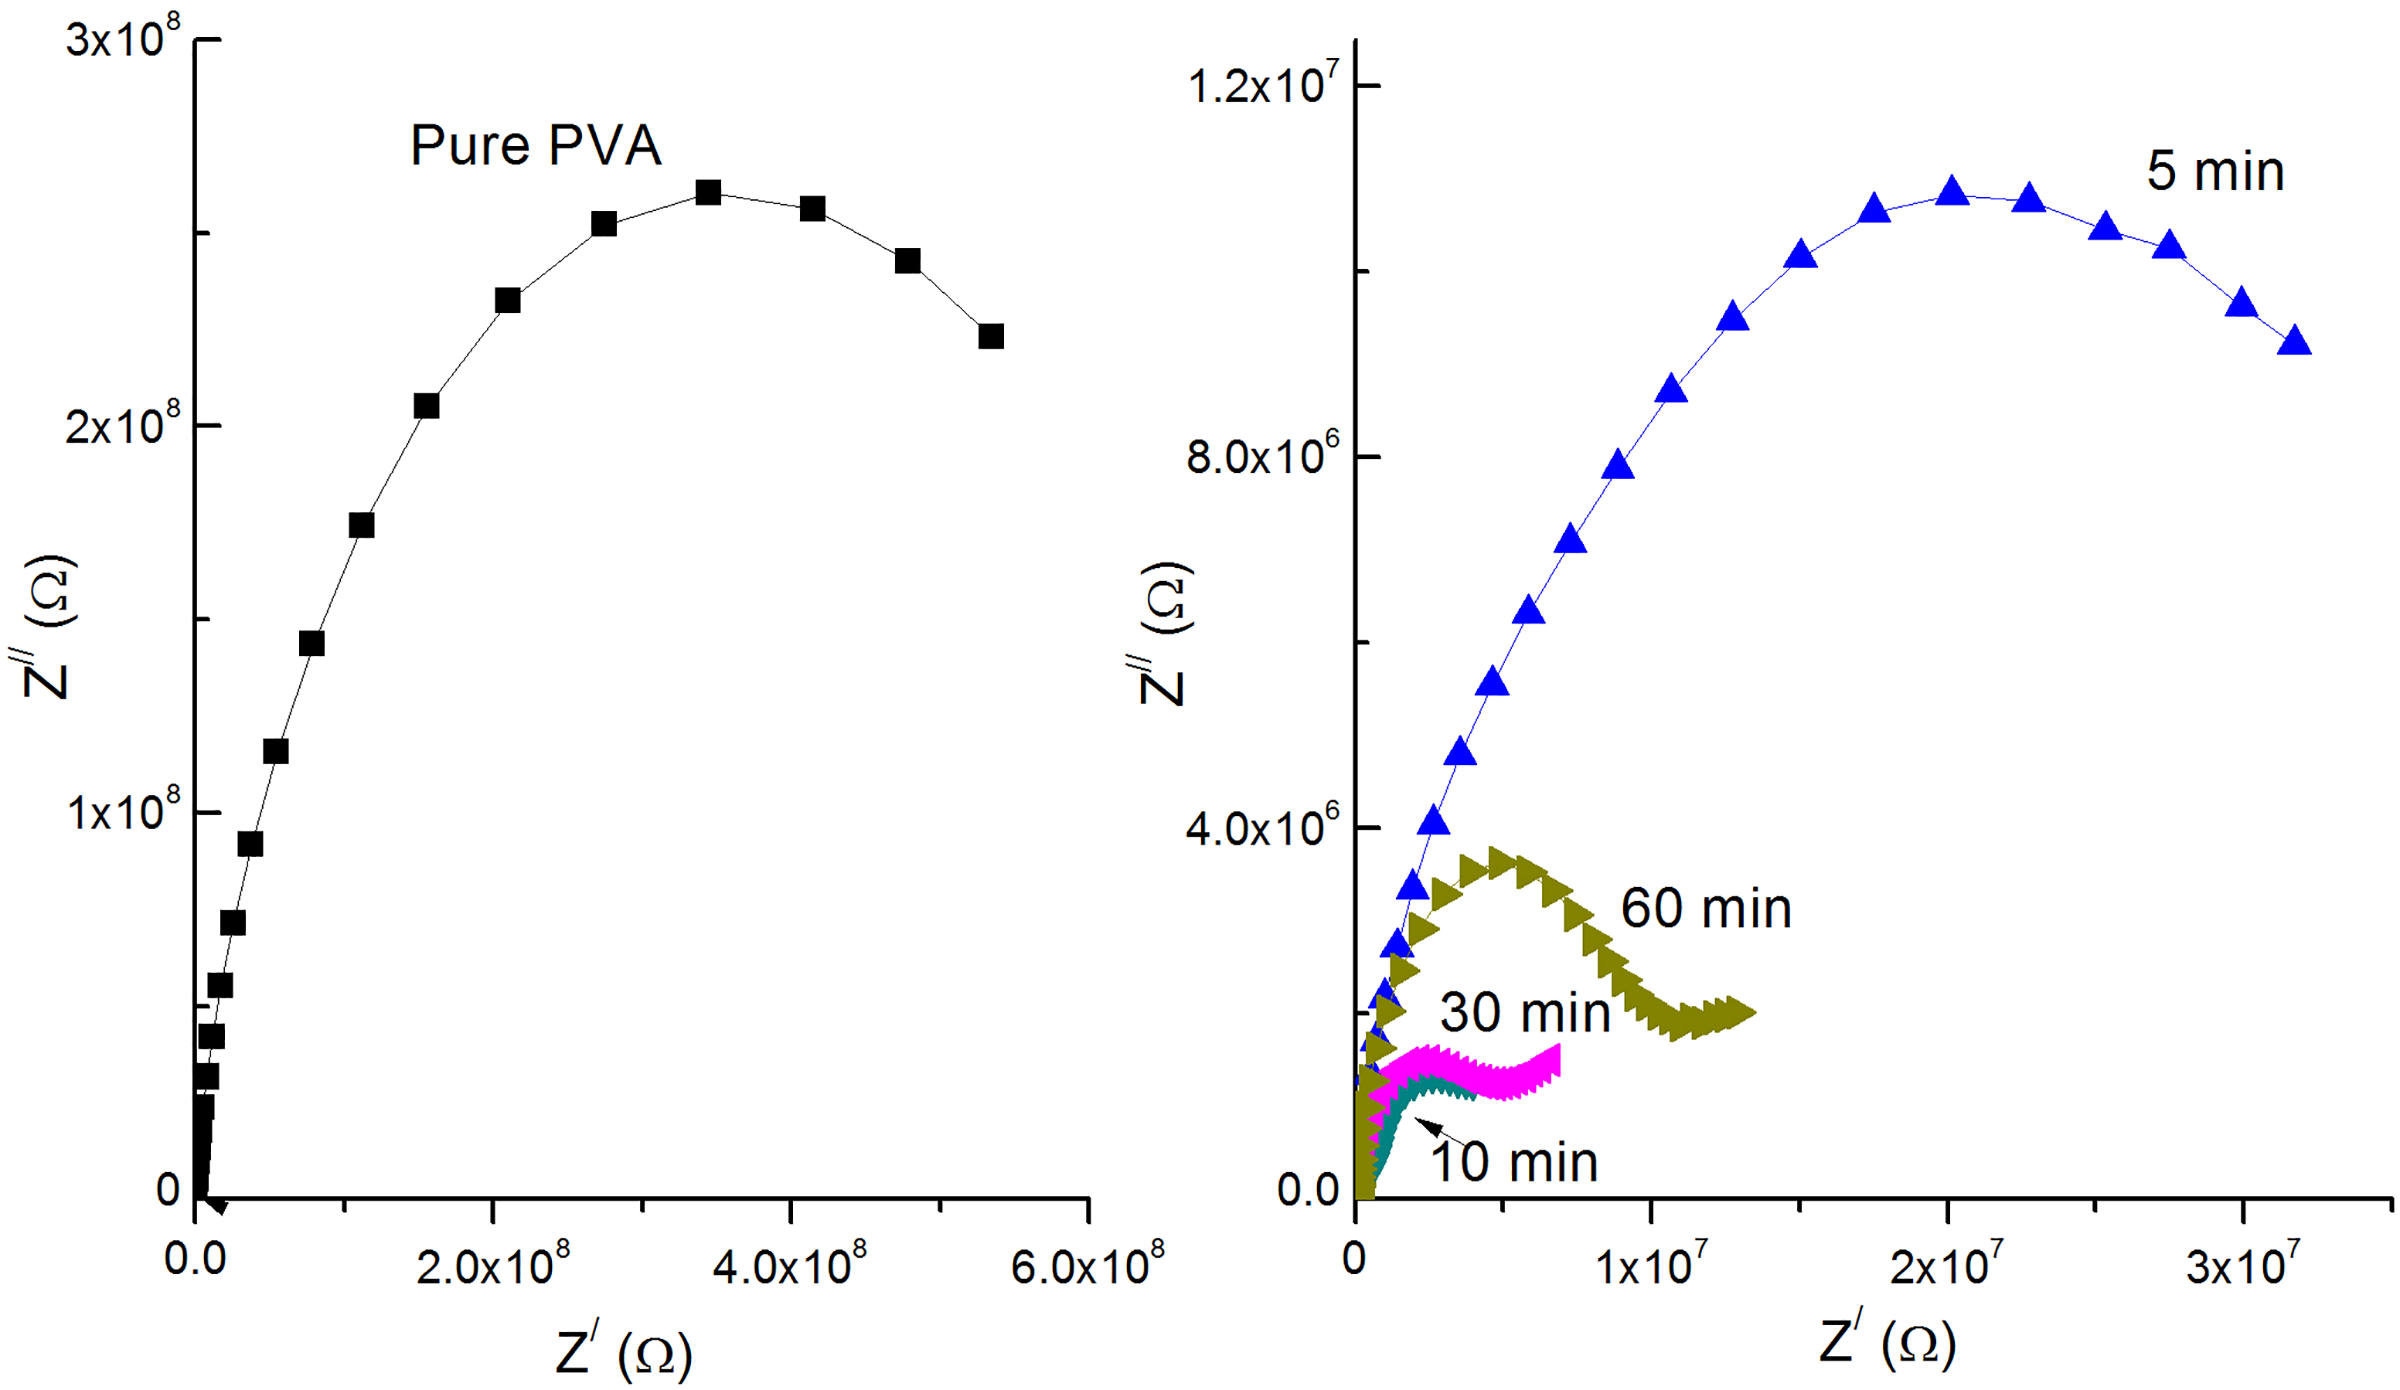
Cole–Cole impedance plots for PVA loaded with graphene sheets exfoliated at different times and at room temperature.
It is obvious from Figure 12 that pure PVA and 5-min exfoliation time samples have incomplete semicircles behavior with high radius, which indicates that graphene sheets are collected in aggregates covered with polymer layers (for 5 min sample), and there is no chance for charges migration. On the other hand, Cole–Cole Z semicircle appears with smaller radius for 10-min exfoliation sample. The radius of the Cole–Cole plot of composite increases again for exfoliation times greater than 10 min (30 and 60 min). This indicates that the distance between graphene sheets in the polymer network decreases besides the formation of dispersed graphene networks for 10-min exfoliation time. 43 For samples with 30 and 60 min, graphene begin to aggregate and conduction paths through them become less.
Tensile properties
Figure 13 illustrates the stress–strain curves for PVA loaded with graphene sheets exfoliated at different times of 0, 5, 10, 30 and 60 min at room temperature and at a force rate of 1.5 N min−1. The curves are characterized by a linear part at small stresses and strains which reflects the Hookean behavior of these composites. This linear region at small strain values is used to calculate the elastic modulus, E, of all composites. Figure 14 presents the change in the elastic modulus with increasing the exfoliation time at room temperature. The figure shows an increase in the elastic modulus from 0.78 GPa for pristine PVA to 1.66 GPa for PVA loaded with graphene exfoliated for 30 min. On the other hand, exfoliation time of 60 min decreases the elastic modulus to 1.35 GPa.
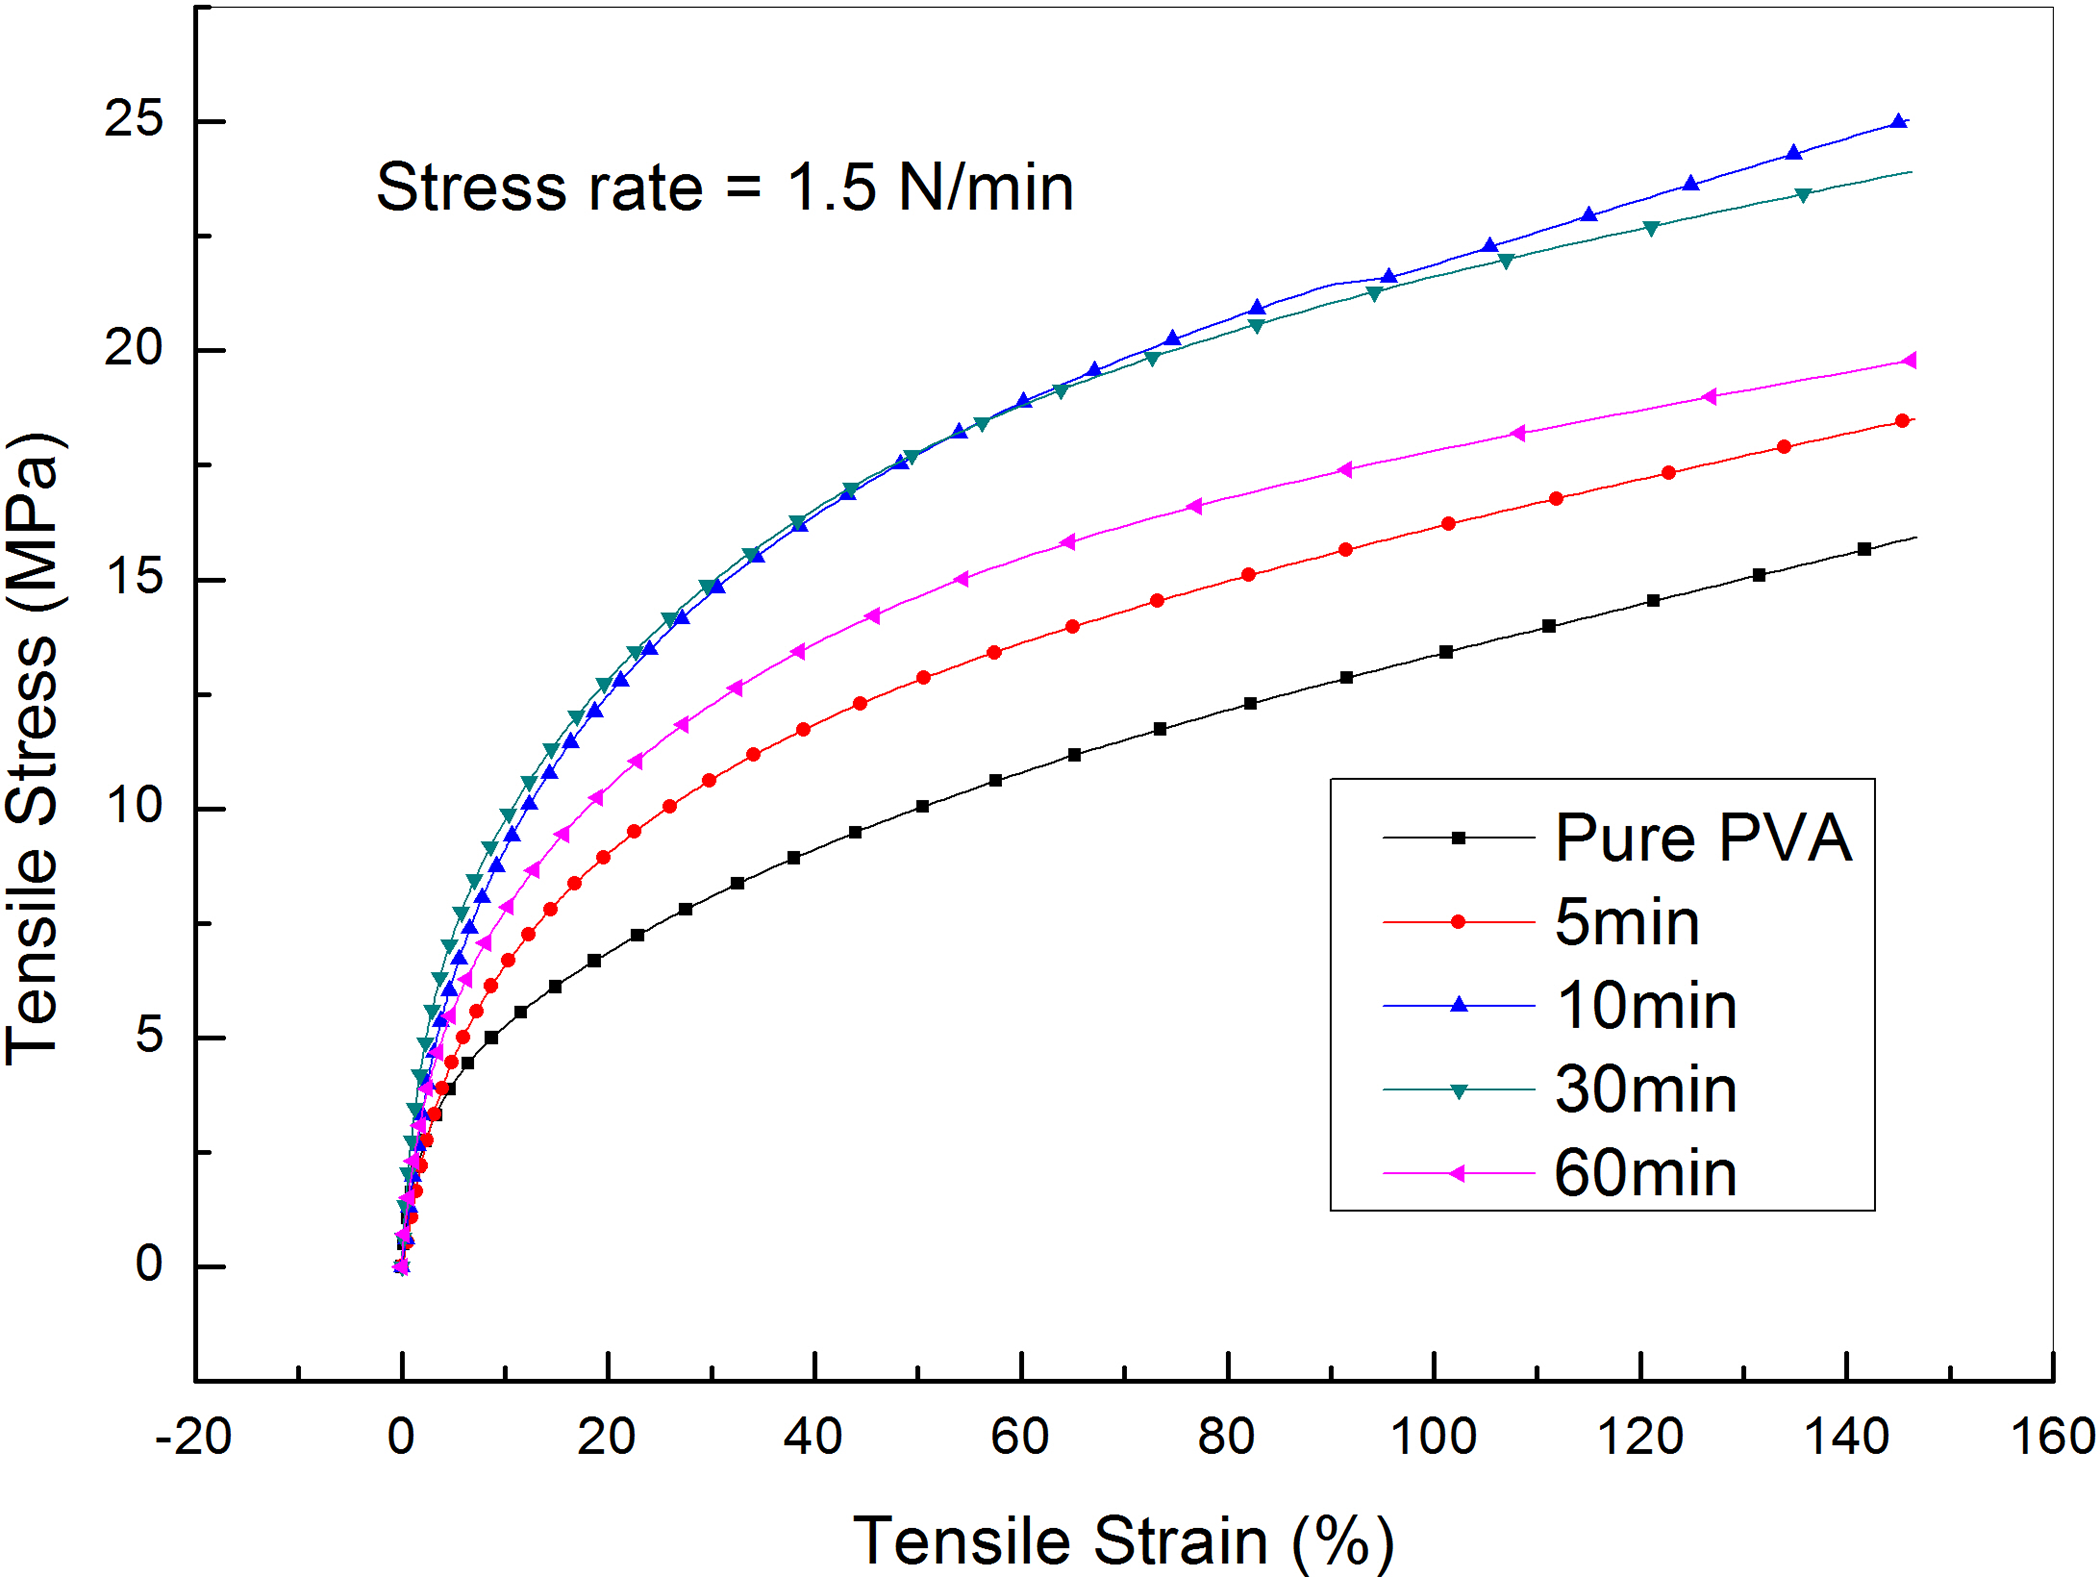
Stress–strain curves of PVA loaded with graphene sheets exfoliated at different times and at a force rate of 1.5 N min−1.
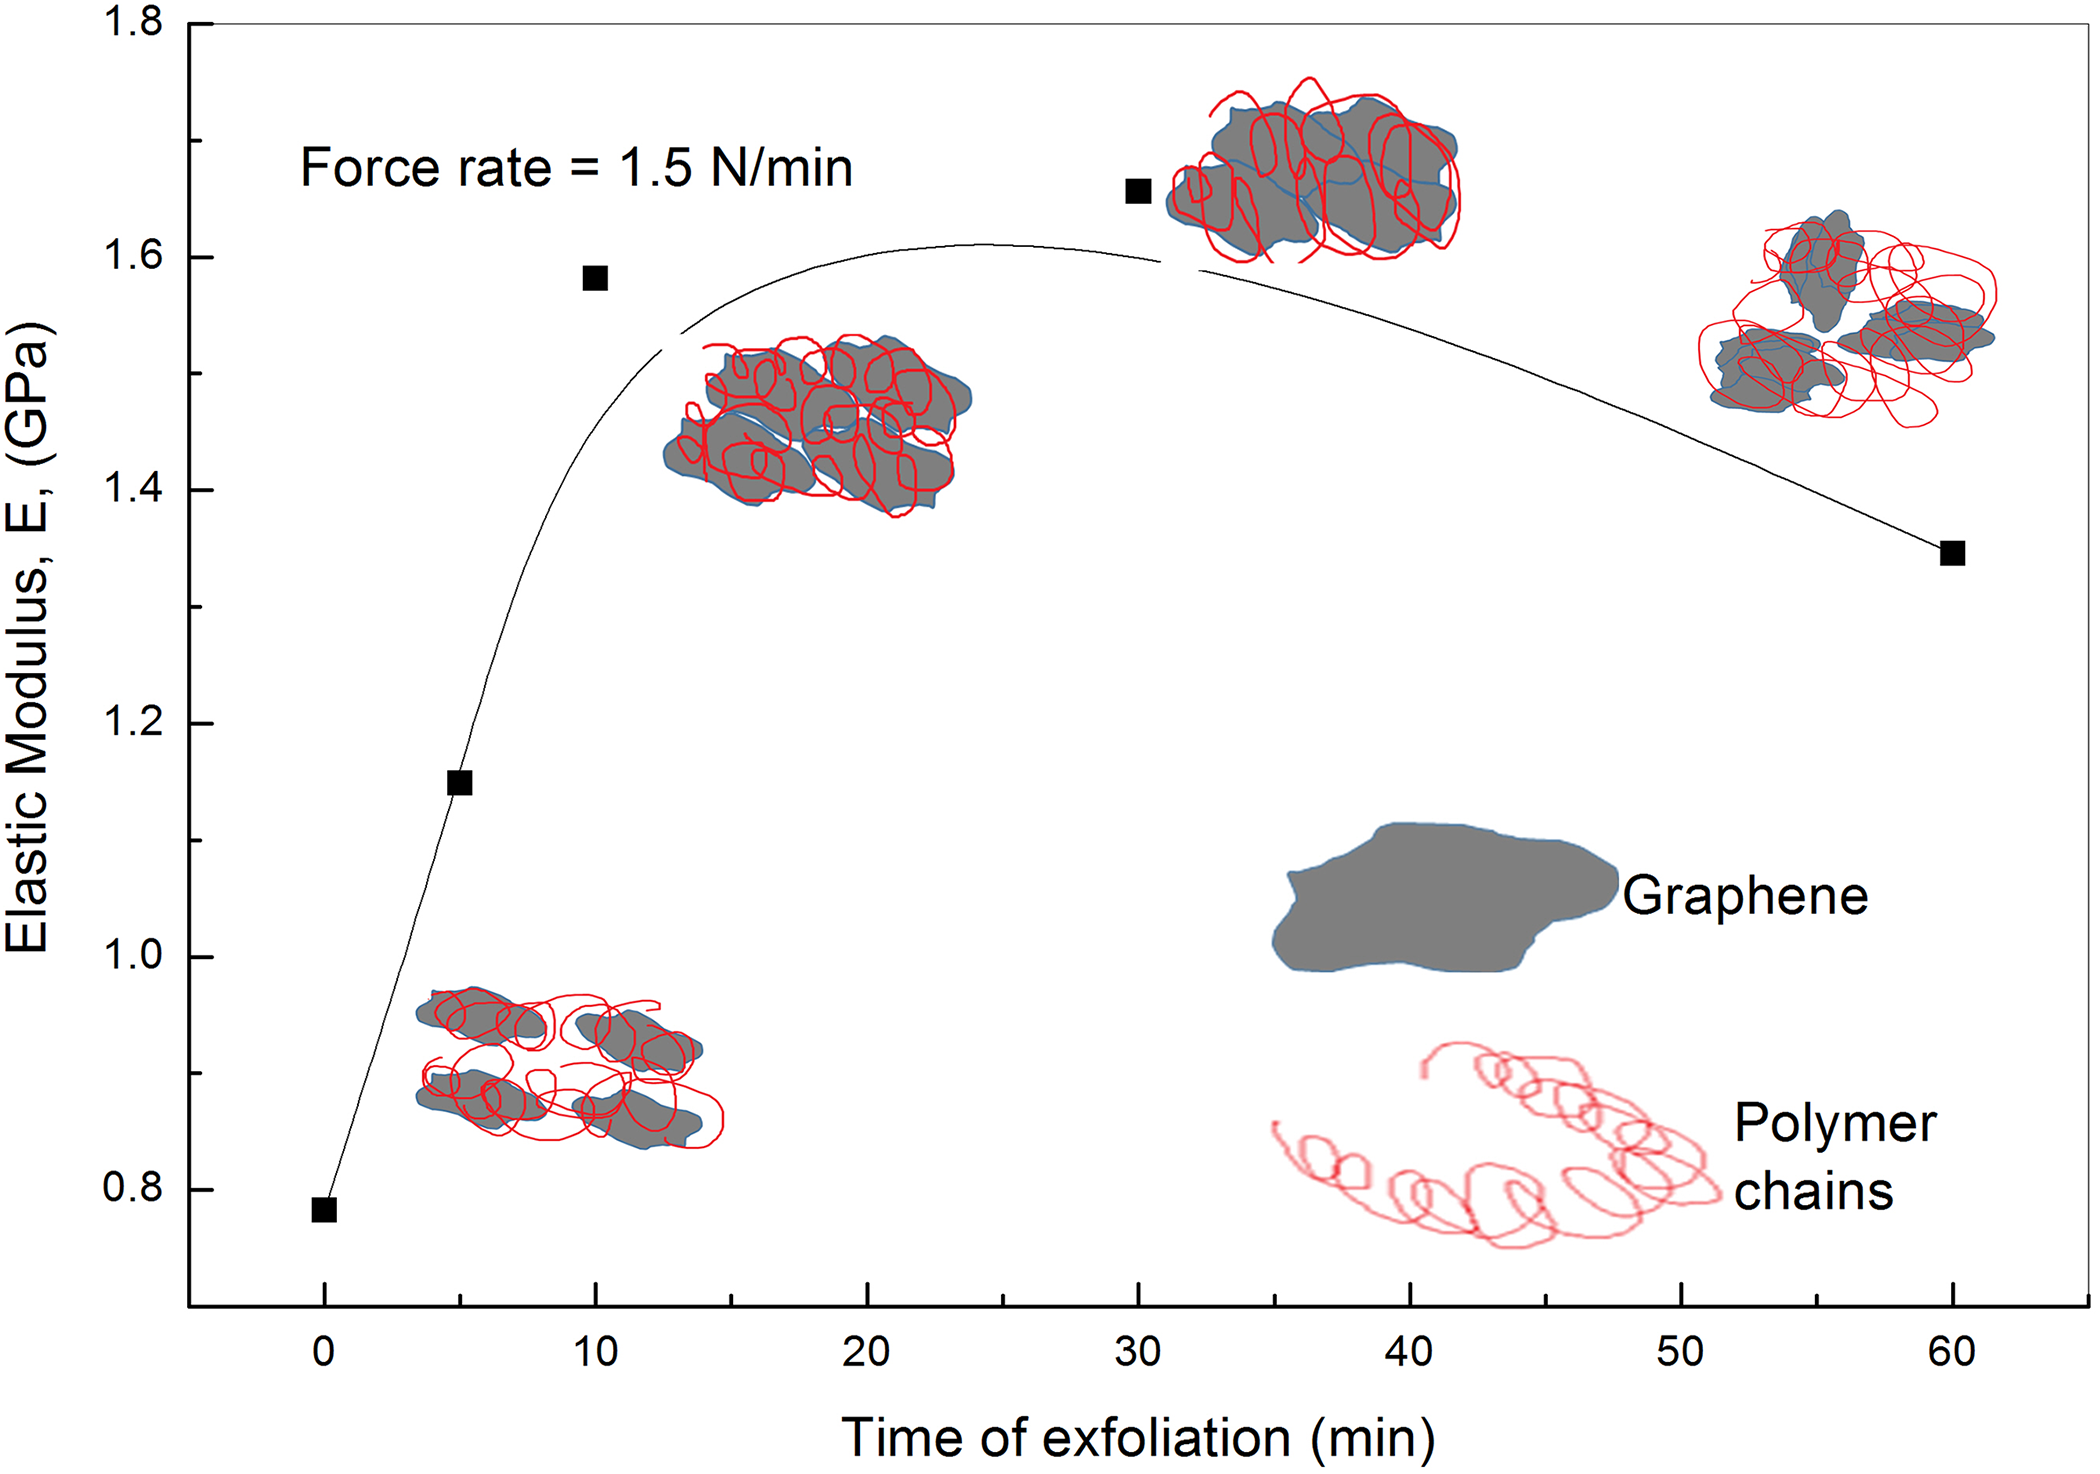
The dependence of the elastic modulus of PVA loaded with graphene on the exfoliation time at a force rate of 1.5 N min−1.
The arrangement of graphene sheets in polymer matrix can be described upon increasing the nanofillers according to the following stages. 15 Stage no. 1, nanofillers are dispersed individually in the matrix. Stage no. 2, their arrangement becomes edge to edge such that they just join side by side. Stage no. 3, some of the flakes overlap with each other. Stage no. 4, the graphene layers stack together due to Van der Waals forces. The edge-to-edge configuration is the ideal one, exhibiting the ultimate contribution to the mechanical and electrical behavior with the highest efficiency. 15 There exists a critical point of the mechanical and electrical properties upon the nanosheet content known as mechanical or electrical percolation threshold. 44 Lower than this content, the exfoliated GNs are well dispersed in the polymer matrix. The increase of loading has a significant improvement of the mechanical as well as the electrical properties. Further loading cause the nanosheets to stack together, weakening the efficiency of the mechanical improvement. 15 The increase of Young’s modulus and the electrical conductivity with graphene loading to the end of configuration 2 and the beginning of 3 refers to the large aspect ratio of GNs and the strong interfacial interaction between graphene and polymer chains. It also refers to the strain of polymer chains as indicated from Raman spectroscopy analysis. Further graphene loading beyond configuration 2 decreases the total graphene surface area due to staking of layers. This must decreases the interfacial interaction between polymer chains endings and graphene and results as a decrease in both Young’s modulus and the electrical conductivity. 15 The decrease in the crystalline characteristics of the composites beyond 30 min exfoliation of graphene, which obtained from Raman spectroscopy, also decreases the electrical conductivity and the elastic modulus.
Conclusions
In this work, new approach for preparing PVA-loaded GNs is followed. It depends on the exfoliation of graphite, using low-voltage DC power supply, into GNs inside an electrolytic solution composed of deionized water, PVA, and salt for different times of exfoliation. The advantages of this approach are easy to perform, low cost, high mass production of graphene and, almost, produces effective results. It increases the electrical conductivity, dielectric permittivity, and the elastic modulus of PVA at very short exfoliation time of 10 min. This approach decreases the possibility of graphene aggregation (and not cancels it at all) since the exfoliated graphene layers are distributed one after one inside the polymer matrix. The main disadvantage of this approach is the difficulty of calculating the concentration of graphene loadings exactly.
Footnotes
Acknowledgement
The authors would like to acknowledge Deanship of Scientific Research, King Faisal University, Al-Ahsa, Kingdom of Saudi Arabia, for funding and providing the facilities required for this research as a part of the Research Grants Program.
Funding
The author(s) disclosed receipt of the following financial support for the research, authorship, and/or publication of this article: This work was financially supported by the Deanship of Scientific Research, King Faisal University, Al-Ahsa, Kingdom of Saudi Arabia as a part of the Research Grants Program (No. 17122002).