
Abstract
The principal subject of the present article is the study of the phenomenon of dispersion as well as the effect of the concentration of strontium titanate (SrTiO3) and carbon black on the complex permittivity of ternary composites: epoxy resin–SrTiO3 –black carbon. The relative permittivity of the mixtures as a function of volume fraction of SrTiO3 was modeled by the modified Lichtenecker mixing law (MLL). A new dispersion model, based on the Lorentzian resonance model, has been proposed to describe the frequency behavior of complex permittivity. For these ternary composites, the frequency dispersion behavior of the complex permittivity that exhibits both relaxation and resonance spectra with increasing SrTiO3 concentration has been showed. The new empirical equation proposed in our work has been well describing the complex permittivity of resonance type for the SrTiO3 and carbon black composites. The effects of SrTiO3 content on the electromagnetic properties and absorption characteristics of electromagnetic waves of epoxy resin composites were studied. As the volume fraction of SrTiO3 increases, it was confirmed that the complex permittivity of the composites follows the MLL and the resonant frequency shifted toward the high frequency range. The resonance frequency of the composites was estimated in good agreement with the theoretical values calculated by the second new equation proposed in this article. Complex permittivity is measured using time domain spectroscopy in the frequency range direct current (DC) to 30 GHz.
Keywords
Introduction
In recent years, the success of microwave applications is directly related to the dielectric properties of composite materials. Electromagnetic wave energy has been applied in many fields, particularly in wireless communication, local area networks, radar systems, the food industry, and so on. 1 Recent research on materials, based on polymer doped with ferroelectric dielectrics and conductive fillers, has been conducted to study the structure, dynamics, and electromagnetic behavior of these complex systems. In particular, the polymer composites containing the dielectric materials will be used as electromagnetic wave absorbers exploiting the attenuation characteristic of the electromagnetic waves and which is a function of the concentration of the components, the thickness, the nature of the composite, and the frequency. 2 Microwave radiation absorbing materials are used in different fields: radiometer target calibration, electromagnetic shielding, antenna design, and so on. It is therefore very important to characterize them in terms of frequency-dependent complex permittivity over a wide range of frequencies. 3
Accurate measurement and practical knowledge of these properties are key factors in understanding the interaction of microwaves with materials. The knowledge of dielectric properties as a function of frequency is important both in fundamental studies of the structure and dynamics of composites and in practical application as absorbers. The dielectric relaxation behavior of the mixtures under various composition conditions is very important because it helps to obtain information on the relaxation processes in the composite materials. 4
The properties of the polymer composites in term of relaxation have received attention in part because these properties can show details of the phase structure of these systems and provide information on the interactions between the constituents of the mixture. 5,6 The complex permittivity of the composite depends on the frequency and has a frequency dispersion behavior. In general, to fully characterize these relaxation behaviors requires the use of a special techniques to cover the relevant frequency ranges. For this reason, the time domain spectroscopy (TDS) has been useful because of their major advantages. The TDS technique can cover an extremely wide frequency. The great successful developments in TDS method have given a very good results and allowed the change in the attitude toward dielectric spectroscopy; it is now recognized as an effective investigative tool for solid and liquid research at macroscopic, microscopic, and mesoscopic levels. 7 In our work, the permittivity is extracted from the TDS measurements with the multiple reflections method for frequencies range from DC up to 30 GHz. 8 SrTiO3-based ceramics are considered promising materials for microelectronic microwave applications, due to their unique physical properties, such as high dielectric constant, low dielectric loss, and favorable electrical support stability. 9,10
In this article, ternary mixtures of epoxy–strontium titanate–carbon black (RE-ST-CB) are used to study the effects of strontium titanate (SrTiO3) content on the electromagnetic properties and absorption characteristics of electromagnetic waves of composites. A study is made to show the effects of SrTiO3 concentration on the resonance frequency of composites and the dielectric behavior of their complex permittivity. The behavioral model of the complex permittivity dispersion of the RE-ST-CB ternary composites is also determined. We will present a new resonance law and validation for the modeling of complex permittivity behavior versus frequency for ternary composites. The experimental data were first compared with the theoretical values from the proposed models, as well as a comparison of the experimental results of the complex permittivity of the resonance type composites with the calculated values of the proposed new empirical model in this article.
Modeling of frequency-dependent permittivity
Relaxation type
The complex dielectric permittivity

where

If

where
The above relationship does not adequately describe the experimental results for most real systems. This leads to the need to look for empirical relationships, which formally take into account the distribution of relaxation times. In general, such non-Debye dielectric behavior can be described in terms of continuous distribution of relaxation times

where the distribution function

There are some modified Debye relaxation models that include asymmetrical and damping factors. These models are Cole–Cole and Cole–Davidson represented by equations (5) and (6), respectively: 12,13


where α and β are empirical parameters (
In most cases of non-Debye dielectric spectra, the data have been described by the so-called Havriliak–Negami (HN) relationship: 14

here α and
Resonance type
Born and Wolf 15 proposed a model for the resonance spectra of the complex permittivity, while Miles, Wertphal, and Hippel 16 proposed a model for the resonance spectra of the magnetic susceptibility. 17 The Lorentzian resonant model is presented by the following equation:
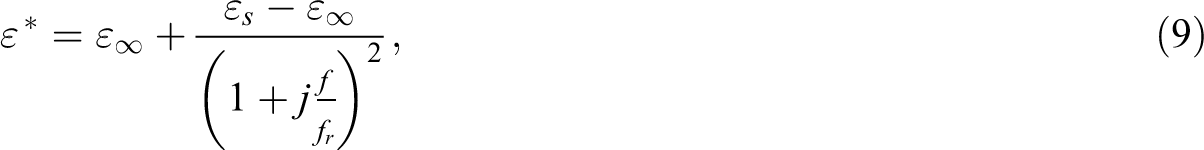
where fr is the resonant frequency. We can rewrite this equation as follows:
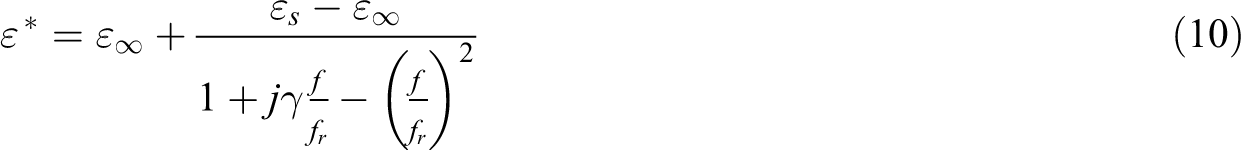
by introducing an empirical damping factor
Similarly to modifications of Debye model, (6) and (7), a modified version of Lorentzian model, which is proposed by Choi et al., 17 is represented as follows:

where
When the Lorentzian damping constant γ is as large as 10, the resonance behavior completely transforms into the ideal relaxation behavior. The peak in the permittivity spectra indicates the existence of the polarization relaxation. 18
Kramer–Kronig relations
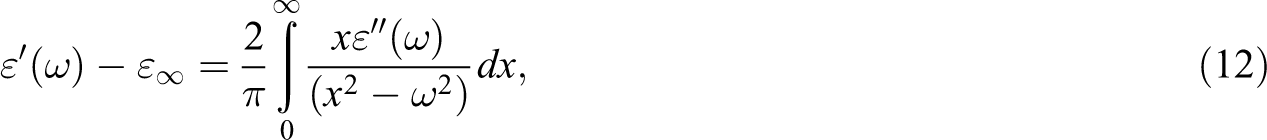
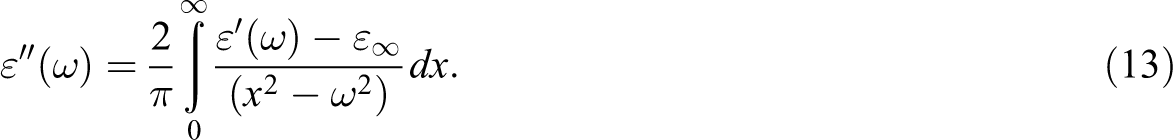
Since ε′ and ε″ are connected by Kramer–Kronig relations (equation (12) and (13)), any abrupt variation of ε′ in the vicinity of the resonance frequency results in a large peak and a narrower width of the characteristic curve ε″ 19
Each type of polarization induces a decrease of the permittivity with the frequency as well as a peak of dielectric losses. 20 The Lorentz model with damping, which characterizes a distorted Cole–Cole semicircle, is used.
The polarization response of the materials to electromagnetic waves cannot precede the cause, so models that represent permittivity must satisfy Kramers–Kronig relations. These mathematical relations connect real and imaginary part of the complex permittivity. 21
Materials and methods
Experimental apparatus
Experimental results of the complex dielectric permittivity have been carried out by the TDS using the multiple reflections method. The system is composed of a step generator with a step pulse of 200 mV and a rise time of 28 ps (model HP 54121 from Hewlett-Packard Company), a sampling probe, and a digital oscilloscope HP 84120B from Hewlett-Packard Company. The voltage step propagates along an APC-7 coaxial line whose characteristic impedance is Z 0 = 50 Ω. The composite sample with a predefined thickness d is placed at the end of the coaxial line cell and terminated by a matched load Z 0 (Figure 1). The experiments have been carried out as described in Bouchaour et al. 22

TDS experimental setup.
Experimental method
The different discontinuities present in the coaxial line give rise to a multiple reflections, characterized by the complex reflection coefficient

The normalized input admittance

To extract the complex dielectric permittivity
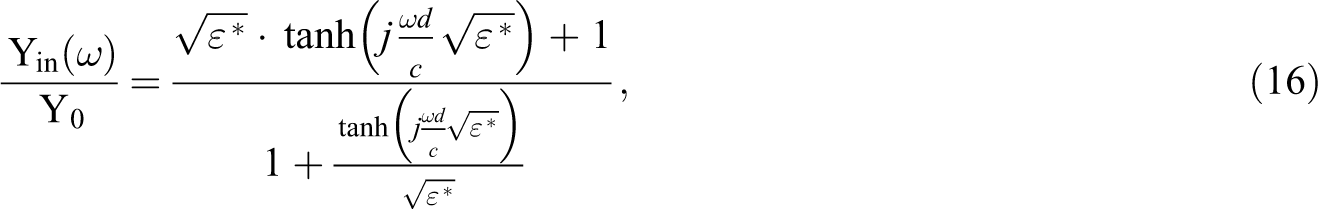
where ω is the angular frequency, d is the sample thickness, and c is the light celerity.
A numerical method described in Bouzit 25 allows us to find several solutions in the complex plane to the previous transcendent equation (16) and thus to obtain a final value of the complex permittivity.
Results and discussion
Figure 2 shows the dispersion behaviors of the complex permittivity of the RE-ST-CB ternary composites for different concentrations of SrTiO3. The real part (
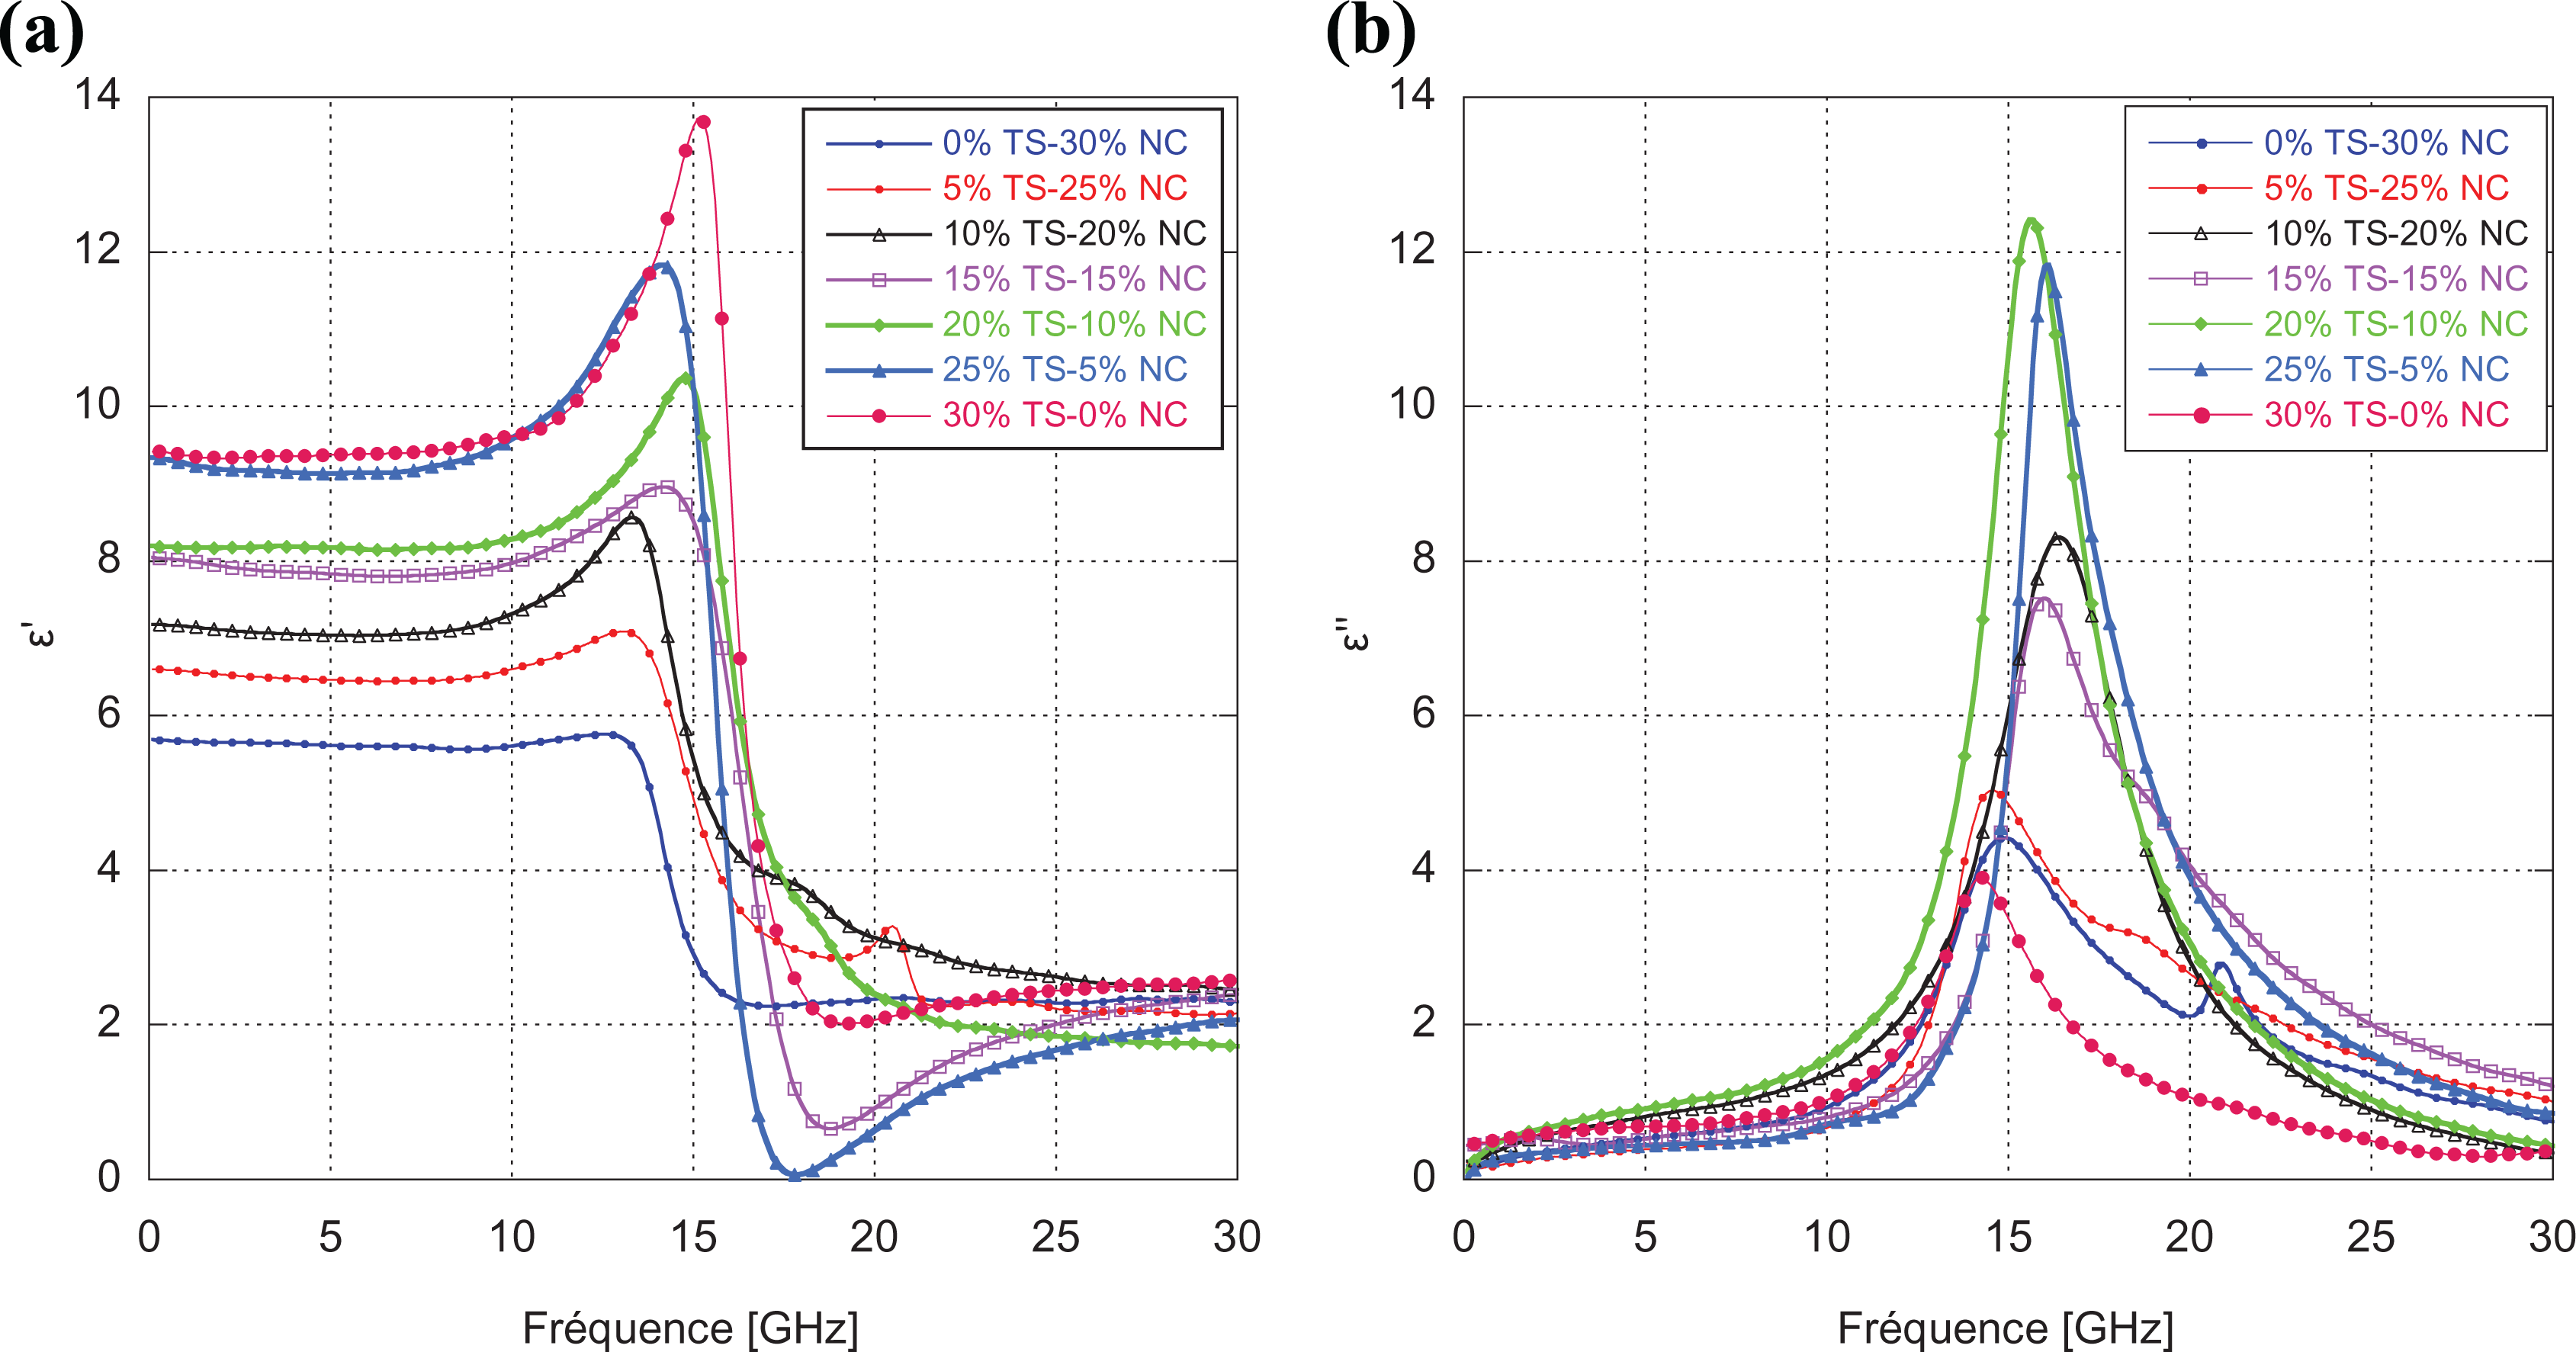
The complex permittivity of ternary composites (RE-ST-CB) for various SrTiO3 contents: (a) real permittivity and (b) imaginary part of the complex permittivity.
By comparing the two curves of permittivity (ε′ and ε″) for each composite, we note that a variation of the real part corresponds to a peak of dielectric losses and this in accordance with the Kramer–Kronig relations that are valid in both relaxation and resonance phenomena.
Several equations well-known as mixture laws for composites were selected for this study. The notation used here applies to three-phase mixtures, where

where AL is the shape factor.
The second mixture law is proposed by Looyenga, whose form is as follows:

For the third law, Yonezawa and Cohen offer us the following law:

where i is the phase number and n′ is a shape factor depending on the geometric dimension of the inclusions.
In Figure 3, the experimental data of effective permittivity as a function of the volume fraction of the composite were compared with the values calculated by equations (17) to (19). It is clear from the figure that the experimental data are close to the values calculated for equation (17). Then it can be concluded that the effective permittivities of the ternary composites RE-ST-CB as a function of the SrTiO3 volume fraction matched relatively well with the values calculated by the MLL.

Effective permittivity comparison of experimental values with the theoretical models for ternary composite.
Choi et al.
2
showed that the square root of effective permittivity

as a function of the dielectric concentration V and have established an empirical relation to predict the resonance frequency of the composite.
For the case of our ternary composites, we proceed in the same way, that is, we propose to plot the quantity (20) as function of the SrTiO3 concentration to determine the relationship between the resonance frequency
The experimental values of resonance frequency multiplied by the square root of the permittivity


where C is a constant to be identified by a numerical optimization method.
As the volume fraction of SrTiO3 increased, the effective permittivity increased and the resonance frequency shifted to high frequencies. Keeping in mind that the combined volume percentage of CB and ST is kept at 30%, that is, the epoxy matrix is always constant at 70%. Therefore, if we plot the same quantity (20) as a function of volume fraction CB (
Figures 5 show a comparison of the experimental complex permittivity data for the ternary composites containing 0, 10, 20, and 30% of the SrTiO3 volume fraction with the values calculated by equation (11). The empirical constants γ are, respectively, 7.2, 5.1, 5.3, and 3.0 and the asymmetry constants k are then 0.93, 0.68, 0.78, and 0.80. The real and imaginary parts of the permittivity obtained by equation (11) deviate from the curves of experimental values. For the real part, the theoretical curve shifts from the experimental curve in three points: the value of the static permittivity
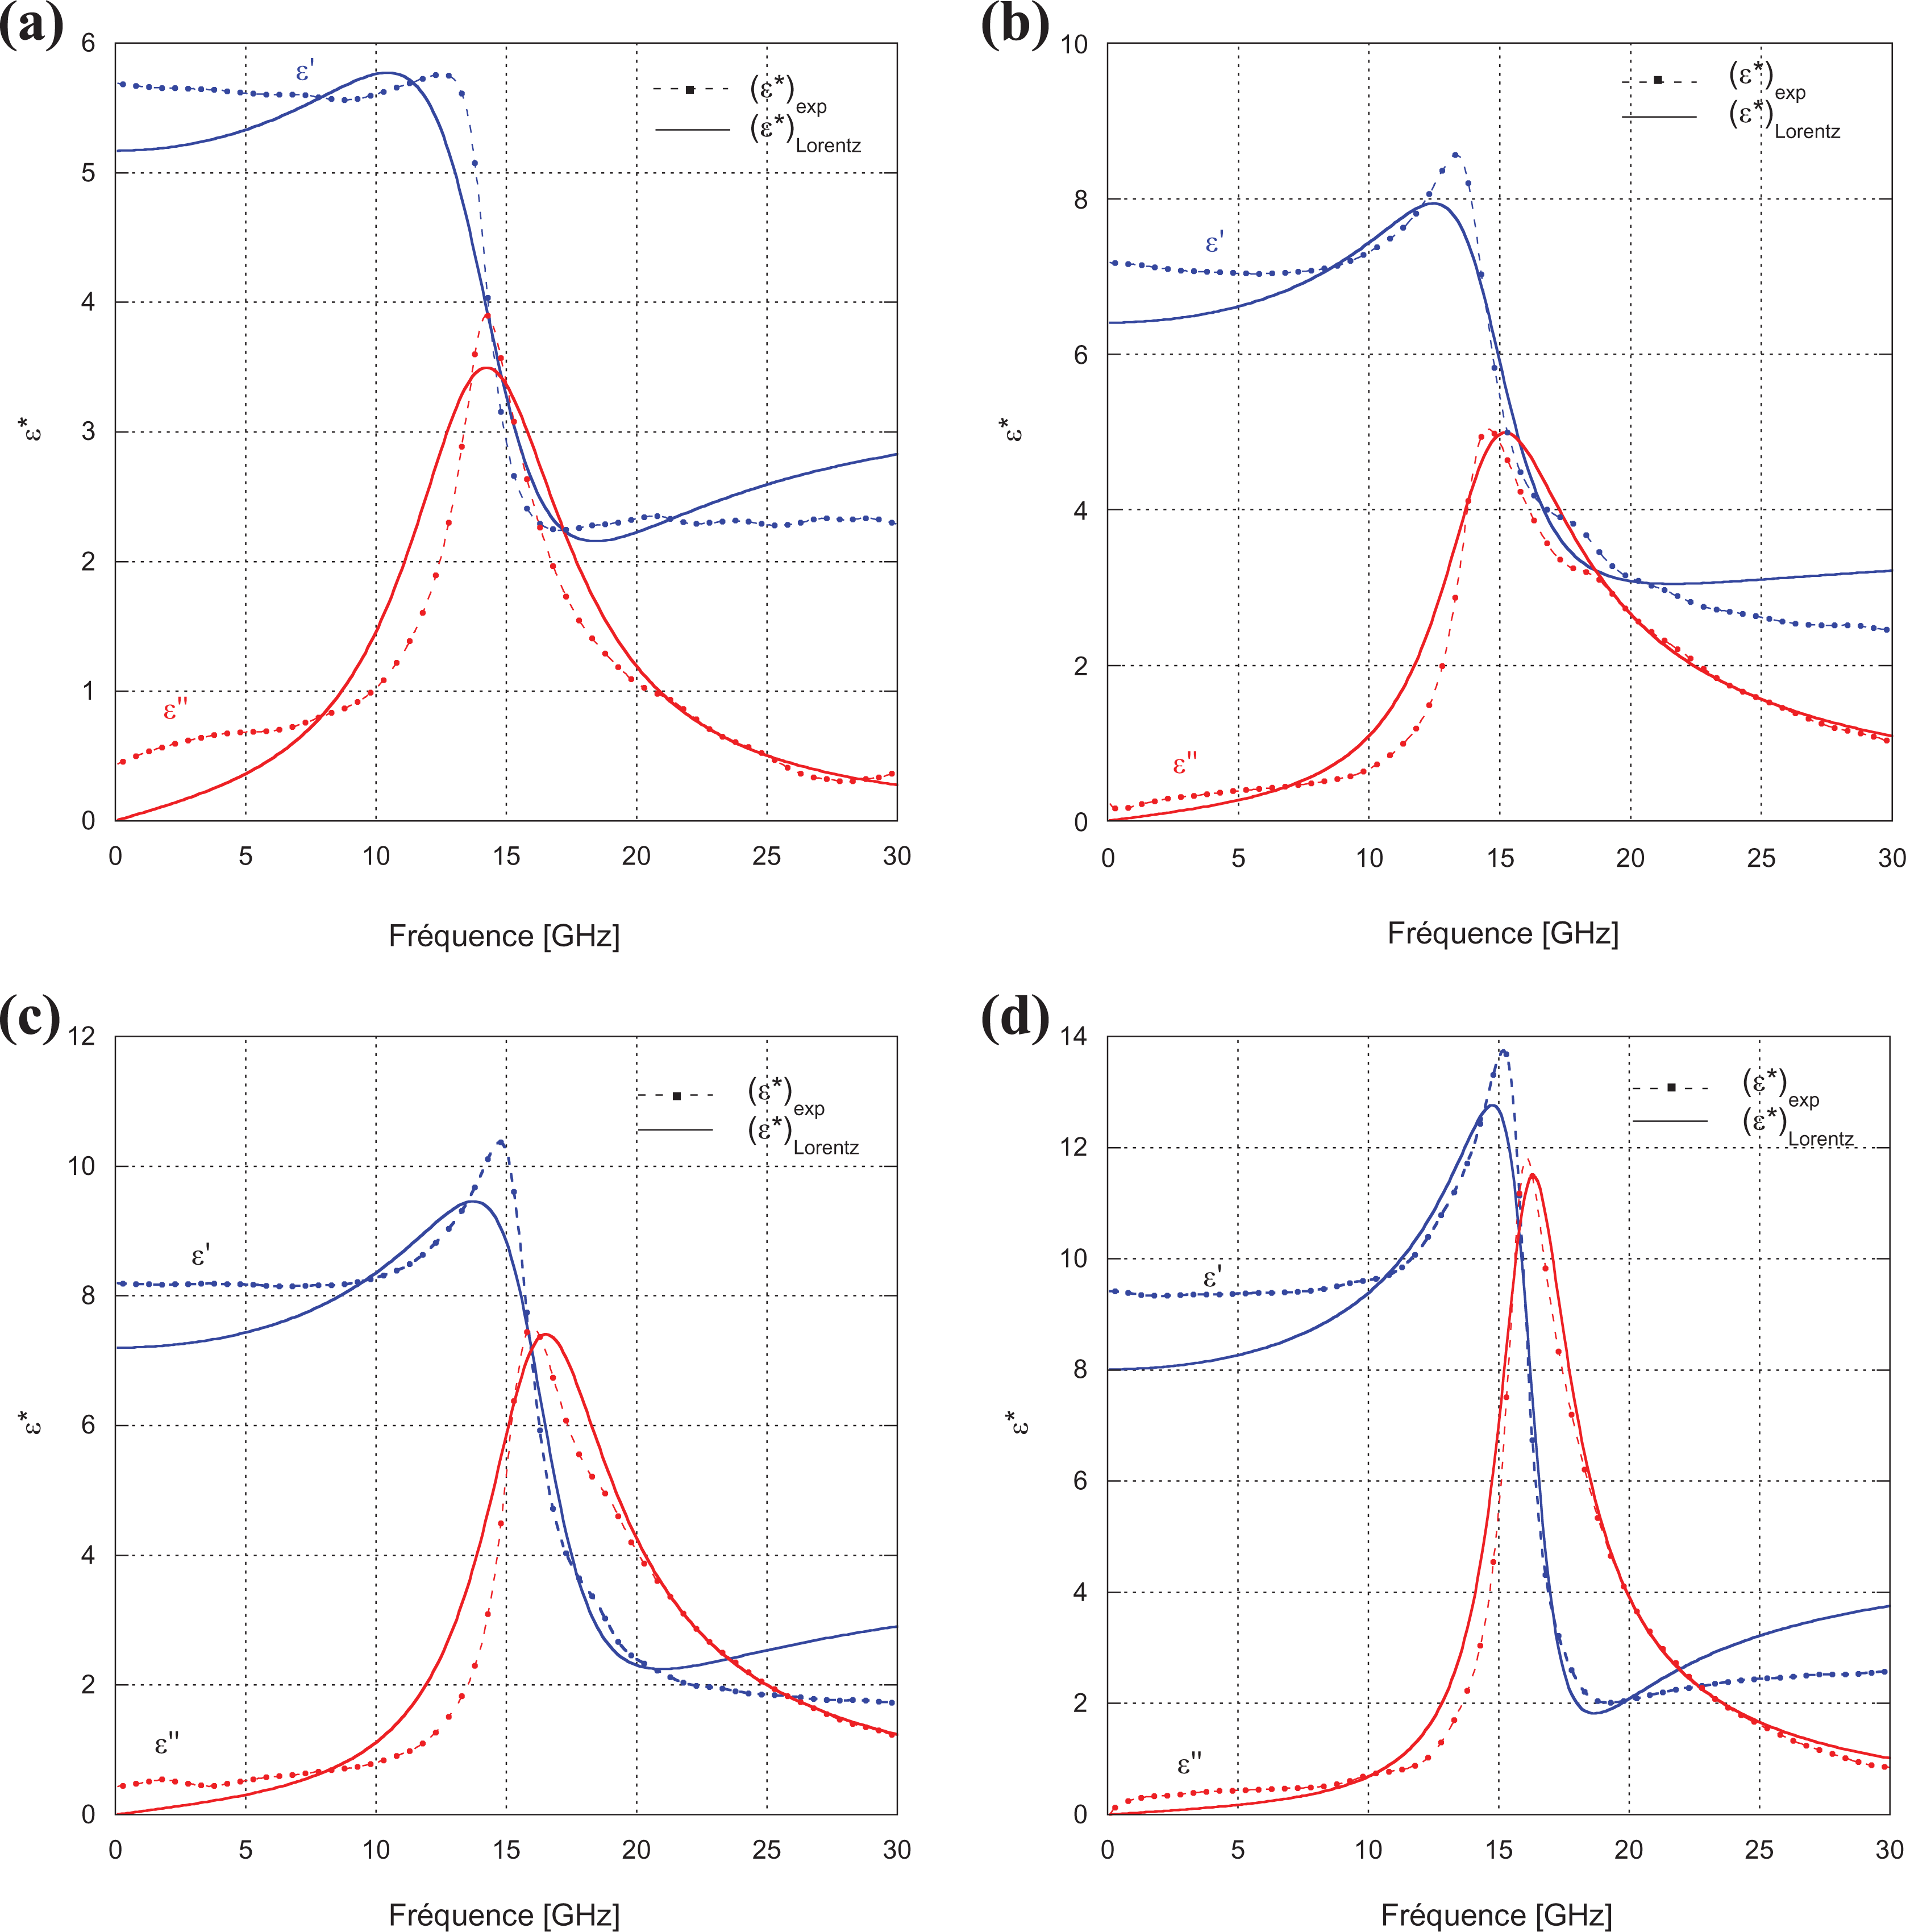
Comparison of experimental and calculated curves for the frequency spectra of the complex permittivity for different SrTiO3 volume fractions: (a) 0%, (b) 10%, (c) 20%, and (d) 30%.
We propose a new empirical equation to model the resonance behavior of ternary composites by introducing an additional parameter to give another degree of freedom to best fit the experimental data to a calculated curve. The new model is obtained by adopting the Lorentzian resonance equation (10) and introducing the two parameters such as the empirical HN relaxation equation, as follows:

We also note a second modification concerning the power of the term
Figures 6 shows a comparison of the experimental complex permittivity data for the ternary composites containing 0, 10, 20, and 30% of the SrTiO3 volume fraction with the values calculated by the new model. As can be seen, the proposed equation (22) predicts the experimental curves with good accuracy as the SrTiO3 concentration increases. This agreement is justified by the form of equation (22) which is of the HN type (with two parameters α and β) and can better model the high and low frequency parts, whereas equation (11) contains only one asymmetric factor k. On the other hand, the power 4 of the term (

Comparison of experimental values with curves of the new model for the frequency spectra of the complex permittivity for different SrTiO3 volume fractions: (a) 0%, (b) 10%, (c) 20%, and (d) 30%.
Table 1 shows the values of damping factor γ for ternary composites RE-ST-CB.
In Figure 7, the Cole–Cole diagram is drawn to better understand the relationships between the real and imaginary permittivities of composites. We note a good agreement between the theoretical circles obtained by equation (22) and the experimental curves. To evaluate in a more quantitative way the error between the theoretical and experimental permittivities (real and imaginary), we calculate the following error:

Values of the coefficient γ for ternary composites RE-ST-CB.

RE-ST-CB: epoxy–strontium titanate–carbon black.

The Cole–Cole plot for the theoretical and experimental values of the complex permittivity of ternary composites (0–30%).
The values obtained for the ternary composites are given in Table 2.
Values of the errors (

RE-ST-CB: epoxy–strontium titanate–carbon black.
Conclusions
In this article, we have presented a study on the dielectric relaxation and resonance behavior of the ternary composite materials made from a mixture of SrTiO3 and carbon black dispersed in epoxy resin matrix characterized by the TDS approach in the band frequency DC to 30 GHz. The proposed new empirical equation was very useful in describing the dispersive behavior of the complex permittivity of ternary composites, whose behavior shows a resonance phenomenon. The resonance frequency of the composite shifted to the high frequency range with increasing SrTiO3 volume fraction. The resonance behavior of the composites shows resonant frequencies that are proved in good agreement with the theoretical values calculated by equation (24) proposed in this article. In particular, the modeling of the frequency dispersion behavior of the complex permittivity of ternary composites allows us to predict the phenomenon when the effective permittivity, the resonance frequency, and the volume fraction of SrTiO3 and carbon black are known. The absorption characteristics of the electromagnetic waves are determined by the frequency dispersion behavior of the complex permittivity and influenced by the composition of the composite. The experimental results show the effect of adding ST to carbon black in ternary mixtures on their complex permittivity. The validation of the MLL for modeling is proved by the best fitting of the theoretical model with the experimental result. The improvement of data fitting is achieved by multiplying the identified permittivity by a shape factor with a polynomial form. The choice of carbon black as conductor fillers is dictated by its wide use in the manufacture of electronic circuits and devices. The results of this work will certainly contribute to yield new materials for future use in microelectronic components technology used in telecommunication systems such as resonators, antennas, and wave absorbers.
Footnotes
Declaration of conflicting interests
The author(s) declared no potential conflicts of interest with respect to the research, authorship, and/or publication of this article.
Funding
The author(s) received no financial support for the research, authorship, and/or publication of this article.