
Abstract
Autologous chondrocyte implantation (ACI) has long been regarded as the gold-standard chondrocyte-based therapy for articular cartilage repair. The main challenge in ACI is that chondrocytes lose their chondrogenic phenotype after monolayer expansion in vitro. The monolayer-expanded chondrocytes show dedifferentiation and senescence, hindering their ability to synthesize hyaline cartilage. Currently, there is no effective method to alleviate dedifferentiation and senescence in these monolayer-expanded chondrocytes. Adipose-derived stem cells (ADSCs) have been increasingly explored as a viable alternative cell source to chondrocytes for articular cartilage tissue engineering. Besides inducing chondrogenesis of ADSCs into chondrocyte, recent research emphasizes the positive impact of ADSC-secreted extracellular vesicles (ADSC-EVs). We demonstrate that ADSC-EVs alleviate dedifferentiation and senescence in monolayer-expanded chondrocytes, enhancing their capacity to produce hyaline cartilage. The ADSC-EVs treatment redifferentiated the monolayer-expanded chondrocytes by upregulating collagen type II (Col-II), sulfated glycosaminoglycan (sGAG), and SOX-9 expression and decreasing collagen type I (Col-I) levels. The redifferentiated chondrocytes also showed enhanced cell proliferation and reduced levels of P16 and senescence-associated β-galactosidase (SA-β-gal). Moreover, ADSC-EV treatment increased the ability of monolayer-expanded chondrocytes to synthesize hyaline cartilaginous matrices in 3D pellet culture. This effect is achieved through the suppression of interleukin-1β–induced mitogen-activated protein kinase (MAPK) signaling. Through next-generation sequencing and bioinformatic analyses, the miRNAs contained in ADSC-EVs were revealed as key candidates involved in mitigating dedifferentiation and senescence. Our findings propose a novel approach employing ADSC-EVs to restore the chondrogenic phenotype of monolayer-expanded chondrocytes, offering an alternative strategy for more effective ACI.

Keywords
Introduction
The sparse distribution of chondrocytes within hyaline cartilage results in the minimal self-repair capacity of articular cartilage, rendering the regeneration of articular cartilage defects a significant orthopedic challenge1–6. Articular cartilage defects are a primary driver of osteoarthritis (OA), which is globally recognized as the most prevalent joint disorder and the most common form of arthritis1,5–8. Autologous chondrocyte implantation (ACI) is considered the gold-standard cell-based therapy, as it frequently results in the formation of mechanically inferior fibrocartilage rather than native hyaline cartilage2–5,9–13. This clinical limitation is largely attributed to the monolayer expansion process required to obtain sufficient cell numbers5,14–16, which triggers chondrocyte dedifferentiation16,17. Chondrocyte dedifferentiation is characterized by the loss of their native chondrogenic phenotype1,4. During dedifferentiation, chondrocytes lose key hyaline cartilage markers—including collagen type II (Col-II), aggrecan, and sulfated glycosaminoglycans (sGAGs)—and concurrently adopt a fibroblast-like phenotype characterized by increased collagen type I (Col-I) expression1,18. Implantation of dedifferentiated chondrocytes results in fibrocartilage formation rather than the desired hyaline cartilage4,19. Therefore, restoring the chondrogenic phenotype in monolayer-expanded chondrocytes is critical in ACI for hyaline cartilage synthesis5,17.
Many techniques, such as the administration of biomolecule supplements, changing the cell density, applying 3D cultures, or using hypoxic or low-temperature culture conditions, have been tested in attempts to redifferentiate dedifferentiated chondrocytes and enhance hyaline cartilage synthesis4–6,16,18,20. However, the outcomes of these experiments are still inconsistent and remain unsatisfactory. For example, a 3D chondrocyte culture still cannot successfully downregulate the expression of Col-I in chondrocytes 18 . Besides dedifferentiation, chondrocyte senescence also occurs after monolayer expansion in vitro16,17. Monolayer-expanded chondrocytes exhibit two forms of senescence: replicative senescence and stress-induced premature senescence (SIPS)1,17. However, little is known about how to rejuvenate monolayer-expanded chondrocytes for more effective ACI.
Mesenchymal stem cells (MSCs)-based articular cartilage tissue engineering has been studied for articular cartilage defect regeneration5,6. Adipose-derived stem cells (ADSCs) have been explored as an alternative source of chondrocytes due to their abundance, strong proliferative capacity, low donor-site morbidity, and lack of ethical constraints 21 . Inducing ADSC chondrogenic differentiation is the commonly used strategy for articular cartilage tissue engineering 22 . However, MSCs are increasingly recognized to facilitate tissue regeneration by modulating the functions of host cells, including through their immunomodulatory effects 23 . In addition to directly inducing ADSC chondrogenic differentiation into chondrocytes for articular cartilage tissue engineering, ADSC–chondrocyte coculture is commonly used to improve chondrogenesis and promote hyaline cartilage formation21,24–26. ADSCs mediate intercellular communication primarily through their secretome, consisting of extracellular vesicles (EVs) and soluble molecules such as peptides and cytokines 27 . EVs are naturally secreted, membrane-bound particles that do not replicate, as they contain no functional nucleus 28 . EVs are now understood to be essential players in facilitating communication between cells 29 . These reports suggest that the EVs secreted by ADSCs may be applied to restore the chondrogenic phenotype of monolayer-expanded chondrocytes for ACI.
In this study, we hypothesize that ADSC-derived EVs are capable of restoring the chondrogenic phenotype in monolayer-expanded chondrocytes. To test our hypothesis, we investigated the impact of ADSC-EVs on the chondrogenic phenotype of monolayer-expanded chondrocytes by assessing markers of dedifferentiation and senescence. The effect of ADSC-EV treatment on hyaline cartilage synthesis of monolayer-expanded chondrocytes was also tested. The effect of ADSC-EVs on interleukin-1β and the mitogen-activated protein kinase (MAPK) levels in chondrocytes was tested. We also analyzed the microRNA (miRNA) profile of ADSC-EVs to identify cargo molecules that may be responsible for their ability to restore the chondrogenic phenotype in monolayer-expanded chondrocytes.
Materials and methods
Materials
All chemicals were purchased from Sigma‒Aldrich (St. Louis, MO, USA) unless otherwise specified.
Human chondrocyte monolayer culture
Human chondrocytes derived from the human articular cartilage of three male donors (34, 44, and 50 years old) were purchased from Lonza Bioscience (NHAC-kn Articular Chon CGM, cryo amp; Walkersville, MD, USA). Chondrocytes were cultured and expanded in monolayer in Dulbecco’s modified Eagle’s medium (DMEM) (Biowhittaker®; Lonza Bioscience, Walkersville, MD, USA) supplemented with 1% penicillin/streptomycin (Gibco BRL; Thermo Fisher Scientific, Waltham, MA, USA), 1% nonessential amino acids (NEAA), 1% insulin–transferrin–selenium (ITS), and 10% fetal bovine serum (FBS) 30 . Cells were cultured at 37°C in a humidified 5% CO2 incubator, with medium changes every 2 days until passaging 30 . Across all experiments, monolayer-expanded chondrocytes were utilized only up to passage six.
Human ADSC culture
Human ADSCs used in this study were purchased from StemPro (StemPro Human Adipose-Derived Stem Cells, Gibco BRL, Thermo Fisher Scientific, Waltham, MA, USA). The cells were expanded in K-NAC medium following protocols described in previous reports31–33. The K-NAC medium is composed of a basal keratinocyte serum-free medium (SFM) (Gibco BRL, Rockville, MD, USA) supplemented with 25 mg of bovine pituitary extract (Gibco BRL), 2.5 µg of human recombinant epidermal growth factor (Gibco BRL), 2 mM N-acetyl-L-cysteine, 0.2 mM L-ascorbic acid 2-phosphate sesquimagnesium salt, and 5% FBS31–33. Cells were expanded in a humidified 5% CO2 incubator at 37°C until adequate cell numbers were reached.
Induction and isolation of ADSC-EVs
For the induction of ADSC-EVs, ADSCs were suspended in an induction medium containing DMEM supplemented with 2% EV-depleted FBS (exosome-depleted, One ShotTM format; Catalog number, A2720803; Gibco BRL, Rockville, MD, USA) and penicillin/streptomycin. The ADSCs were then seeded on 15-cm culture plates (1.5 × 10⁴ cells/cm2) and cultured at 37°C for 48 h33–35. The conditioned medium (CM) in which ADSC-EVs had accumulated was harvested after 48 h. The ADSC-EVs were isolated following a multistep ultracentrifugation protocol with minimal modification33–36. The CM was first centrifuged at 2000 × g for 10 min at 4°C to remove suspended ADSCs, after which the supernatant was collected and centrifuged at 20,000 × g for 10 min at 4°C to clear large cell fragments33,36. The supernatant was then centrifuged at 50,000 × g for 1 h to eliminate remaining organelles and nuclei33,36. Subsequently, it was centrifuged at 180,000 × g for 1.5 h at 4°C to pellet the ADSC-EVs33,36. After removing the supernatant, the ADSC-EVs remaining at the bottom of the tube were resuspended in phosphate-buffered saline (PBS) to remove residual protein contaminants, followed by ultracentrifugation at 180,000 × g for 1.5 h at 4°C to obtain purified ADSC-EV pellets33,36. The ADSC-EVs were resuspended in 1 ml of sterile PBS and maintained at 4°C until subsequent characterization or experimental use33,34. Characterization of ADSC-EVs included assessments of their size, number, morphology, and protein composition28,34. Based on our nanoparticle tracking analysis (NTA) data, the isolated ADSC-EVs remain stable for up to 4 weeks. For all experiments, the isolated ADSC-EVs were stored at 4°C and used within 2 weeks.
ADSC-EV size and number
NTA was used to determine the size and number of ADSC-EVs 34 . Immediately following isolation, the particle size distribution and concentration of ADSC-EVs were quantified using the NanoSight (LM10; Malvern, Worcestershire, UK)33,34. First, the ADSC-EVs were resuspended in 1 ml of PBS and passed through a 0.22-μm filter (Pall Corporation, New York, NY, USA). Before loading the ADSC-EV suspension into the NanoSight LM10 sample chamber, it was diluted 2000-fold in PBS to achieve a particle concentration within the recommended measurement range (20–100 particles per frame). The software parameters for this analysis were set as follows: temperature at 20°C–23°C, and three frames captured per measurement. The particle size distribution and particle number of the ADSC-EVs were then measured.
ADSC-EV morphological analysis
The morphology of the ADSC-EVs was examined by transmission electron microscopy (TEM) 34 . A 10-μl aliquot of freshly isolated ADSC-EVs that were suspended in distilled water was applied onto a carbon-coated 200-mesh copper grid (Agar Scientific, Rotherham, UK) and allowed to dry at 37°C. The grid was subsequently stained with 1% phosphotungstic acid (Scharlau, Barcelona, Spain) and dried again at 37°C overnight. The grids were examined using a TEM (JEM-1400Plus; JEOL, Peabody, MA, USA) operated at an acceleration voltage of 80 kV, and digital micrographs were acquired.
ADSC-EV protein composition analysis
Western blotting was used to analyze the protein composition of ADSC-EVs 34 . Freshly isolated ADSC-EVs were immediately lysed in radioimmunoprecipitation assay (RIPA) buffer (Sigma‒Aldrich, St. Louis, MO, USA) supplemented with a protease inhibitor cocktail (Biotools, New Taipei City, Taiwan). The lysates were separated on 12% SDS–polyacrylamide gels (100 V, 2 h) and transferred onto polyvinylidene difluoride (PVDF) membranes (Bio-Rad Laboratories, Hercules, CA, USA). The PVDF membrane was blocked with 5% bovine serum albumin in PBS containing 0.1% Tween-20 (PBS-T) for 1 h at room temperature. Subsequently, the membrane was incubated at 4°C overnight with primary antibodies against CD9 (category no. 60232-1-lg; Proteintech Group, Rosemont, IL, USA; 1:1000), CD81 (category no. 66866-1-lg; Proteintech Group, Rosemont, IL, USA; 1:1000), Alix (Proteintech Group, Rosemont, IL, USA; category no. 12422-1-AP; 1:1000), CD44 (category no. 5640S; Cell Signaling Technology, Danvers, MA, USA; 1:1000), Calnexin (category no. GTX112886; GeneTex, Hsinchu City, Taiwan; 1:1000), and β-actin (category no. 66009-1-lg; Proteintech Group, Rosemont, IL, USA; 1:1000). After being washed three times with PBS-T, the membranes were incubated with horseradish peroxidase (HRP)-conjugated secondary antibodies (goat anti-mouse IgG [cat. no. C04001-100] or goat anti-rabbit IgG [cat. no. C04003-100]; Proteintech Group, Rosemont, IL, USA; 1:5000) at room temperature for 2–4 h. Protein bands were visualized using a chemiluminescence kit (SuperSignal West Pico PLUS Chemiluminescent Substrate; Thermo Fisher Scientific, Waltham, MA, USA), and signals were captured with a FUSION FX imaging system (Vilber Lourmat, Marne La Vallée, France).
Labeling of ADSC-EVs and their uptake by chondrocytes
Labeling of ADSC-EVs was performed according to our previous publication 33 . ADSCs were first labeled with CellTracker™ CM-DiI dye (Sigma‒Aldrich, St. Louis, MO, USA). Subsequently, EVs were induced, and CM-DiI–labeled ADSC-EVs were isolated by ultracentrifugation as described in an earlier subsection. For the uptake assay, chondrocytes were seeded onto six-well plates. After 24 h, the cells were cultured with CM-DiI–labeled ADSC-EVs at a concentration of 109 particles/ml. The culture medium was replaced every 2 days. At designated time points, the cells were fixed with 4% paraformaldehyde in PBS for 15 min. Chondrocytes were then stained with CellTracker™ Green CMFDA dye (Invitrogen, Carlsbad, CA, USA) for cell tracing, and nuclei were counterstained with 4’,6-diamidino-2-phenylindole (DAPI). The uptake of CM-DiI–labeled ADSC-EVs by chondrocytes was visualized using a confocal laser scanning microscope (Zeiss, Weimar, Germany), and images were acquired with an integrated digital camera.
ADSC-EV treatment of monolayer-expanded chondrocytes
Chondrocytes were expanded in monolayer culture in vitro for at least four passages before being used for experiments. Monolayer-expanded chondrocytes were seeded onto 24-well culture plates at a density of 105 cells per well and cultured for 24 h in basal medium composed of DMEM supplemented with 1% ascorbic acid, 1% NEAA, 1% penicillin/streptomycin, 1% ITS, and 10% FBS. After 24 h, the chondrocytes were treated with ADSC-EVs. The ADSC-EV suspension was freshly diluted in basal medium immediately before treatment. The chondrocytes were treated with ADSC-EVs (107–109 particles/ml) for 12 days. Two groups were examined in the present study, namely, (1) the control group, in which the cells were cultured in basal medium without ADSC-EVs treatment, and (2) the ADSC-EVs group, in which the cells were cultured in basal medium and treated with ADSC-EVs at the concentrations of 107–109 particles/ml. The medium was changed every 2 days. At specific time points, chondrocytes were collected for further experimental analysis.
Chondrocyte cell proliferation assay
Viable cell numbers were determined using the CellTiter 96® AQueous One Solution assay (Promega, Madison, WI, USA), a colorimetric method for assessing cell viability 37 . The mitochondrial activity of the chondrocytes cultured on wells was detected through the conversion of 3-(4,5-dimethylthiazol-2-yl)-2,5-diphenyltetrazolium bromide (MTS) into formazan by following the protocol employed in other studies37–39. Absorbance at 490 nm was measured to determine the amount of formazan generated, reflecting the number of viable cells 37 . At designated time points, a freshly prepared MTS reaction mixture diluted in basal medium at a 1:5 (MTS: medium) ratio was added to the wells containing chondrocytes and incubated for an additional 4 h at 37°C in an incubator with 95% air and 5% CO2. After incubation, 100 µl of the converted MTS product from each well was transferred to a 96-well plate, and absorbance at 490 nm was measured using a microplate reader (PathTech, Preston, Victoria, Australia) with KC Junior software.
RNA isolation and quantitative real-time polymerase chain reaction (real-time PCR)
At specific time points, the chondrocytes were collected. Total RNA was extracted from the cells using the TOOLSmart RNA Extractor (Biotools, New Taipei City, Taiwan). RNA quality was assessed by measuring the absorbance ratio at 260/280 nm with a NanoDrop 1000 spectrophotometer (Thermo Fisher Scientific, Waltham, MA, USA). According to the manufacturer’s guidelines, a 260/280 nm ratio between 1.8 and 2.0 was considered indicative of minimal DNA contamination. Subsequently, 0.5–1 µg of total RNA in a 20-µl reaction volume was reverse-transcribed into cDNA using the TOOLS Easy Fast RT Kit (Biotools, New Taipei City, Taiwan). Real-time PCR was performed with the TOOLS 2X SYBR qPCR Mix (Biotools, New Taipei City, Taiwan) on a qRT-PCR detection system (Bio-Rad Laboratories, Hercules, CA, USA). For each reaction, 2 µl of cDNA was used in a total volume of 25 µl to analyze the genes of interest. Previously published primer sequences were used to detect Col-II, Col-I, and glyceraldehyde-3-phosphate-dehydrogenase (GAPDH)32,40–45. The mRNA levels of these genes were quantified using the following PCR primer pairs: Col-II (forward: CAA CAC TGC CAA CGT CCA GAT; reverse: TCT TGC AGT GGT AGG TGA TGT TCT); Col-I (forward: GGC TCC TGC TCC TCT TAG; reverse: CAG TTC TTG GTC TCG TCA C); and GAPDH (forward: TCT CCT CTG ACT TCA ACA GCG AC; reverse: CCC TGT TGC TGT AGC CAA ATT C). The PCR cycling conditions were as follows: an initial incubation at 94°C for 1 min, followed by 35 cycles of denaturation at 94°C for 30 s, and annealing/extension at 59°C for 30 s. After amplification, a dissociation (melting) curve was generated to verify the specificity of the PCR products. The relative mRNA expression levels of the target genes were calculated from the threshold cycle (Ct) values and normalized to GAPDH expression using the comparative Ct method 46 . For each gene of interest, the readings of four wells from each experimental group were collected at every examined time point.
Senescence-associated β-galactosidase staining
Senescence was assessed using a senescence-associated β-galactosidase (SA-β-gal) staining kit (cat. no. 9860; Cell Signaling Technology, Danvers, MA, USA) following the manufacturer’s instructions. Briefly, chondrocytes were washed several times with cold PBS and fixed with 1 ml of fixing buffer for 15 min at room temperature. After an additional wash, the cells were incubated with 1 ml of staining solution overnight at 37°C. Images were acquired using a light microscope (TS2-S-SM; Nikon, Tokyo, Japan). SA-β-gal–positive cells were manually counted from microscopic images and normalized to the total number of cells to obtain the percentage of senescent cells.
Alcian blue staining for the detection of sGAG accumulation
To assess sGAG accumulation, chondrocytes were subjected to Alcian blue staining. Cells were first washed at least three times with PBS and then fixed overnight in 4% paraformaldehyde in PBS. Subsequently, sGAG staining was performed by incubating the cells with 0.1% Alcian blue 8GX in 0.1 M HCl for 2 h at room temperature. Images were acquired using a light microscope (TS2-S-SM; Nikon, Amstelveen, Netherlands).
Dimethylmethylene blue assay for the quantification of sGAG accumulation
Dimethylmethylene blue (DMMB) reacts with the sulfate group of the GAG chain 47 . Thus, sGAG accumulation in chondrocytes was quantified using the DMMB assay. At the designated time points, DNA content and sGAG levels were measured spectrofluorometrically using Hoechst 33258 dye (Sigma‒Aldrich, St. Louis, MO, USA) and DMMB, respectively47,48. A standard curve for the DMMB assay was generated using an aqueous solution of chondroitin sulfate C (Sigma–Aldrich, St. Louis, MO, USA) at concentrations ranging from 0 to 25 µg/µl.
Enzyme-linked immunosorbent assay
The concentrations of Col-I and Col-II synthesized by chondrocytes were quantified using human COL1A1 and COL2A1 enzyme-linked immunosorbent assay (ELISA) kits (cat. nos. RK01149 and RK01152, ABclonal®, Woburn, MA, USA), respectively. All assays were performed according to the manufacturer’s instructions. Absorbance was recorded at 450 nm using an automated microplate reader. For normalization, DNA content was measured using the Quant-iT PicoGreen dsDNA Assay Kit (Invitrogen, Carlsbad, CA, USA).
Western blot analysis
Chondrocytes were lysed using RIPA buffer supplemented with a protease inhibitor cocktail (Biotools, New Taipei City, Taiwan). Proteins were separated by 12% SDS–polyacrylamide gel electrophoresis (100 V, 2 h) and transferred onto a PVDF membrane (Bio-Rad Laboratories, Hercules, CA, USA). The membrane was then blocked for 1 h at room temperature with 5% bovine serum albumin in PBS containing 0.1% Tween-20 (PBS-T). Subsequently, the membrane was incubated at 4°C overnight with primary antibodies. The following primary antibodies were used: p53 (category no. ARG10519; Arigo, Hsinchu City, Taiwan; 1:1000), p21 (category no. ARG57928; Arigo, Hsinchu City, Taiwan; 1:1000), CDKN2A/p16INK4a (Abcam, Cambridge, UK; category no. ab108349; 1:1000), CD44 (category no. 5640S; Cell Signaling Technology, Danvers, MA, USA; 1:1000), SOX-9 (category no. MA5-17177; Thermo Fisher Scientific, Waltham, MA, USA; 1:1000), IL-1β (category no. 16806-1-AP; Proteintech Group, Rosemont, IL, USA; 1:1000), SAPK/JNKphospho (Thr183(221)/Tyr185(223) (category no. ARG51807; Arigo, Hsinchu City, Taiwan; 1:1000), SAPK/JNK (category no. ARG51218; Arigo, Hsinchu City, Taiwan; 1:1000), Phospho-p44/42 MAPK (Erk1/2) (category no. 8544S; Cell Signaling Technology, Danvers, MA, USA; 1:1000), p44/42 MAPK (Erk1/2) (category no. 4696S; Cell Signaling Technology, Danvers, MA, USA; 1:1000), Phospho-p38 MAPK-T180/Y182 (category no. AP0526; ABclonal, Woburn, MA, USA; 1:1000), p38 MAPK (category no. 14064-1-AP; Proteintech Group, Rosemont, IL, USA; 1:1000), and β-actin (category no. 66009-1-lg; Proteintech Group, Rosemont, IL, USA; 1:1000). After being washed three times with PBS-T, the membranes were incubated with HRP-conjugated secondary antibodies (goat anti-mouse IgG, cat. no. C04001-100, or goat anti-rabbit IgG, cat. no. C04003-100; Proteintech Group, Rosemont, IL, USA; 1:5000) at room temperature for 2–4 h. Protein bands were visualized using a chemiluminescence substrate (SuperSignal West Pico PLUS, Thermo Fisher Scientific), and signals were captured with a FUSION-FX imaging system (Vilber Lourmat, Marne La Vallée, France).
Three-dimensional pellet culture of chondrocytes
To examine the hyaline cartilage-generating capacity of chondrocytes, a three-dimensional chondrocyte pellet culture was used. Briefly, monolayer-expanded chondrocytes were treated with ADSC-EVs (109 particles/ml) for 5 days, and then chondrocytes were trypsinized. A total of 2 × 10⁵chondrocytes were resuspended in chondrogenic medium containing DMEM plus 10 ng/ml TGF-β1 (R&D systems, Minneapolis, MN, USA), 50 mM L-ascorbate-2-phosphate, and 6.25 mg/ml insulin 43 . The cell suspension was transferred into 15-ml centrifuge tubes and centrifuged at 300 × g for 10 min to generate cell pellets. The chondrogenic medium was refreshed every 2–3 days. Chondrocyte pellets were collected on day 14 for downstream analyses.
Histology (Safranin-O/fast green staining)
Chondrocyte pellets were fixed overnight at 4°C in 10% buffered formalin (Fisher Chemical, Hampton, NH, USA), dehydrated through graded ethanol, cleared in xylene, and embedded in paraffin. Paraffin blocks were sectioned at a thickness of 5 µm using a Leica microtome (RM2255; Leica Microsystems, Wetzlar, Germany). For Safranin O/Fast Green staining, sections were stained with hematoxylin (Dako, Carpinteria, CA, USA) for 3 min, followed by 0.1% Fast Green for 2 min, rinsed with 1% acetic acid, and then stained with 1% Safranin O (Millipore, Billerica, MA, USA) for 1.25 min. Histological images were captured using a microscope equipped with a color digital camera (Leica DM1000 LED; Leica Microsystems, Wetzlar, Germany).
Immunohistochemistry
Immunohistochemistry (IHC) was performed with the Mouse and Rabbit Specific HRP/DAB (ABC) Detection IHC kit (Abcam, Cambridge, UK, ab64264). Histological processing of chondrocyte pellet sections was carried out following the procedures outlined earlier. Sections were first blocked in 10% horse serum diluted in PBS for 1 h, followed by an overnight incubation at 4°C with primary antibodies targeting Col-II (Abcam, Cambridge, UK, ab34712; 1:20,000) and Col-I (Abcam, Cambridge, UK, ab34710; 1:20,000). The next day, the sections were incubated with biotinylated secondary antibodies for 1 h and subsequently treated with the Vectastain Elite ABC reagent (Vector Laboratories, Newark, CA, USA) for 30 min. Finally, the peroxidase substrate was applied, and the sections were incubated for time intervals optimized for each antigen. Following hematoxylin counterstaining, the slides were dehydrated, mounted, and coverslipped. Images of the IHC staining were acquired using a microscope fitted with a color digital camera (Leica DM1000 LED).
Small RNA profiling and Kyoto Encyclopedia of Genes and Genomes pathway/gene ontology enrichment analyses of ADSC-EVs
miRNA extraction
miRNA was isolated from ADSC-EVs using the EVmiR Extraction Kit (Topgen Biotech., Kaohsiung, Taiwan) according to the manufacturer’s instructions, and the purified miRNA from each sample was eluted in 20 μl of Low-salt Tris-EDTA buffer (low-TE buffer). miRNA concentrations were subsequently measured with a Qubit miRNA Assay Kit using a Qubit Fluorometer (Thermo Fisher Scientific, Waltham, MA, USA).
miRNA library construction for next-generation sequencing
A total of 7 μl of miRNA extracted from ADSC-EVs was used to generate the miRNA library using the VAHTS Small RNA Library Prep Kit for Illumina and the VAHTS Small RNA Index Primer Kit (Vazyme Biotech, Nanjing, China), following the manufacturer’s protocol. The resulting barcoded adapter-ligated library produced amplicons of approximately 142 bp, which were excised from a 4% agarose gel and purified with the FastPure Gel DNA Extraction Mini Kit (Vazyme Biotech, Nanjing, China). Microfluidic electrophoresis was then performed using the MultiNA MCE-202 DNA-2500 Kit (Shimadzu, Kyoto, Japan) to assess library concentration and confirm the expected 142-bp size distribution. The qualified pooled library (4 nM) was subsequently sequenced on an Illumina NextSeq 500 platform (single-end, 75-cycle run; San Diego, CA, USA). All procedures were conducted according to the manufacturer’s instructions.
Bioinformatics analysis
First, the CLIP Tool Kit (v.1.0.3) was applied to trim the 3’ ends of all reads to 34 bp, thereby removing the adapter sequence 49 . Next, reads corresponding to the expected insert size for mature miRNAs (approximately 15–30 bp) were retained using Filter FASTQ (v.1.1.5) 50 . The processed reads were then aligned to the human miRNA database (miRBase v22.1) using BWA (v.0.7.17.4) 51 . After the mapped reads of each sample were assembled and quantified using Linux commands, edgeR (v. 3.32.1) 52 was used to estimate the expression levels of all miRNAs. Differentially expressed miRNAs and genes were identified using a threshold of log2(fold change) > 1 or < −1 and a significance level of 0.05 in the R environment. The target genes of the highly differentiated expressed miRNAs were predicted using TargetScan version 7.2 (targetscan.org), miRanda (www.microrna.org) accessed on 06 April 2021, and miRDB (http://www.mirdb.org/) accessed on 06 April 2021. The processes that the target genes were associated with were determined by gene ontology (GO) and Kyoto Encyclopedia of Genes and Genomes (KEGG) pathway enrichment analyses through the use of ClusterProfiler (v. 3.18.1) 53 (P value < 0.05; q-value < 0.05), and ggplot2 (v. 3.3.3) 54 was used to visualize the enrichment plots. Small RNA-seq data based on NGS and next-generation sequencing are publicly available in the NCBI (https://submit.ncbi.nlm.nih.gov/subs/sra/) under the accession number SUB14607238.
Statistical analysis
Data are presented as the mean ± standard error of the mean (SEM) from combined experimental replicates. Statistical significance was assessed using one-way analysis of variance (ANOVA), followed by Scheffe’s post hoc test for multiple comparisons. A P-value < 0.05 was considered statistically significant.
Results
Serial passaging in monolayer in vitro induces chondrocyte dedifferentiation
To determine whether chondrocyte dedifferentiation occurs after serial passaging in monolayer in vitro, chondrocytes at the initial passage (passage 1: P1) were serially passaged in monolayer for an additional four passages (passage 5: P5). Cell morphology, along with the production of chondrogenic markers (Col-II and sGAG) and the fibrocartilage marker Col-I, was subsequently evaluated. Compared to chondrocytes at P1, chondrocytes at P5 showed an enlarged and flattened fibroblastic cell shape (Fig. 1a). The levels of Col-II and Col-I synthesized by chondrocytes at P1 and P5 were determined by IHC and ELISA. The IHC results showed more intense staining of Col-I and less intense staining of Col-II in chondrocytes at P5 than in chondrocytes at P1 (Fig. 1b). ELISA analysis was performed to further quantify the synthesis of Col-I and Col-II in chondrocytes at P1 and P5. The results demonstrated that P5 chondrocytes exhibited elevated Col-I level and reduced Col-II level compared with P1 cells (Fig. 1c, d). Moreover, the level of sGAG was decreased in chondrocytes at P5 compared with that in chondrocytes at P1 (Fig. 1e). The protein levels of SOX-9 in chondrocytes at P1 and P5 were further examined by Western blotting. The protein level of SOX-9 was significantly decreased in chondrocytes at P5 compared to that in chondrocytes at P1 (Fig. 1f). In summary, compared with chondrocytes at P1, chondrocytes at P5 displayed characteristics of dedifferentiation (Fig. 1). These results indicated that the serial passaging of chondrocytes in monolayer in vitro drives chondrocytes toward a dedifferentiated phenotype.

Dedifferentiation of monolayer-expanded chondrocytes. Chondrocytes were serially passaged in monolayer in vitro from passage 1 (P1: P1 group) to 5 (P5: P5 group), and the dedifferentiation of cells at P1 and P5 was analyzed. (a) The morphology of chondrocytes at P1 and P5. Scale bar: 100 μm. (b) Representative IHC images of Col-II (brown stained) and Col-I (brown stained) synthesized by chondrocytes at P1 and P5. Scale bar: 100 μm. (c) ELISA determining Col-II levels in chondrocytes at P1 and P5. (d) ELISA determining Col-I levels in chondrocytes at P1 and P5. (e) Dimethylmethylene blue (DMMB) assay determining total sulfated glycosaminoglycan (sGAG) levels normalized to the DNA concentration in chondrocytes at P1 and P5. (f) Protein expression levels of SOX-9 and β-actin in chondrocytes at P1 and P5 were detected by Western blotting. Quantification of SOX-9 and β-actin immunoblots. Protein expression levels are expressed relative to the chondrocytes at P1, which was defined as 1. The values are presented as the mean ± SEM (n = 4). (*) indicates P < 0.05, compared with the chondrocytes at P1 on the same day.
Senescence accompanies chondrocyte dedifferentiation after the serial passaging in monolayer
After discovering that serial passaging in monolayer induced chondrocyte dedifferentiation, we further determined if senescence was also induced in chondrocytes after serial passaging. To determine senescence, the cell proliferation and expression of senescence-associated markers, including SA-β-gal, p53, p21, and p16, were analyzed in chondrocytes at P1 and P5. To assess cell proliferation, chondrocytes at P1 or P5 were initially seeded at the same cell number and then cultured for 9 days, and the MTS assay was used. The result from the MTS assay showed decreased proliferation of chondrocytes at P5 compared to chondrocytes at P1 from day 1 to 9 (Fig. 2a). Next, the expression levels of senescence-associated markers, including SA-β-gal, p53, p21, and p16, were assessed. Increased staining for SA-β-gal was found in chondrocytes at P5 compared with that in chondrocytes at P1 (Fig. 2b). Compared with chondrocytes at P1, chondrocytes at P5 showed a greater number of positively stained areas and a higher number of SA-β-gal–positive cells per area (Fig. 2b). The protein levels of p53, p21, and p16 were evaluated by Western blot. Western blot analysis showed that p53 was not detected, and p21 was not changed in chondrocytes at P1 and P5 (Fig. 2c). The p16 level in P5 chondrocytes was markedly higher than that observed in P1 cells (Fig. 2c). These results indicated that dedifferentiation and senescence both occur when chondrocytes are serially passaged in monolayer.

Senescence of monolayer-expanded chondrocytes. Chondrocytes were serially passaged in monolayer from passage 1 to 5, and the senescence of chondrocytes at P1 (P1: P1 group) and P5 (P5: P5 group) was analyzed. (a) Cell proliferation of chondrocytes from day 1 to 9, measured with the MTS assay. (b) Senescence-associated β-galactosidase (SA-β-gal) staining showed SA-β-gal-positive chondrocytes, colored blue. The proportion of SA-β-gal–positive cells was quantified by normalizing the number of positive cells to the total number of cells within the analyzed area. (c) Protein expression levels of senescence markers (p53, p21, p16) and β-actin in chondrocytes were detected by Western blotting. Quantification of p21, p16, and β-actin immunoblots. Protein expression levels are expressed relative to the chondrocytes at P1, which was defined as 1. The values are presented as the mean ± SEM (n = 4). (*) and (**) indicate P < 0.05 and P < 0.01, respectively, compared with the chondrocytes at P1.
Monolayer-expanded chondrocytes cultured with ADSC-EVs–containing CM acquire enhanced proliferation and redifferentiation capacities
To determine whether ADSC-EV–containing CM has an effect on monolayer-expanded chondrocytes, chondrocytes at P5 were treated with induction medium (control group), CM containing CM-DiI–labeled ADSC-EVs (CM group), or ADSC-EVs–depleted CM (dEV group). The results indicated that the ADSC-EVs in the CM were internalized by chondrocytes. In the CM group, CM-DiI–labeled ADSC-EVs were already taken up by chondrocytes on day 1. From days 5 to 9, a greater accumulation of ADSC-EVs was observed within the cytoplasm and around the perinuclear region of chondrocytes in the CM group (Fig. 3a). Across days 1–9, chondrocytes in the control and dEV groups exhibited no evidence of ADSC-EV internalization (Fig. 3a).

Effect of ADSC-EV–containing conditioned medium (CM) on the proliferation and redifferentiation of monolayer-expanded chondrocytes. The chondrocytes at P5 were treated with induction medium (Control: control group), CM containing CM-DiI–labeled ADSC-EVs (CM: CM group), or CM depleted of ADSC-EVs (dEV: dEV group), and their proliferation and redifferentiation were analyzed. (a) Uptake of CM-DiI–labeled ADSC-EVs by chondrocytes in the three groups for 9 days was detected by confocal microscopy, and images were obtained using a camera. Green fluorescence stain, cytoplasm; blue fluorescence stain, cell nucleus; red fluorescence stain, CM-DiI–labeled ADSC-EVs. Scale bar: 100 μm. (b) Cell proliferation of chondrocytes from day 1 to 5, measured with the MTS assay. (c) The mRNA expression levels of Col-II and Col-I in chondrocytes on day 5 were measured. Gene expression levels are expressed relative to the control group, which was defined as 1. ELISA determining (d) Col-II and (e) Col-I levels in chondrocytes in the three groups on day 12. Protein expression levels are expressed relative to the control group, which was defined as 1. (f) Alcian blue staining of sGAG in the three groups on day 12. Blue: Alcian blue staining. (Scale bars = 20 µm). The total sGAG synthesis by chondrocytes in the three groups on day 12 was quantified by a DMMB assay. The sGAG level was normalized to the total DNA concentration in each group and was expressed as sGAG/DNA. The sGAG/DNA ratio of the treatment group was normalized to the that of the control group on day 12, which was defined as 1. The values are presented as the mean ± SEM (n = 4). (*) and (**) indicate P < 0.05 and P < 0.01, respectively, compared with the control group. (#) and (##) indicate P < 0.05 and P < 0.01, respectively, compared with the CM group.
To test whether ADSC-EVs in CM influence the functions of monolayer-expanded chondrocytes, chondrocyte proliferation and dedifferentiation were subsequently tested. The results showed that CM treatment enhanced chondrocyte proliferation and redifferentiation, whereas depletion of ADSC-EVs from the CM reversed these effects. Chondrocyte proliferation was elevated in the CM group relative to the control group but was reduced in the dEV group compared with the CM group (Fig. 3b). Moreover, Col-II mRNA expression was elevated, whereas Col-I mRNA expression was reduced in the CM group compared with that in both the control and dEV groups (Fig. 3c). The same results were found at protein level (Fig. 3d–e). Moreover, the same result was also found in the level of sGAG among the three groups (Fig. 1e). These results indicated that monolayer-expanded chondrocytes cultured with ADSC-EVs–containing CM acquired enhanced proliferation and redifferentiation capacities, and ADSC-EVs in the CM were responsible for this effect.
ADSC-EV characterization and intercellular communication with chondrocytes
ADSC-EVs obtained by ultracentrifugation from ADSC-cultured CM were characterized following the International Society for Extracellular Vesicles (ISEV) recommendations, namely the Minimal Information for Studies of Extracellular Vesicles 2018 (MISEV2018) and 2023 (MISEV2023) 55 . ADSC-EVs were obtained by ultracentrifugation from three separate batches of ADSC-cultured CM, followed by analyses of their particle size, particle number, morphology, and protein composition. The particle size and number of isolated ADSC-EVs were assessed by NTA, which showed a size distribution of 0–500 nm and mean particle diameters of 163.2 ± 14.2, 153.4 ± 10.8, and 154 ± 7.7 nm across the three batches (Fig. 4a, b). The mean particle sizes of ADSC-EVs across the three batches were comparable, with no significant differences detected (Fig. 4b). The concentrations of the ADSC-EVs in the CM were also calculated, and they were 4.66 ± 0.7, 4.76 ± 1.1, and 4.63 ± 1.0 × 10⁸ particles/ml. The results indicate that one ADSC can produce approximately 2.6 × 10⁴ ADSC-EVs following induction of EV secretion. The morphology of ADSC-EVs was further examined by TEM, which revealed that the vesicles exhibited a spherical shape (Fig. 4c). According to the ISEV guidelines, EV protein characterization should include at least three positive markers, with at least one transmembrane or lipid-bound protein, such as CD9, CD63, or CD81, and one cytosolic protein such as Alix, together with at least one negative protein marker, for example, β-actin or calnexin28,55. The Western blot analysis showed that ADSC-EVs expressed the EV markers CD9, CD81, Alix, and TSG-101, whereas β-actin and calnexin were not detected (Fig. 4d). Moreover, CD44 is a surface antigen highly expressed in ADSCs 56 , and we also found that ADSC-EVs were positive for CD44 (Fig. 4d). Taken together, these results confirmed that ADSCs secreted ADSC-EVs into the CM and that the vesicles were successfully isolated and further showed that the isolated ADSC-EVs met the MISEV2018 and MISEV2023 standards.

Characterization of ADSC-EVs and uptake by monolayer-expanded chondrocytes. ADSC-EVs were isolated from three separate batches of CM and characterized. (a) Particle size distribution of ADSC-EVs measured through nanoparticle tracking analysis (NTA). (b) Mean particle sizes of ADSC-EVs measured through NTA. Data are presented as the mean ± standard deviation (SD; n = 3). (c) Morphology of ADSC-EVs as observed using TEM. (d) Western blot analysis of the protein levels of CD9, CD81, TSG101, Alix, CD44, β-actin, and calnexin in ADSC (ADSC: ADSC group) and ADSC-EVs (ADSC-EVs: ADSC-EVs group). (e) Uptake of CM-DiI–labeled ADSC-EVs in monolayer-expanded chondrocytes detected by confocal microscopy. The chondrocytes were treated with CM-DiI–labeled ADSC-EVs at concentrations of 0 (Control: control group) or 1 × 10⁹ particles/ml (ADSC-EVs: ADSC-EVs group) for 9 days, and confocal images were obtained using a camera. Green fluorescence stain, cytoplasm; blue fluorescence stain, cell nucleus; red fluorescence stain, CM-DiI–labeled ADSC-EVs. Scale bar: 100 μm.
The intercellular communication of ADSC-EVs with monolayer-expanded chondrocytes was further confirmed. To assess ADSC-EV uptake, CM-DiI–labeled ADSC-EVs were cocultured with P5 chondrocytes, and their internalization was monitored over a 9-day period. Similar results were found for ADSC-EV–containing CM, as shown in Fig. 3a. On day 1, chondrocytes in the ADSC-EVs group showed only limited uptake of CM-DiI–labeled ADSC-EVs. From days 5 to 9, ADSC-EVs were observed within the cytoplasm and in the perinuclear region of chondrocytes in the ADSC-EVs group (Fig. 4e). In contrast, no ADSC-EVs were detected in the control group from days 1 to 9 (Fig. 4e).
ADSC-EV treatment redifferentiated monolayer-expanded chondrocytes
Since CM treatment was found to enhance the proliferation and reduce the dedifferentiation of monolayer-expanded chondrocytes (Fig. 3), and the concentrations of ADSC-EVs in the CM were measured as 4.66 ± 0.7, 4.76 ± 1.1, and 4.63 ± 1.0 × 10⁸ particles/ml (Fig. 4), we next examined whether ADSC-EVs alone could induce redifferentiation. Chondrocytes at P5 were treated with ADSC-EVs at concentrations ranging from 107 to 109 particles/ml, a range that encompasses the ADSC-EV concentrations detected in CM. The expression levels of Col-II, Col-I, sGAG, and SOX-9 were subsequently evaluated. The results revealed that ADSC-EV treatment redifferentiated the monolayer-expanded chondrocytes. The ELISA results showed that the levels of Col-II synthesized by chondrocytes were dose-dependently increased in the ADSC-EVs group (107–109 particles/ml) compared with those in the control group, which did not receive any ADSC-EV treatment (Fig. 5a). In contrast, the level of Col-I synthesized by chondrocytes was dose-dependently decreased in the ADSC-EVs group compared with that in the control group (Fig. 5b). The same results were found in the level of sGAG synthesis by chondrocytes determined by the Alcian blue staining and DMMB assay (Fig. 5c, d). The ADCSC-EV group exhibited more intense Alcian blue staining than the control group (Fig. 5c). In addition, the quantitative result of sGAG synthesized in chondrocytes was higher in the ADSC-EV group than that in the control group (Fig. 5d). The protein level of SOX-9 in monolayer-expanded chondrocytes was also significantly increased after ADSC-EV treatment (Fig. 5e). Overall, the results revealed that ADSC-EV treatment redifferentiates monolayer-expanded chondrocytes.

Effect of ADSC-EVs on the redifferentiation of monolayer-expanded chondrocytes. The chondrocytes at P5 were treated with ADSC-EVs at concentrations of 0 (Control: control group) or 107–109 particles/ml (ADSC-EVs: ADSC-EVs group) for 12 days, and their redifferentiation was analyzed. ELISA determines Col-II (a) and Col-I (b) levels in chondrocytes on day 12. (c) Alcian blue staining of sGAG on day 12. Blue: Alcian blue staining. (Scale bars = 50 µm). (d) The total sGAG synthesis by chondrocytes on day 12 was quantified by a DMMB assay. The level of sGAG was normalized to the total DNA concentration in each group and is expressed as sGAG/DNA. The sGAG/DNA ratio of the treatment group was normalized to that of the control group on day 12, which was defined as 1. (e) Protein expression levels of SOX-9 and β-actin in chondrocytes on day 12 were detected by Western blotting. Quantification of SOX-9 and β-actin immunoblots. Protein expression levels are expressed relative to the Control group, which was defined as 1. The values are presented as the mean ± SEM (n = 4). (*) and (**) indicate P < 0.05 and P < 0.01, respectively, compared with the control group. (#) and (##) indicate P < 0.05 and P < 0.01, respectively, between the two groups.
ASDC-EV treatment also rejuvenates monolayer-expanded chondrocytes
To determine whether ADSC-EVs also rejuvenate monolayer-expanded chondrocytes, chondrocytes (P5) were incubated with ADSC-EVs for 12 days, and chondrocyte proliferation and senescence-associated markers (p53, p21, p16, and SA-β-gal activity) were analyzed. To test the proliferation of chondrocytes, chondrocytes were incubated with various concentrations (107–109 particles/ml) of ADSC-EVs for 12 days. The results show that ADSC-EV treatment increased the proliferation of chondrocytes. The proliferation of chondrocytes was increased in the ADSC-EVs group compared to that in the control group at concentrations from 107 to 109 particles/ml (Fig. 6a). The analysis of senescence-associated markers revealed that ADSC-EV treatment reduced SA-β-gal levels and the protein level of P16 in chondrocytes. SA-β-gal levels in chondrocytes on day 12 were decreased in the ADSC-EVs group (109 particles/ml) compared with those in the control group (Fig. 6b). The same results were also found for the protein level of p16 in chondrocytes on day 12 (Fig. 6c, d). The protein levels of p21 in chondrocytes were not changed in both groups (Fig. 6c, d). These results indicated that ASDC-EVs rejuvenated the monolayer-expanded chondrocytes.
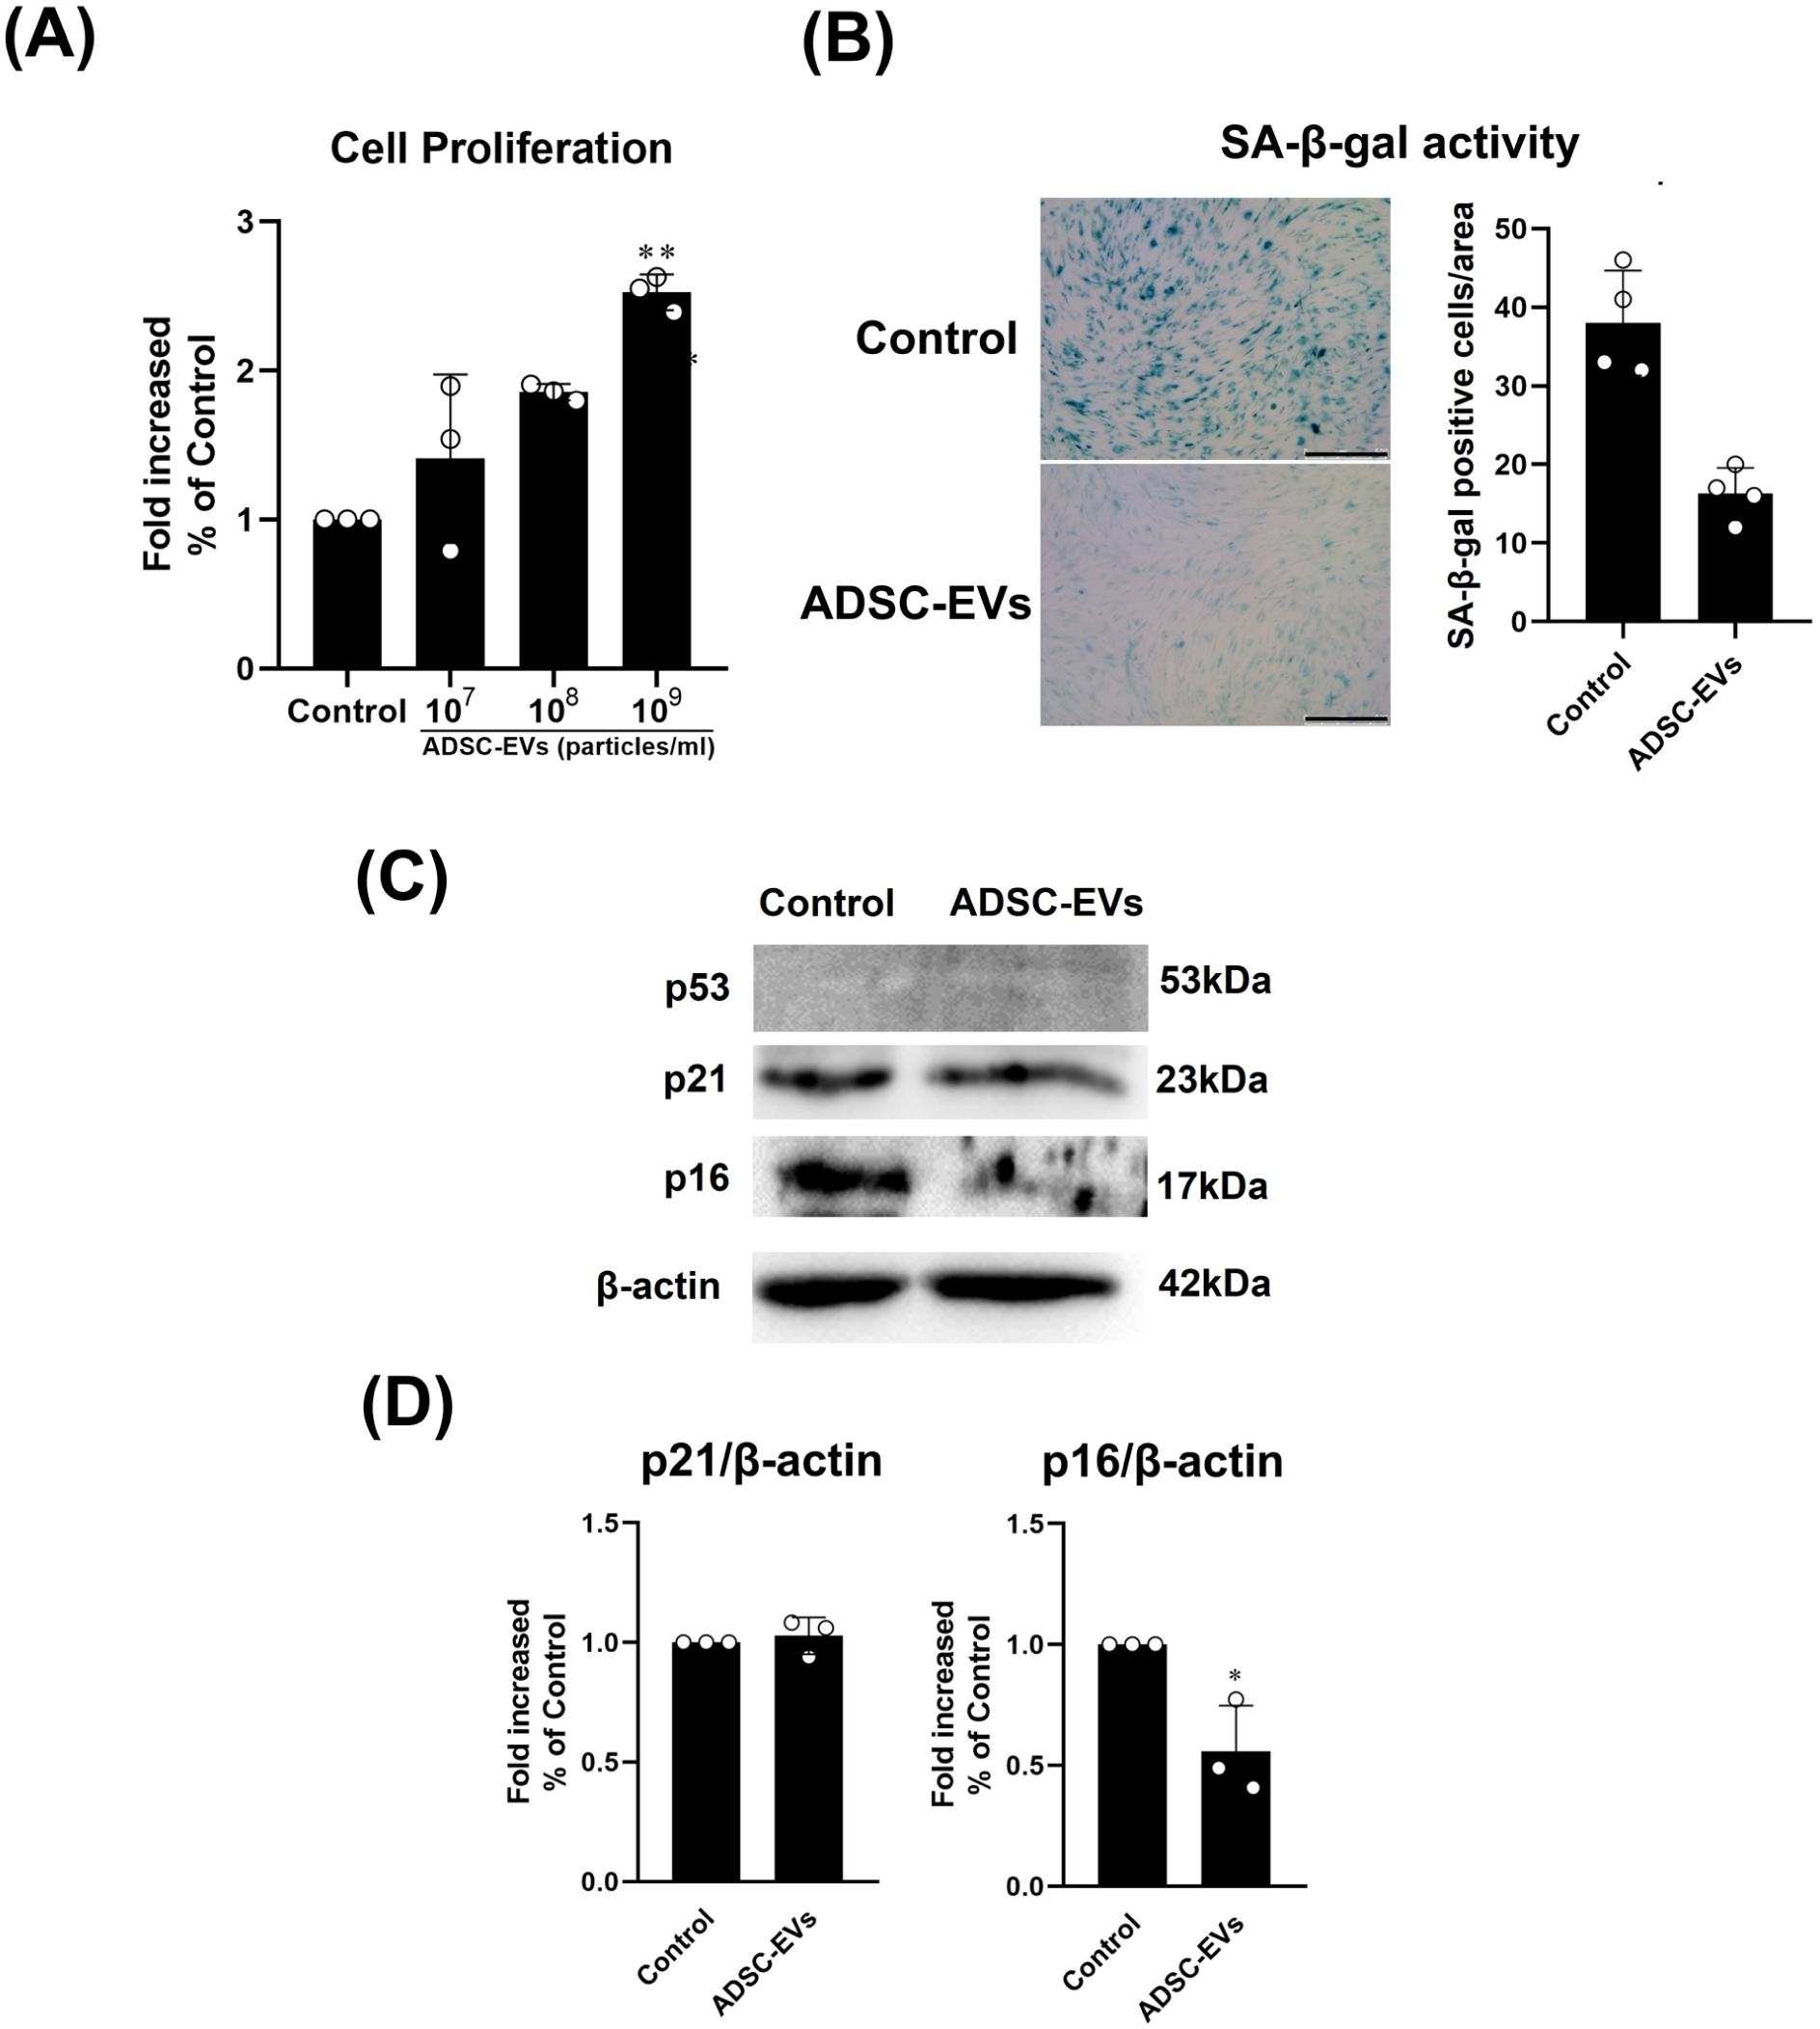
Effect of ADSC-EVs on the rejuvenation of monolayer-expanded chondrocytes. The chondrocytes at P5 were treated with ADSC-EVs at concentrations of 0 (Control: control group) or 107–109 particles/ml (ADSC-EVs: ADSC-EVs group) for 12 days and analyzed for dedifferentiation. (a) Cell proliferation of chondrocytes on day 5, measured with the MTS assay. The values are presented as the mean ± SEM (n = 4). (*) and (**) indicate P < 0.05 and P < 0.01, respectively, compared with the control group. (b) SA-β-gal staining showed SA-β-gal-positive chondrocytes (colored blue) on day 12. The proportion of SA-β-gal–positive cells was quantified by normalizing the number of positive cells to the total number of cells within the analyzed area. (Scale bars = 500 µm). (c) Protein expression levels of senescence markers (p53, p21, p16) and β-actin in chondrocytes on day 12 after ADSC-EV treatment were detected by Western blotting. (d) Quantification of p21, p16, and β-actin immunoblots. Protein expression levels are expressed relative to the Control group, which was defined as 1. The values are presented as the mean ± SEM (n = 4). (*) and (**) indicate P < 0.05 and P < 0.01, respectively, compared with the control group.
ADSC-EV treatment augmented hyaline cartilage formation in monolayer-expanded chondrocytes
We further confirmed whether ADSC-EVs promote hyaline cartilage formation in monolayer-expanded chondrocytes. The 2D-cultured monolayer-expanded chondrocytes (P5) were treated with ADSC-EVs (109 particles/ml) for 5 days. Then, a 3D cell culture was established with the monolayer-expanded chondrocytes and cultured in the chondrogenic medium for an additional 14 days to investigate neocartilage formation. The results showed that ADSC-EV treatment enhances the formation of hyaline cartilage, not fibrocartilage, in monolayer-expanded chondrocytes. The IHC and Safranin-O/Fast Green staining results showed more intense staining of Col-II and sGAG in the ADSC-EVs group than in the control group (Fig. 7a). In contrast, Col-I staining was reduced in the ADSC-EVs group compared with that in the control group (Fig. 7a). The DMMB assay for sGAG and ELISA for Col-II and Col-I was further used to determine the composition of the neocartilage generated by chondrocyte pellets. The results showed that cells from the ADC-EVs group displayed higher levels of Col-II and sGAG, as well as lower levels of Col-I, (Fig. 7b) than those from the control group. The results indicated that ADSC-EV treatment augmented hyaline cartilage formation in monolayer-expanded chondrocytes.
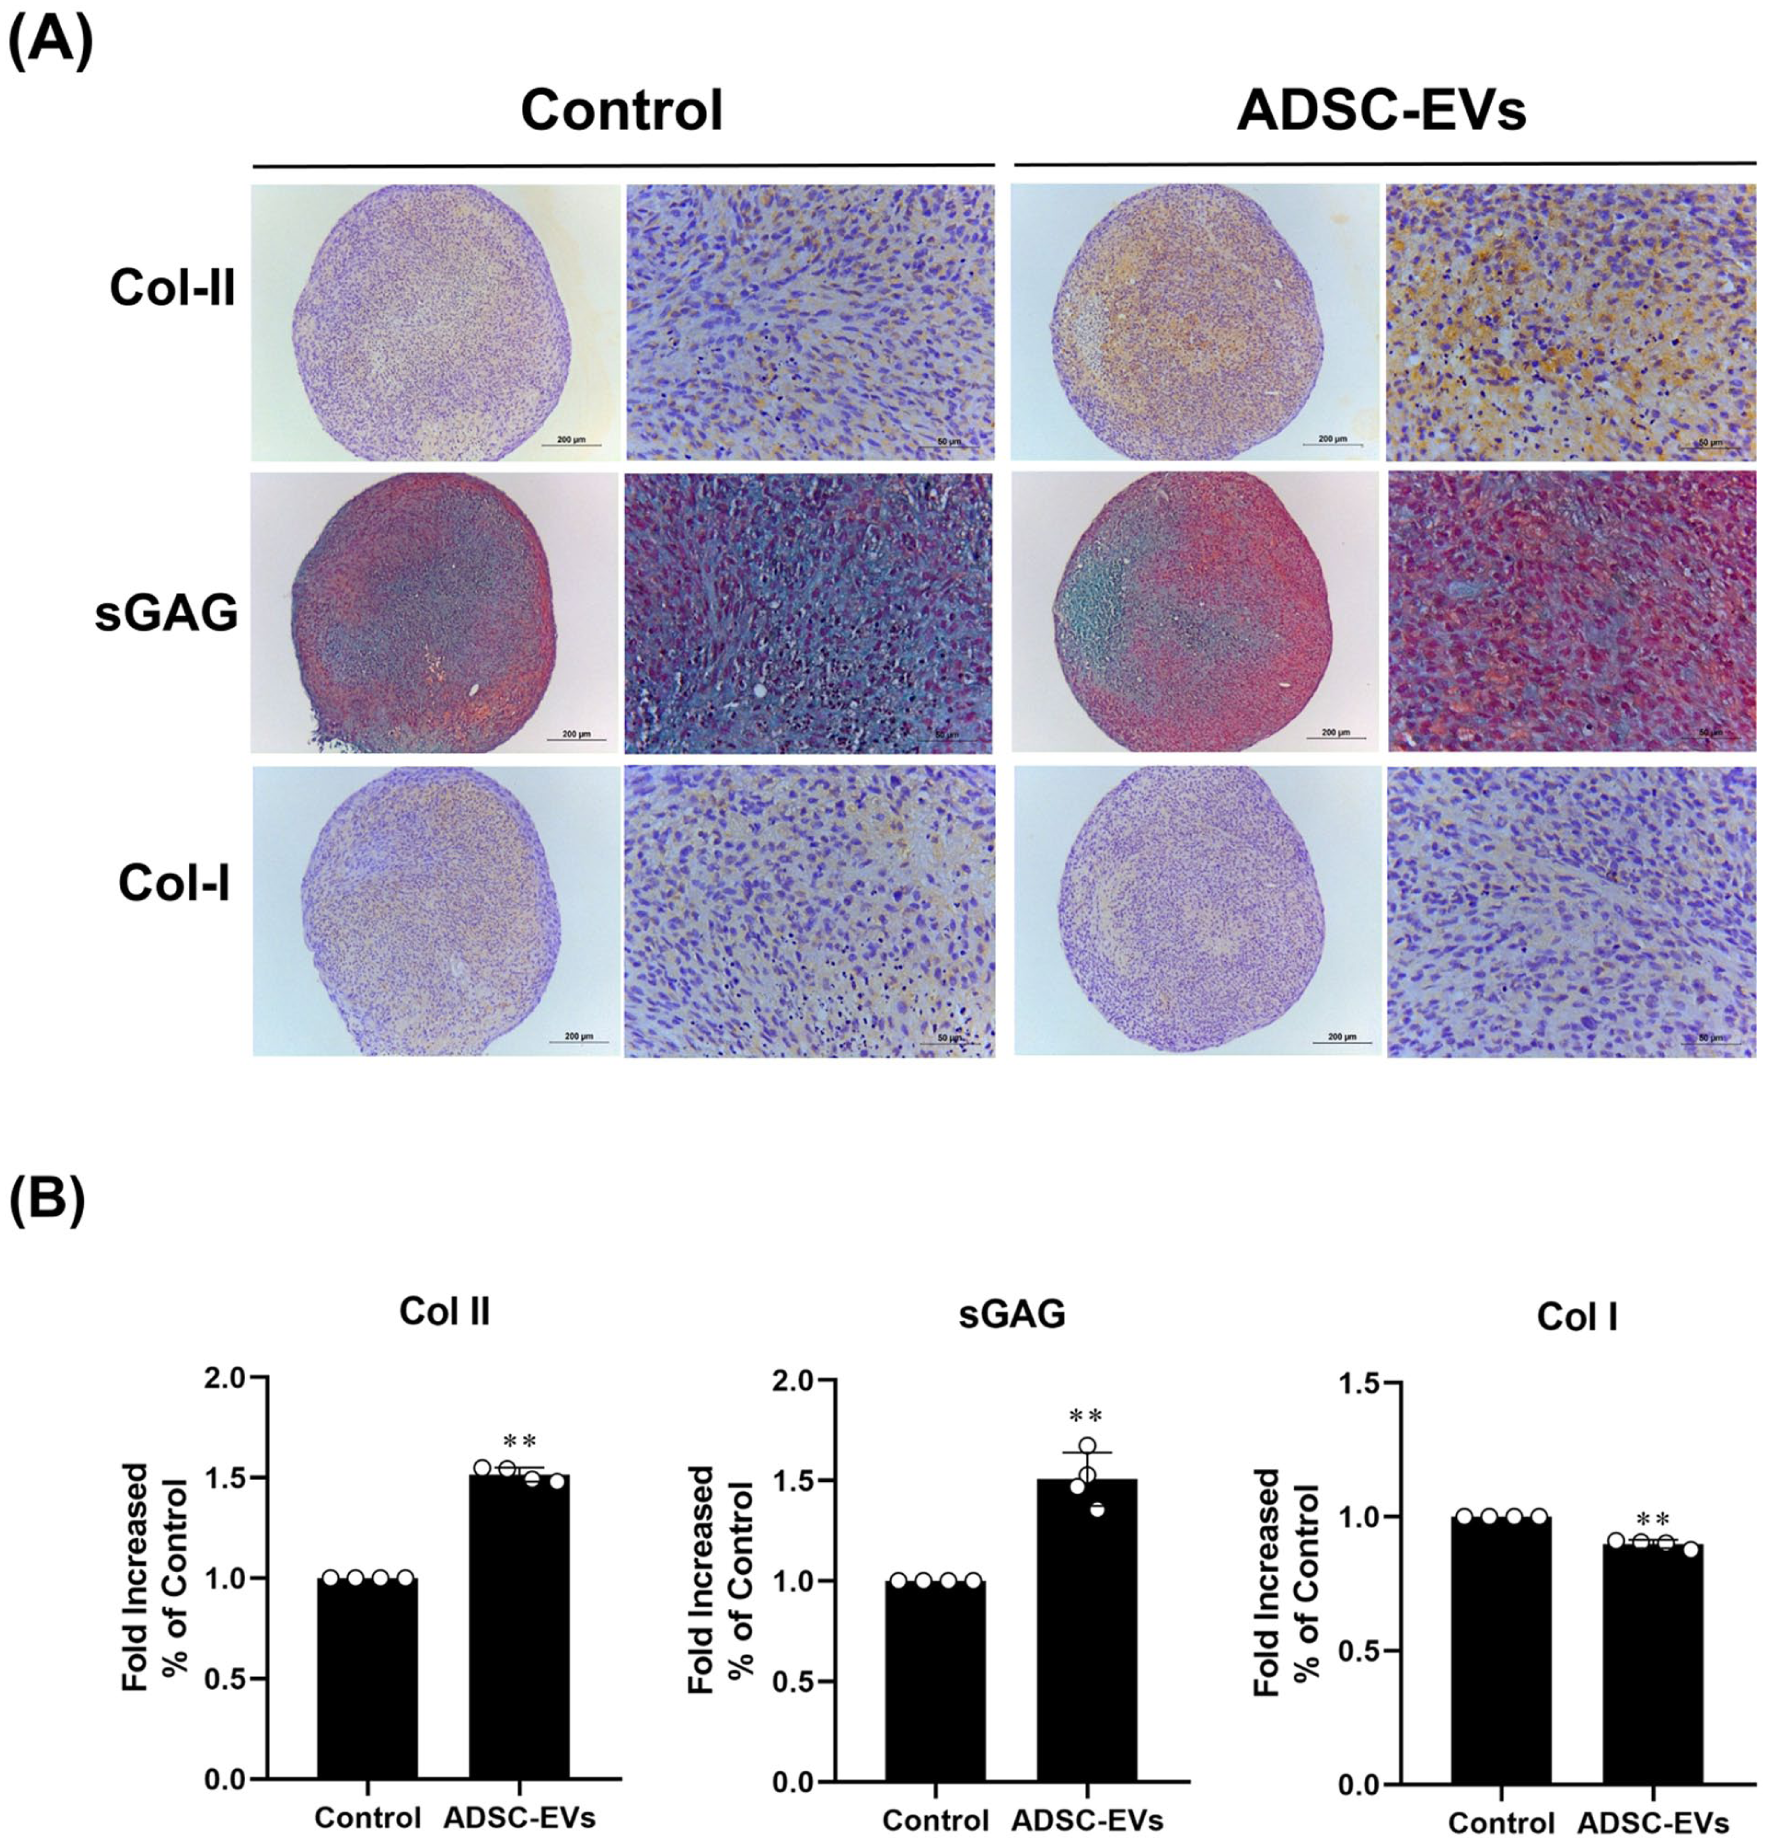
Effects of ADSC-EVs on the hyaline cartilage formation by monolayer-expanded chondrocytes in vitro. Chondrocytes at P5 were treated at concentrations of 0 (Control: control group) or 109 particles/ml (ADSC-EVs: ADSC-EVs group) for 5 days. Then, chondrocytes were established as 3D cell pellets and cultured in the chondrogenic medium for an additional 14 days to investigate hyaline cartilage formation. (a) Images of IHC staining to assess Col-II and Col-I expression. Brown: Col-II or Col-I staining. Blue: Hematoxylin staining. Images of Safranin O and Fast Green staining to assess sGAG levels. Red: Safranin O staining. Blue: Fast Green staining. (Scale bars = 100 µm). (b) Quantification of Col-II, sGAG/DNA, and Col-I levels using the ELISA analysis. Protein expression levels are expressed relative to the Control group, which was defined as 1. The values are presented as the mean ± SEM (n = 4). (*) and (**) indicate P < 0.05 and P < 0.01, respectively, compared with the control group.
ADSC-EV treatment reduced the protein levels of IL-1β and MAPK in monolayer-expanded chondrocytes
We confirmed the effect of ADSC-EVs on the protein levels of IL-1β and MAPK in the monolayer-expanded chondrocytes. The monolayer-expanded cells were treated with/without ADSC-EVs at a concentration of 109 particles/ml for 5 days. Then, the cells were collected and analyzed by Western blot. The results showed that ADSC-EV treatment reduced the protein levels of IL-1β and MAPK (p-P38 and p-ERK) in monolayer-expanded chondrocytes. In comparison to that in the control group, the expression of IL-1β in chondrocytes was downregulated in the ADSC-EVs group (Fig. 8a, b). Analysis of the MAPK pathway revealed that ADSC-EV treatment reduced the protein levels of p-P38 and p-ERK in chondrocytes (Fig. 8a, b). These results indicated that ADSC-EV treatment reduced the protein levels of IL-1β and MAPK in monolayer-expanded chondrocytes.

Effects of ADSC-EVs on IL-1β and MAPK activation of monolayer-expanded chondrocyte. Chondrocytes at P5 were treated with ADSC-EVs at concentrations of 0 (Control: control group) or 109 particles/ml (ADSC-EVs: ADSC-EVs group) for 5 days. (a) Protein expression levels of IL-1β, p-ERK, ERK, p-JNK, JNK, p-P38, P38, and β-actin were detected by Western blotting. (b) Quantification of IL-1β, p-ERK, ERK, p-JNK, JNK, p-P38, P38, and β-actin immunoblots. Protein expression levels are expressed relative to the Control group, which was defined as 1. The values are presented as the mean ± SEM (n = 4). (*) and (**) indicate P < 0.05 and P < 0.01, respectively, compared with the control group.
Bioinformatics analysis of ADSC-EV miRNAs
To analyze the miRNA profile of ADSC-EVs, three independent batches were isolated. The 10 miRNAs that were consistently detected across all three batches and showed the highest expression levels were ranked according to their total read counts (Fig. 9a) and further analyzed. We identified miRNAs that mitigate both senescence and dedifferentiation in chondrocytes. Among these 10 miRNAs, miR-122-5p and miR-21-5p have been identified as regulators of IL-1β in chondrocytes57,58. miR-199a-5p has been reported to regulate p38-MAPK signaling in chondrocytes 59 . We identified miRNAs that specifically mitigate chondrocyte dedifferentiation. miR-22-3p regulates histone deacetylase 4 (HDAC4), which is a chondrogenic regulator 60 . miR-27b-3p upregulates Col-II expression in chondrocytes 61 , and miR-532-5p decreases the expression levels of Col-I 62 . We also identified miRNAs that specifically reduce chondrocyte senescence. The let-7 family of miRNAs is essential for maintaining normal chondrocyte proliferation 59 . Moreover, beyond these findings, miR-4516 is also one of the highly expressed miRNAs detected in MSC-derived exosomes 63 .
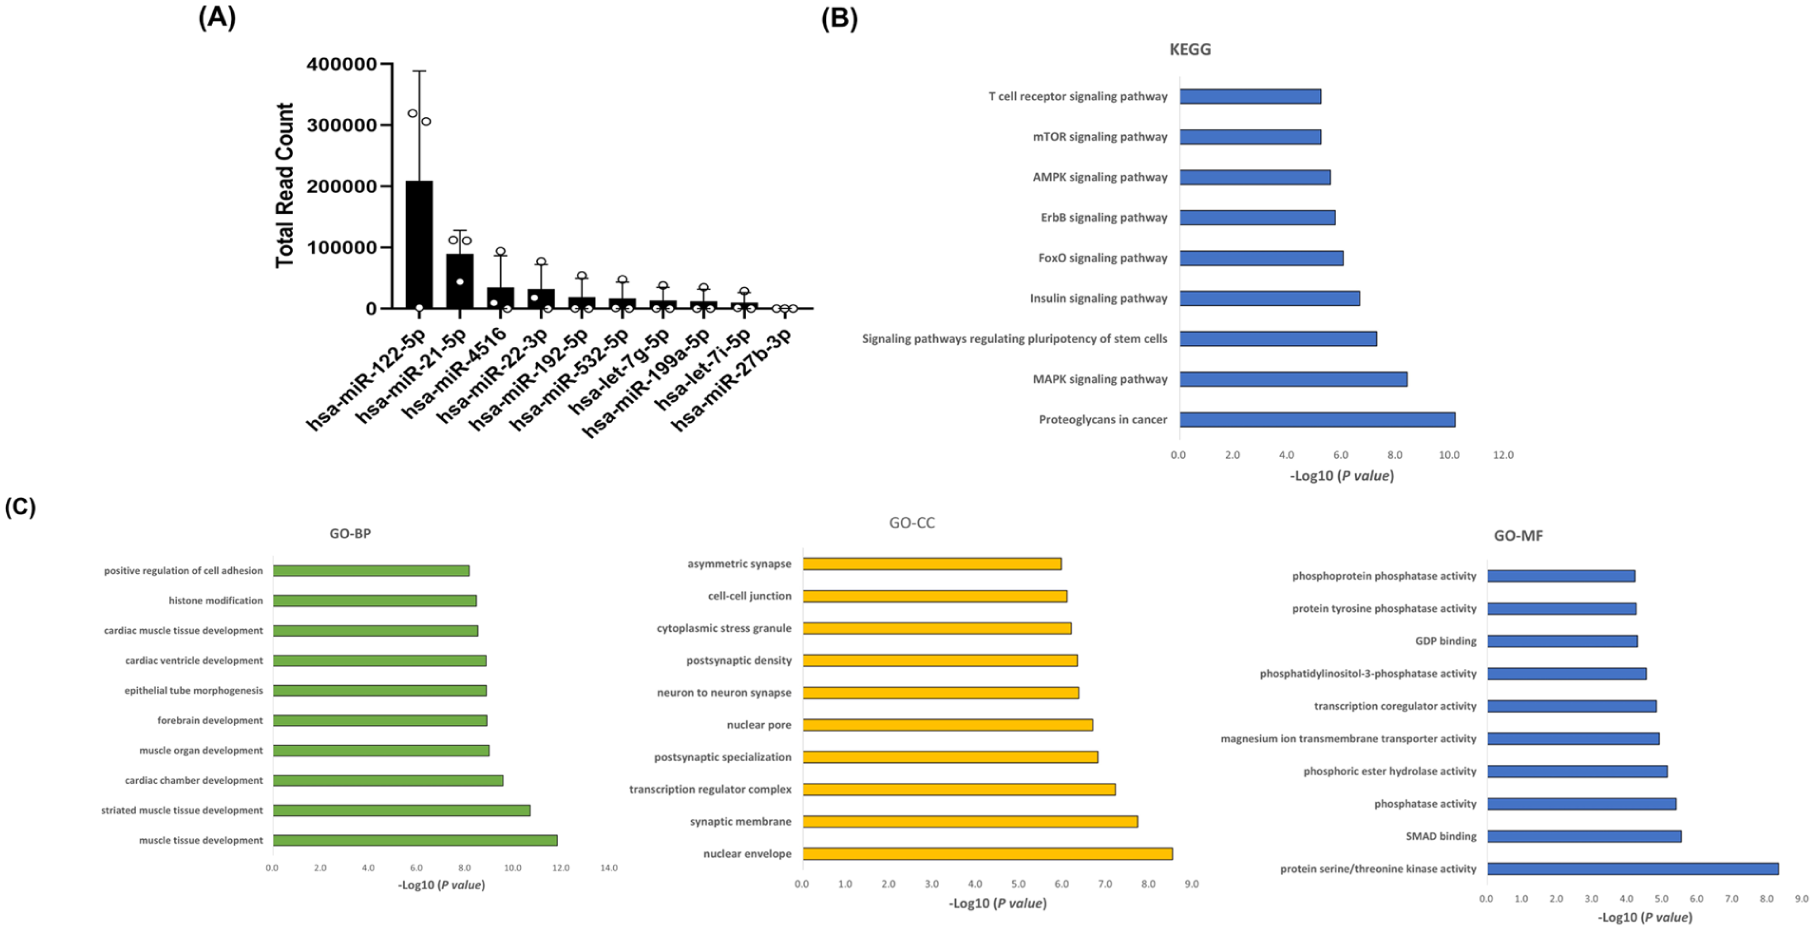
Bioinformatics analysis of ADSC-EV miRNAs. Next-generation sequencing (NGS) of (a) the top 10 known miRNAs that were identified in ADSC-EVs. Total read counts are shown (n = 3). The values are presented as the mean ± SEM. KEGG and GO pathway analyses were performed on target genes of miRNAs enriched in ADSC-EVs. The significantly enriched (b) KEGG pathways and (C) GO biological process (BP), cellular component (CC), and molecular function (MF) terms are presented. Only the 10 most relevant GO terms are shown.
These 10 miRNAs were subsequently analyzed using KEGG and GO to identify the biological processes and pathways enriched in ADSC-EVs. We performed KEGG pathway analysis to identify the major signaling pathways associated with ADSC-EVs (Fig. 9b). KEGG pathway enrichment indicated “Proteoglycans in cancer,” “MAPK signaling pathway,” “Signaling pathways regulating pluripotency of stem cells,” “Insulin signaling pathway,” and “FoxO signaling pathway” as enriched pathways (Fig. 9b). GO analysis revealed that “muscle tissue development” in the biological process (BP) category, “nuclear envelope” in the cellular component (CC) category, and “protein serine/threonine kinase activity” in the molecular function (MF) category were significantly enriched (Fig. 9c). Collectively, these results indicated the possible pathways the miRNAs within ADSC-EVs act through to prevent chondrocytes from undergoing dedifferentiation and senescence.
Discussion
ACI was first introduced by Brittberg et al. in 1994 64 , and it received Food and Drug Administration approval for the treatment of cartilage defects in 1997 65 . However, the clinical outcomes of patients treated with ACI remain suboptimal, as a substantial proportion of them develop fibrocartilage rather than hyaline cartilage3,66. During ACI, monolayer-expanded chondrocytes lose chondrogenic phenotype and undergo dedifferentiation and senescence 19 . Transplantation of such cells results in undesirable fibrocartilage formation in articular cartilage defects 19 . However, the current strategies for preventing fibrocartilage formation remain unsatisfactory. Therefore, a new method is required to enhance the therapeutic effect of monolayer-expanded chondrocytes in ACI. ADSC-based articular cartilage tissue engineering has been studied for articular cartilage defect regeneration. ADSC-EVs are known to participate in intercellular communication, and coculturing ADSCs with chondrocytes is commonly employed to enhance chondrogenesis and promote the formation of hyaline cartilage21,24–26,27. In this study, we demonstrate that ADSC-EVs mitigate dedifferentiation and senescence while promoting hyaline cartilage formation in monolayer-expanded chondrocytes, suggesting that ADSC-EVs may serve as an effective adjunct to improve the outcomes of ACI.
In ACI, dedifferentiation usually occurs in monolayer-expanded chondrocytes after an average of approximately five passages17,67. One study even reported rapid chondrocyte dedifferentiation after the first passage 67 . Articular cartilage consists of chondrocytes embedded within a hyaline cartilage matrix, which is primarily composed of Col-II and sGAG 1 . Fibrocartilage differs from articular cartilage in its collagen composition, exhibiting a higher Col-I to Col-II ratio; hyaline cartilage is rich in Col-II, whereas fibrocartilage contains elevated levels of Col-I 68 . During chondrocyte dedifferentiation, cells upregulate fibroblastic markers such as Col-I while downregulating chondrogenic markers, including Col-II and sGAG 17 . In addition, SOX-9 serves as a master regulator of the chondrocyte phenotype and is essential for the transcriptional activation of Col-II and sGAG synthesis 17 . Decreased expression levels of SOX-9 have also been reported during chondrocyte dedifferentiation 17 . In agreement with these previous reports, we also showed that monolayer-expanded chondrocytes undergo dedifferentiation after five passages by the appearance of a fibroblast-like phenotype, the loss of the chondrogenic phenotype, and SOX-9 downregulation (Fig. 1).
Senescent chondrocytes are characterized by decreased cell proliferation and upregulated expression of senescent markers 17 . SA-β-gal is one of the earliest biomarkers identified in cells exhibiting features of senescence 69 . Senescent cells typically show increased expression of p53, p21, and p16, which collectively contribute to cell-cycle arrest 70 . During senescence, p53 becomes activated and induces the expression of the cyclin-dependent kinase (CDK) inhibitor p21, a key mediator of senescence-associated growth arrest. p16, an inhibitor of CDK4 and CDK6, plays a critical role in maintaining long-term proliferative arrest 69 . Notably, p21 is activated early in the senescence process, whereas p16 is upregulated later to stabilize the senescent phenotype 69 . Articular chondrocytes with elevated p16 and p21 expression, along with increased SA-β-gal positivity, exhibit enhanced senescence17,70. Based on these studies, we tested the proliferation, SA-β-gal expression, and protein levels of p53, p21, and p16 in chondrocytes at P1 and P5. We show, compared with those at P1, chondrocytes at P5 show decreased proliferation, increased SA-β-gal expression levels, and upregulated protein expression of p16 (Fig. 2). Overall, we showed that monolayer-expanded chondrocytes are both dedifferentiated and senescent (Figs. 1 and 2).
ADSCs cocultured with chondrocytes have been shown to enhance chondrogenesis and hyaline cartilage formation21,24–26. It is thought that the coculture effect is either (1) chondrocyte-driven ADSC chondrogenic differentiation or (2) the secretome of ADSCs enhances the hyaline cartilage-forming capacity of chondrocytes21,24–26. ADSCs are known to participate in intercellular communication via their secretome 27 . Reports suggest that ADSC secretome enhances the ability of chondrocytes to generate hyaline cartilage rather than the chondrocytes themselves to drive ADSC-mediated chondrogenic differentiation21,24–26. In this study, we further proved that the ADSC secretome enhances cell proliferation and alleviates dedifferentiation of monolayer-expanded chondrocytes, and this effect is mainly through ADSC-EVs (Fig. 3). This result suggests that ADSC-EVs may be used to alleviate the dedifferentiation and senescence of monolayer-expanded chondrocytes to enhance hyaline cartilage synthesis by cells for more effective ACI.
To evaluate the ability of ADSC‑EVs to mitigate dedifferentiation and senescence in monolayer‑expanded chondrocytes and thereby enhance their capacity for hyaline cartilage synthesis. ADSC-EVs were isolated and characterized in compliance with MISEV2018 and MISEV2023 standards (Fig. 4) 55 . We show that ADSC-EVs interact with monolayer-expanded chondrocytes (Fig. 4) and alleviate dedifferentiation of cells by increasing the levels of Col-II and sGAG, decreasing the level of Col-I, and upregulating protein expression of SOX-9 (Fig. 5). Using a three-dimensional pellet culture, ADSC-EVs also enhance the hyaline cartilage-formation ability of monolayer-expanded chondrocytes by increasing the levels of Col-II and sGAG, as well as decreasing the level of Col-I (Fig. 7). On the other hand, chondrocyte senescence is thought to occur through two mechanisms: replicative senescence and SIPS 70 . Replicative senescence arises from telomere shortening, which activates the p53–p21 pathway to drive the senescent phenotype17,70. SIPS arises from oxidative stress and DNA damage independent of telomere attrition, with the p38–p16 signaling axis playing a central role in this process17,70. In this study, we show that ADSC-EVs enhance cell proliferation, decreased SA-β-gal expression levels, and downregulated protein expression of p16 in monolayer-expanded chondrocytes (Fig. 6). ADSC-EVs treatment did not change the protein expression of p21 in monolayer-expanded chondrocytes (Fig. 6). These results suggest that ADSC-EVs alleviate SIPS of monolayer-expanded chondrocytes and may act through reducing p38/p16 signaling pathway. Based on these results, we suggest that ADSC-EVs alleviate the dedifferentiation and senescence, as well as enhance hyaline cartilage synthesis of monolayer-expanded chondrocytes, and that they can be applied for more effective ACI.
To further elucidate the molecular mechanisms by which ADSC-EVs mitigate dedifferentiation and senescence in monolayer-expanded chondrocytes, we examined whether ADSC-EV treatment alters the protein levels of IL-1β, ERK, JNK, and p38. IL-1β and p38 MAPK are well-established negative regulators of the chondrogenic phenotype, and their upregulation directly contributes to the induction of chondrocyte dedifferentiation and senescence17,71,72. In dedifferentiated chondrocytes, IL-1β activates c-Jun-N-terminal kinase (c-JNK), extracellular-signal-regulated protein kinase (ERK), and p3817,72. ERK and JNK are two upstream signals that regulate p38 17 . p38 is a crucial member of the MAPK group that regulates chondrocyte phenotype 17 . Inhibition of p38 is known to redifferentiate dedifferentiated chondrocytes by improving morphology, upregulating Col-II and downregulating Col-I 17 . In addition, IL-1β is reported to induce senescence in chondrocytes by upregulating p16 protein expression and SA-β-gal levels 73 . In this study, we show that monolayer-expanded chondrocytes treated with ADSC-EVs decreased the protein levels of IL-1β, p-ERK, and p38 in monolayer-expanded chondrocytes (Fig. 8). The results suggest that ADSC-EVs alleviate the dedifferentiation and senescence of monolayer-expanded chondrocytes via suppression of IL-1β-induced MAPK signaling pathway.
EVs are recognized as key mediators of intercellular communication, functioning through the transfer of lipids, nucleic acids (including mRNAs and miRNAs), and proteins to recipient cells, thereby eliciting specific cellular responses 74 . Moreover, EV-derived miRNAs can modulate recipient cells by regulating the expression of coding genes at the posttranscriptional level 75 . Therefore, we analyzed and profiled the miRNAs of ADSC-EVs based on total read count. We found that these miRNAs within ADSC-EVs possibly contribute to the chondrogenic phenotype and the expression of IL-1β and p38-MAPK in chondrocytes (Fig. 9). We also performed KEGG pathway and GO analyses for miRNAs enriched in ADSC-EVs to clarify their possible molecular functions. The KEGG pathway analysis revealed that these miRNAs may contribute to dedifferentiation and senescence through the MAPK signaling pathway (Fig. 9b). The GO analysis also indicated certain BPs, CCs, and MFs that the miRNAs are enriched in (Fig. 9c). These results highlighted the possible contributions of ADSC-EV miRNAs in promoting the characteristic phenotype of chondrocytes. Our results suggest that ADSC-EVs maintain the chondrogenic phenotype of monolayer-expanded chondrocytes through miRNA regulation.
There are limitations in this study. First, the in vivo hyaline cartilage formation capacity of ADSC-EV-treated monolayer-expanded chondrocytes for articular cartilage regeneration should be further evaluated in animal models. Second, the precise molecular mechanisms by which miRNAs within ADSC-EVs regulate IL-1β-induced MAPK expression remain to be elucidated. Clarifying these pathways derived by these miRNAs will be essential for understanding their contributions to ADSC-EV–mediated redifferentiation and rejuvenation. Third, although our miRNA analysis identified 10 miRNAs that were consistently present across all three ADSC-EV batches derived from a single donor and showed strong associations with dedifferentiation and senescence, this finding does not eliminate the possibility of donor-to-donor variability. The miRNA cargo of ADSC-EVs may be different among donors, and such donor-dependent heterogeneity represents an important limitation of our study, as it may affect the reproducibility of EV-mediated effects. Future studies incorporating a larger and more diverse donor pool will be necessary to address this limitation.
Conclusion
The clinical success of ACI is fundamentally limited by the dedifferentiation and senescence that occur during monolayer expansion of chondrocytes, leading to suboptimal hyaline cartilage regeneration. This study identifies ADSC-EVs as a promising biologic intervention capable of restoring the chondrogenic phenotype of expanded chondrocytes by suppressing IL-1β–induced MAPK signaling and delivering miRNAs that counteract dedifferentiation and senescence. By improving the quality and functional capacity of chondrocytes prior to implantation, ADSC-EVs–based conditioning offers a translationally relevant strategy to enhance ACI outcomes and broaden its therapeutic effectiveness in cartilage repair
Footnotes
Acknowledgements
The authors would like to thank the Center for Research Resources and Development (CRRD) of Kaohsiung Medical University for their assistance in our nanoparticle tracking analysis and confocal image analysis. The authors would also like to thank the Core Facility Center of National Cheng Kung University for their assistance in our transmission electron microscopy analysis. The authors also thank Jhen-Wei Chen and Wan-Chun Huang for performing experiments in this study. Microsoft Copilot was used to assist in checking English grammar and improving the clarity of the language in this manuscript. The graphic abstract was generated with the assistance of Google’s Gemini model, which contributed to the illustration process. No scientific data has been generated or modified using AI.
Ethical Considerations
Not applicable.
Author Contributions
Conceptualization, Shun-Cheng Wu; methodology, Shun-Cheng Wu, Ling-Hua Chang, and Che-Wei Wu; validation, Shun-Cheng Wu, Ling-Hua Chang, Che-Wei Wu, and Chung-Hwan Chen; formal analysis, Shun-Cheng Wu, Ling-Hua Chang, Che-Wei Wu, and Chung-Hwan Chen; investigation, Shun-Cheng Wu, Ling-Hua Chang, Che-Wei Wu, Chung-Hwan Chen, Je-Ken Chang, and Mei-Ling Ho; resources, Shun-Cheng Wu, Je-Ken Chang, and Mei-Ling Ho; data curation, Shun-Cheng Wu, Je-Ken Chang, and Mei-Ling Ho; writing—original draft preparation, Shun-Cheng Wu; writing—review and editing, Shun-Cheng Wu; supervision, Shun-Cheng Wu, Je-Ken Chang, and Mei-Ling Ho; project administration, Shun-Cheng Wu, Je-Ken Chang, and Mei-Ling Ho; and funding acquisition, Shun-Cheng Wu, Je-Ken Chang, and Mei-Ling Ho. All authors have read and agreed to the published version of the manuscript.
Funding
The authors disclosed receipt of the following financial support for the research, authorship, and/or publication of this article: The authors acknowledge the grant support for this study provided by the National Science Council (NSC 109-2314-B-037 -028 -, NSC 109-2314-B-037 -144 -, NSC 110-2314-B-037 -031 -, NSC 110-2314-B-037-034 -MY3, and NSC 114-2314-B-264-002-). This study was partially supported by Kaohsiung Medical University Research Center (KMU- TC111A02-0 and KMU-TC112A02), and Kaohsiung Medical University Hospital (KMUH-SI11208, KMUH-SI11429 and KMUH-SI11430).
Declaration of Conflicting Interests
The authors declared no potential conflicts of interest with respect to the research, authorship, and/or publication of this article.
Data Availability Statement
Data supporting the study findings are available from the corresponding author Mei-Ling Ho (
Statement of Human and Animal Rights
This article does not contain any studies with human or animal subjects.
Statement of Informed Consent
Not applicable.