
Abstract
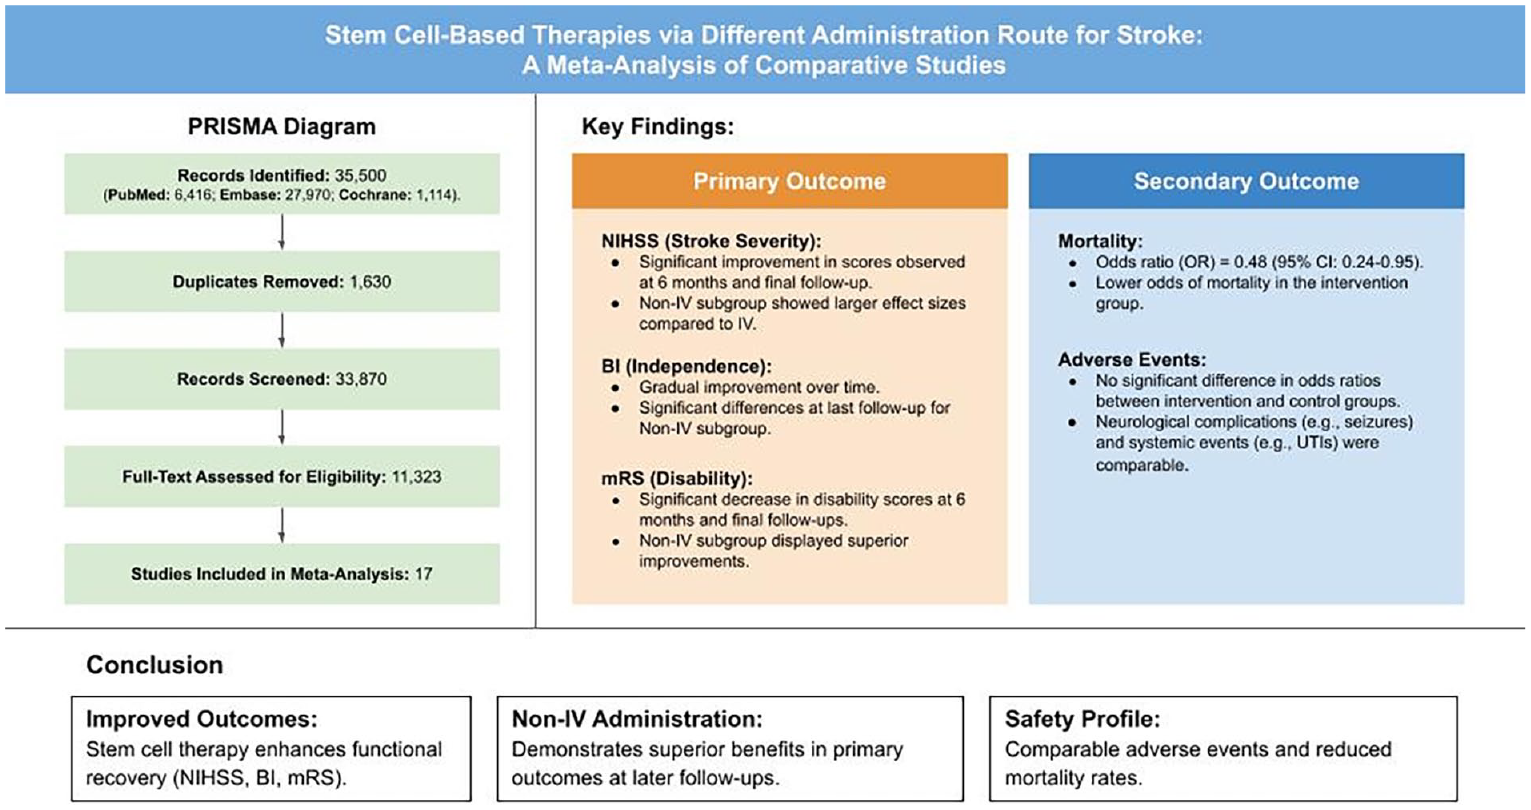
Stroke, a neurological condition from compromised cerebral blood perfusion, remains a major global cause of mortality and disability. Conventional therapies like tissue plasminogen activator are limited by narrow therapeutic windows and potential adverse effects, highlighting the urgency for novel treatments. Stem cell–based therapies, with their neuroprotective and regenerative properties, present a promising yet highly diverse alternative. By conducting literature search and data extraction from the PubMed, Embase, and Cochrane databases, this meta-analysis assessed the clinical efficacy and safety of stem cell–based therapies administered via intravenous (IV) and non-IV routes in 17 studies with stroke patients. Primary outcomes included the National Institute of Health Stroke Scale (NIHSS), Barthel Index (BI), and modified Rankin Scale (mRS), while secondary outcomes included mortality and adverse events. Results demonstrated significant improvements in NIHSS, BI, and mRS scores, particularly in non-IV groups within 6- and 12-month follow-ups, suggesting delayed but enhanced therapeutic efficacy. Mortality was reduced in both IV and non-IV groups, indicating treatment safety. Adverse events, categorized into neurological and systemic complications, showed no significant differences between intervention and control groups, further emphasizing the safety of stem cell therapies. Non-IV routes showed more long-term benefits, potentially due to enhanced cell delivery and integration. These findings demonstrate the potential of stem cell therapies to improve functional recovery and survival in stroke patients, regardless of administration route. However, the delayed response underscores the need for extended follow-up in clinical applications. Further research is required to standardize treatment protocols, optimize cell types and doses, and address patient-specific factors to integrate stem cell therapies into routine clinical practice.
Introduction
Stroke is a neurological disorder resulting from impaired blood perfusion to the brain. It is the second leading cause of mortality and a major contributor to long-term disabilities globally, with a mortality rate of 5.5 million and affecting approximately 13.7 million people each year. Ischemic stroke (IS), the most prevalent form, accounts for 87% of all stroke cases 1 . This type of stroke arises when clots form in the vessels, leading to a deficiency in blood and oxygen supply to the brain, causing neuronal death and irreversible neurological damage 2 .
To mitigate the devastating effects of stroke, various treatments are being developed. Intravenous (IV) thrombolysis with alteplase, a recombinant tissue plasminogen activator, is one of the few first-line therapies. It functions by converting plasminogen into plasmin to dissolve fibrin-based blood clots
3
. Despite being an effective standard treatment, the use of alteplase remains to have a limited usage rate of less than 15% due to its narrow therapeutic time window of 3 h from stroke symptom onset and age restriction of under 80 years4,5. Moreover, delayed alteplase treatment of over 4.5 h has been associated with hemorrhagic transformation, potentially leading to mortality. Neurotoxic effects were observed following alteplase administration as well, with the overactivation of N-methyl-
Recent studies have been conducted to develop novel treatments, such as the recent clinical trial on the recombinant plasminogen activator, reteplase. It is a treatment which has been approved for acute myocardial infarction, leading to the study by Li et al 9 , which compared it to alteplase. While results reported an excellent functional outcome improvement in the reteplase group, incidence of adverse events [eg, symptomatic intracranial (IC) hemorrhage] was equally high, further pushing the urgency for safer treatments with similar efficacy.
Advancements in cell transplantation have recently caught the spotlight in stroke treatment with its neuroprotective and neuroregenerative effects. These effects stem from its ability to differentiate into a diverse array of cell types and release various neurotrophic factors along with cytokines to replace damaged cells, in addition to other functions 10 . Mesenchymal stem cells (MSCs) have emerged as a promising treatment for stroke, with evidence suggesting they can restore lost brain function and improve outcomes6,11. MSCs are not only abundantly available, ensuring a consistent supply, but they also possess the versatility to differentiate into various cell types 12 . These cells contribute to the repair of damaged tissue via their anti-inflammatory and immunomodulatory properties, which prevent adverse immune reactions13,14. Additionally, MSCs may exert paracrine effects that potentially enhance the cells’ self-repair capabilities 12 .
Aside from MSCs, bone marrow mononuclear cells (BM-MNCs) are widely used in stroke treatment 15 . BM-MNCs comprise MSCs, hematopoietic stem cells, neural stem cells, embryonic stem cells, and human-induced pluripotent stem cells 16 . BM-MNCs are favorable due to their rapid differentiation capacity and ability to activate angiogenesis in ischemic tissue 15 . Furthermore, BM-MNCs can reduce autophagy after a stroke, leading to decreased infarction volume and neuroinflammation17,18.
Endothelial progenitor cells (EPCs) and peripheral blood stem cells (PBSCs) are types of stem cells with the potential to treat stroke. EPCs, known as precursors to endothelial cells (ECs), contribute to endothelial repair and angiogenesis in ischemic areas and aid tissue repair by secreting cytokines and differentiating into ECs19–21. Conversely, PBSCs improve neurological function and motoric problems following IS by improving electrophysiological activity between the brain and limbs22,23.
To assess the efficacy of stem cell therapy for stroke treatment, several clinicometric stroke scales are used. The National Institute of Health Stroke Scale (NIHSS), Barthel Index (BI), and modified Rankin Scale (mRS) are widely used by vascular neurologists globally 24 . The NIHSS is used to evaluate neurological outcomes, stroke severity, and the degree of recovery of patients with stroke24–26. The BI assesses the functional independence of stroke patients in personal care and mobility, especially during rehabilitation27–29. The mRS is employed post-stroke and post-treatment to determine treatment success30,31. Treatment success can be concluded by observing and interviewing patients and their caregivers.
With the assortment of studies on stem cell–based therapies via different administration routes to treat stroke, there is a need to evaluate the effectiveness on functional recovery and risks of these study results for a better understanding of its prospective use. This meta-analysis evaluated and compared the primary and secondary clinical outcomes of stem cell therapy in patients with stroke based on the mode of administration (MOA), specifically intraventricular versus non-intraventricular. The primary clinical outcomes included NIHSS, BI, and mRS scores collected at baseline, and at 6-month, 12-month, and last follow-ups. Secondary outcomes consisted of mortality and adverse events, which were further classified into neurological and systemic complications.
Materials and Methods
Including and Excluding Criteria
Studies eligible to be included in this analysis were full-text randomized, non-randomized, and prospective clinical trials that enrolled adult patients with acute to chronic stage stroke undergoing stem cell therapy. These studies were required to include at least one outcome measure indicating patient condition improvement (eg, NIHSS, BI, mRS). Exclusion criteria encompassed review articles, unpublished articles, abstracts, and studies not written in English.
Outcome Measurements
The primary clinical outcome measurements utilized in this analysis are the NIHSS, BI, and mRS. The NIHSS quantifies stroke severity on a scale of up to 42 points, the BI assesses functional independence with a maximum score of 100 points, and the mRS evaluates disability or dependence in daily activities, scoring up to 6 points.
Secondary outcomes assessed in this analysis comprised mortality and adverse events from each study, which were evaluated to determine the safety profile of stem cell therapy in stroke treatment.
Search Method
The studies reported in this meta-analysis were identified and assessed according to the Preferred Reporting Items for Systematic Reviews and Meta-Analyses (PRISMA) guidelines. The studies incorporated into this analysis were sourced by two authors independently conducting searches across the PubMed, Embase, and Cochrane scientific databases. The search strategy employed keywords, such as “stroke,” “stem cell therapy,” “mesenchymal stem cells,” and “bone marrow mononuclear cells,” in conjunction with Boolean operators “AND” and “OR.” The search results were subsequently refined to include only open-access studies published in English between January 2006 and September 2024.
Study Selection and Data Extraction
Studies retrieved from the databases were initially independently selected by two reviewers (G.M. and N.A.) according to inclusion criteria and organized by EndNote X9. Any disagreements between two reviewers were resolved by a third reviewer (J.O.). The chosen studies were fully reviewed to summarize the data. A spreadsheet was used to compile the extracted information from each study, which included: (1) general details about the study, such as study design [randomized controlled trial (RCT), non-RCT, etc.], country, and the Newcastle-Ottawa Scale (NOS) for non-randomized studies; (2) intervention-related information, including cell type, dose, administration route, and days of the procedure; (3) patient-related information, such as stroke type, number of participants and their assigned group, average age of intervention and control groups, and gender distribution within each group.
Risk of Bias Analysis
Risk of bias analysis was conducted using the Risk of Bias 2 tool for randomized studies based on either the intention-to-treat (ITT) or per protocol (PP) approach, with authors independently responding to the provided questions or statements, and the NOS for non-randomized studies. The results were combined and synchronized to produce a risk-of-bias table and a summary of the bias risk assessment, which were considered in determining the eligibility of studies for inclusion in the meta-analysis. Discrepancies in the risk of bias analysis were resolved by objective discussion based on study data and available Appendix.
Statistical Analysis
R (version 4.3.2) was used to perform the meta-analysis for the mean differences and 95% confidence intervals (95% CIs). An effect with a P-value <0.05 was set to be statistically significant. Heterogeneity within the forest plots was analyzed using the I2 statistic. According to the Cochrane Handbook 32 , the I2 value smaller than 40% might not be important; 30–60% may represent moderate heterogeneity; 50–90% may represent substantial heterogeneity; and 75–100% is considerable heterogeneity. In addition, a fixed-effect model is suggested for high heterogeneity.
Result
Literature Search Outcome
The database searches from three scientific databases generated a total of 35,500 papers (Fig. 1). PubMed contributed 6,416 papers, Embase 27,970, and Cochrane 1,114. After removing 1,630 duplicate papers, 33,870 remained. Screening by title led to the exclusion of 22,547 papers for irrelevance to the meta-analysis topic. Further screening of 11,323 papers for eligibility based on the presence of quantitative primary outcomes resulted in the exclusion of 11,306 studies. Therefore, 17 papers were finally included in the meta-analysis.

Identification of studies via databases.
Study Characteristics
The characteristics of the 17 selected studies were evaluated and are summarized in Table 1. This table provides details on each study, including the author, publication year, country, study design, MOA, cell type, cell dose, stroke type, days post-onset, participant information, and NOS. The study designs encompass both RCTs and non-RCTs, involving patients at various stages of IS or intracerebral hemorrhage (ICH). These patients were treated with injections of BM-MNCs, bone marrow mesenchymal stem cells (BMSCs), EPCs, MSC, or PBSCs at specified time points after stroke onset. The cells were administered in varying dosages via IV, intra-arterial (IA), IC, or lumbar puncture routes. Additional participant information in the table includes the number of participants, gender (male or female), and mean age.
Summary of Study Characteristics.

BM-MNC: bone marrow mononuclear cell; BMSC: bone marrow stem cell; C: control; EPC: endothelial progenitor cell; F: female; I: intervention; IA: intra-arterial; IC: intracranial (perilesional); ICH: intracerebral hemorrhage; IS: ischemic stroke; IV: intravenous; M: male; MOA: mode of administration; MSC: mesenchymal stem cell; NOS: Newcastle-Ottawa Scale; PBSC: peripheral blood stem cell; RCT: randomized clinical trial.
The studies employing an ITT approach generally demonstrated a low risk of bias throughout all parameters, except for the randomization process, which was compromised by inadequate blinding in one study. In contrast to the ITT approach studies, the risk of bias for PP approach studies ranged from a few concerns to a high risk of bias, potentially due to the outcome measurement method and reported result selection (Appendix Figures A1 and B1). However, other aspects of the studies, such as the randomization process, adherence to intended interventions, and outcome data, exhibited a low risk of bias. All non-randomized studies demonstrated an NOS score of 6 or above, as shown in Table 1, indicating fair to good scores with a low risk of bias.
Primary Outcomes
The NIHSS outcomes of four studies at various time points (baseline, 3-month, 6-month, 12-month, and last follow-up) with different MOAs (IV and non-IV) were compared, and a forest plot was generated for each time point (Fig. 2). The last follow-up for Ghali et al 39 was at 4 months; for Bhatia et al 35 , Li et al 44 , and Moniche et al 45 , were at 6 months; for Chen et al 23 and Prasad et al 46 , at 12 months; for de Celis-Ruiz et al 36 , Hess et al 40 , and Jaillard et al 41 , at 2 years; for Fang et al 38 , at 4 years; and for Jin et al 42 , at 7 years.
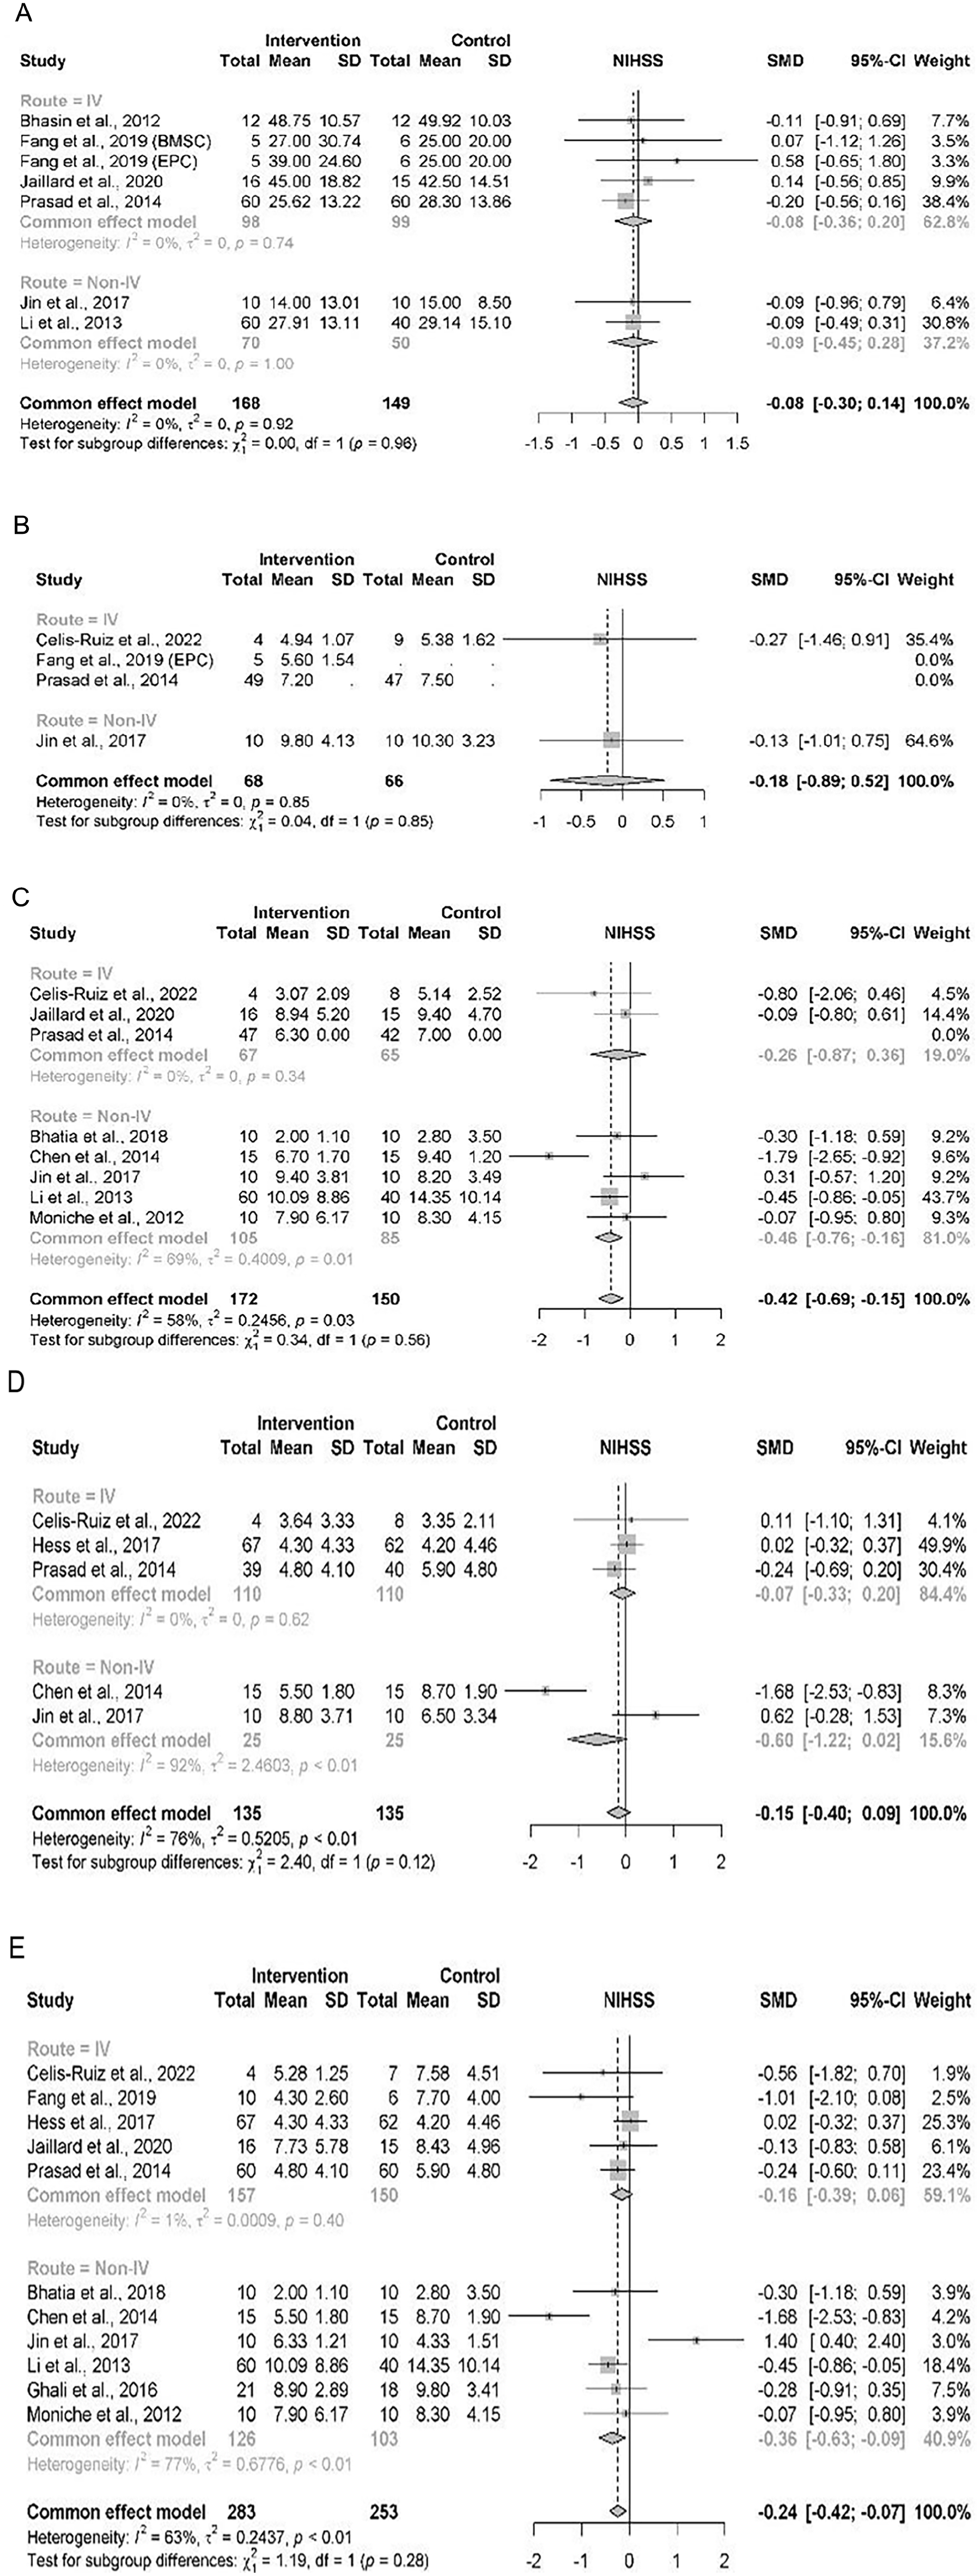
Subgroup forest plot of NIHSS outcome by MOA at (A) baseline, (B) 3-month follow-up, (C) 6-month follow-up, (D) 12-month follow-up, (E) last follow-up.
The baseline forest plot revealed an expected shift to the right, indicating higher NIHSS scores, whereas subsequent forest plots demonstrated a shift to the left, indicating a decrease in NIHSS scores. This pattern highlights the potential of stem cell treatments to decrease stroke severity. The baseline comparability can be confirmed as there was no significant difference between the intervention and control groups. While the 3-month and 12-month follow-up plots showed no significant differences, a trend toward improvement can be noted in the non-IV subgroup of the 3-month follow-up, though not statistically significant. In contrast, the 6-month and final follow-up plots revealed significant differences between the studies, with an overall SMD of −0.42 (95% CI: −0.69 to −0.15) and −0.24 (95% CI: −0.42 to −0.07), respectively, hence indicating moderate improvements in the intervention group, primarily driven by the work by Li et al 44 , study which showed a substantial decrease in NIHSS score.
For the MOA subgroup, the result for the studies in the IV group indicated no significant differences at any time point, while the effect of the studies in the non-IV group showed significant differences at 6-month, 12-month, and final follow-up assessments. While the 6-month and last follow-up differences can be accounted for by the study by Li et al 44 , the difference in 12-month follow-up may be influenced by the sample size and the Jin et al’s 42 study showing an unfavorable spike.
Low heterogeneity (I2 < 75%) was observed at baseline, 3-month, 6-month, and last follow-ups, suggesting consistent results among studies. Conversely, the 12-month follow-up exhibited high heterogeneity (I2 > 75%). This high heterogeneity is speculated to mainly be caused by non-IV studies which showed contrasting results when comparing the treatment to the control group, with the Jin et al’s 42 study, study mentioned previously showing significant variability in outcome. In addition, it is notable that the Jin et al’s 42 study employed an administration route of lumbar puncture, which may potentially affect the results when compared to other non-IV studies which favored IC or IA routes. This variability is evident in the heterogeneity score of the 6-month (I2 = 58%) and 12-month (I2 = 92%) follow-up, emphasizing the possible effects of differences in study designs or protocols.
Despite the differences in MOA, the trend in NIHSS decrease for both MOA subgroups was comparable, as reflected by the relatively low heterogeneity between groups. For instance, the last follow-up showed a non-significant (P > 0.05) subgroup difference to reflect the consistency and comparability of treatment effect in the IV and non-IV subgroups. This may indicate that the difference in MOA may not be a major factor influencing the treatment effect, suggesting that overall effectiveness of stem cell therapy may be more dependent on other factors (eg, cell type, dose, timing).
Similar to the NIHSS, we conducted a quantitative comparison for the BI using forest plots at baseline, 6-month follow-up, and last follow-up, as well as comparisons between the two MOA subgroups of IV and non-IV (Fig. 3). The last follow-up for Bhasin et al 33 , Li et al 44 , and Prasad et al 46 was at 6 months; for Ghali et al 39 , at 12 months; for Jaillard et al 41 , at 2 years; for Fang et al 38 , at 4 years; and for Jin et al 42 , at 7 years.

Subgroup forest plot of BI outcome by MOA at (A) baseline, (B) 6-month follow-up, (C) last follow-up.
Observation of the baseline forest plot demonstrated an expectedly low BI score, as indicated by the shift to the left. In contrast, the 6-month and last follow-up plots demonstrated a gradual increase, evidenced by their shift to the right, indicating an improvement in BI scores.
A significant difference was observed only in the last follow-up plot for the non-IV MOA and overall comparison, while the other time points exhibited no significant difference. The noticeable lack of significant differences at baseline confirms the comparability of the groups, supporting the validity of post-treatment comparisons. The effect sizes at earlier time points had CIs that consistently crossed the line of no effect, further emphasizing the absence of statistically significant differences. In contrast, the last follow-up plot demonstrated a narrower CI that did not cross the line of no effect, indicating a significant treatment effect at this time point. This suggests that the stem cells may require a longer duration to take effect. Additionally, all forest plots displayed a consistent trend of low heterogeneity (I2 < 75%), with some plots reporting I2 = 0%, indicating homogeneity in treatment effects across studies and enhancing the reliability of the pooled estimates despite differences in study designs and populations.
Interestingly, in subgroup analysis comparing the MOAs, significant differences were primarily observed in the non-IV subgroup, particularly at the last follow-up time point. For the IV subgroup, the effect sizes were observed to be smaller, with CIs crossing the line of no effect across all time points to indicate no statistically significant impact. In contrast, the non-IV subgroup exhibited larger effect sizes at 6-month and last follow-ups, with CIs that did not cross the line of no effect, suggesting a significant benefit from non-IV administration. These points are reflected in subgroup analysis, which showed a significant difference (P < 0.05) in the last follow-up, indicating potential differences in treatment efficacy between the MOAs.
Similar to the other primary outcomes, the mRS from 11 studies was compared at various time points: baseline, 3-month follow-up, 6-month follow-up, 12-month follow-up, and last follow-up, with subgroup comparisons of IV and non-IV (Fig. 4). The last follow-up for Chung et al 37 was at 3 months; for Moniche et al 45 and Bhatia et al 35 , at 6 months; for Chen et al 23 , Ghali et al 39 , Hess et al 40 , Lee et al 43 , and Prasad et al 46 , at 12 months; for de Celis-Ruiz et al 36 and Jaillard et al 41 , at 2 years; for Fang et al 38 , at 4 years; and for Jin et al 42 , at 7 years.

Forest plot of mRS outcome based on MOA at (A) baseline, (B) 3-month follow-up, (C) 6-month follow-up, (D) 12-month follow-up, (E) last follow-up.
Observation of the forest plot demonstrated a leftward shift, indicating a lower mRS score at baseline and the 3-month follow-up; as shown in the previous parameters, this shows comparability between the groups at baseline, though also revealing the limited early improvements post-intervention. This trend reverses with a rightward shift at the 6-month follow-up where a significant improvement can be observed, suggesting emergence of functional benefits from the stem cell therapy. The plot then shows a leftward shift before shifting left again at subsequent time points, suggesting a decrease in mRS score within the studies, though not to baseline levels.
A significant difference was observed at the 6-month follow-up for the overall groups and final follow-ups for the studies in the non-IV subgroup. Consistent low heterogeneity (I2 < 75%) was observed across all time points, underscoring the outcome comparability within the subgroups. These results may highlight the time-dependent nature of stem cell therapy, wherein the functional improvement is delayed but clinically significant.
Secondary Outcomes
Mortality was one of two secondary outcomes measured in this meta-analysis. Studies using IV demonstrated 14 events of mortality out of 253 patients in the intervention group than the 40 events out of 405 patients in the control group. Conversely, in the non-IV studies, the intervention group reported only one mortality out of 416 patients, while the control group had three mortalities out of 517 patients. The overall odds ratio (OR) for mortality events was 0.48 with a 95% CI of 0.24–0.95, indicating that the odds of mortality in the intervention group were 0.48 times higher than those in the control group (Fig. 5), indicating that stem cell therapy has the ability to lower the odds of mortality. The IV subgroup showed a similar OR of 0.48 (95% CI: 0.24–0.91), demonstrating the benefit of stem cell therapy compared to the control group, appearing to reduce the mortality odds by an estimated 52%. In the non-IV subgroup which only had an OR of 0.44 (95% CI: 0.03–5.88), a wide CI can be observed to reflect the greater variability and a lack of statistical significance, potentially accounted for by the lower number of events or differences in study design.
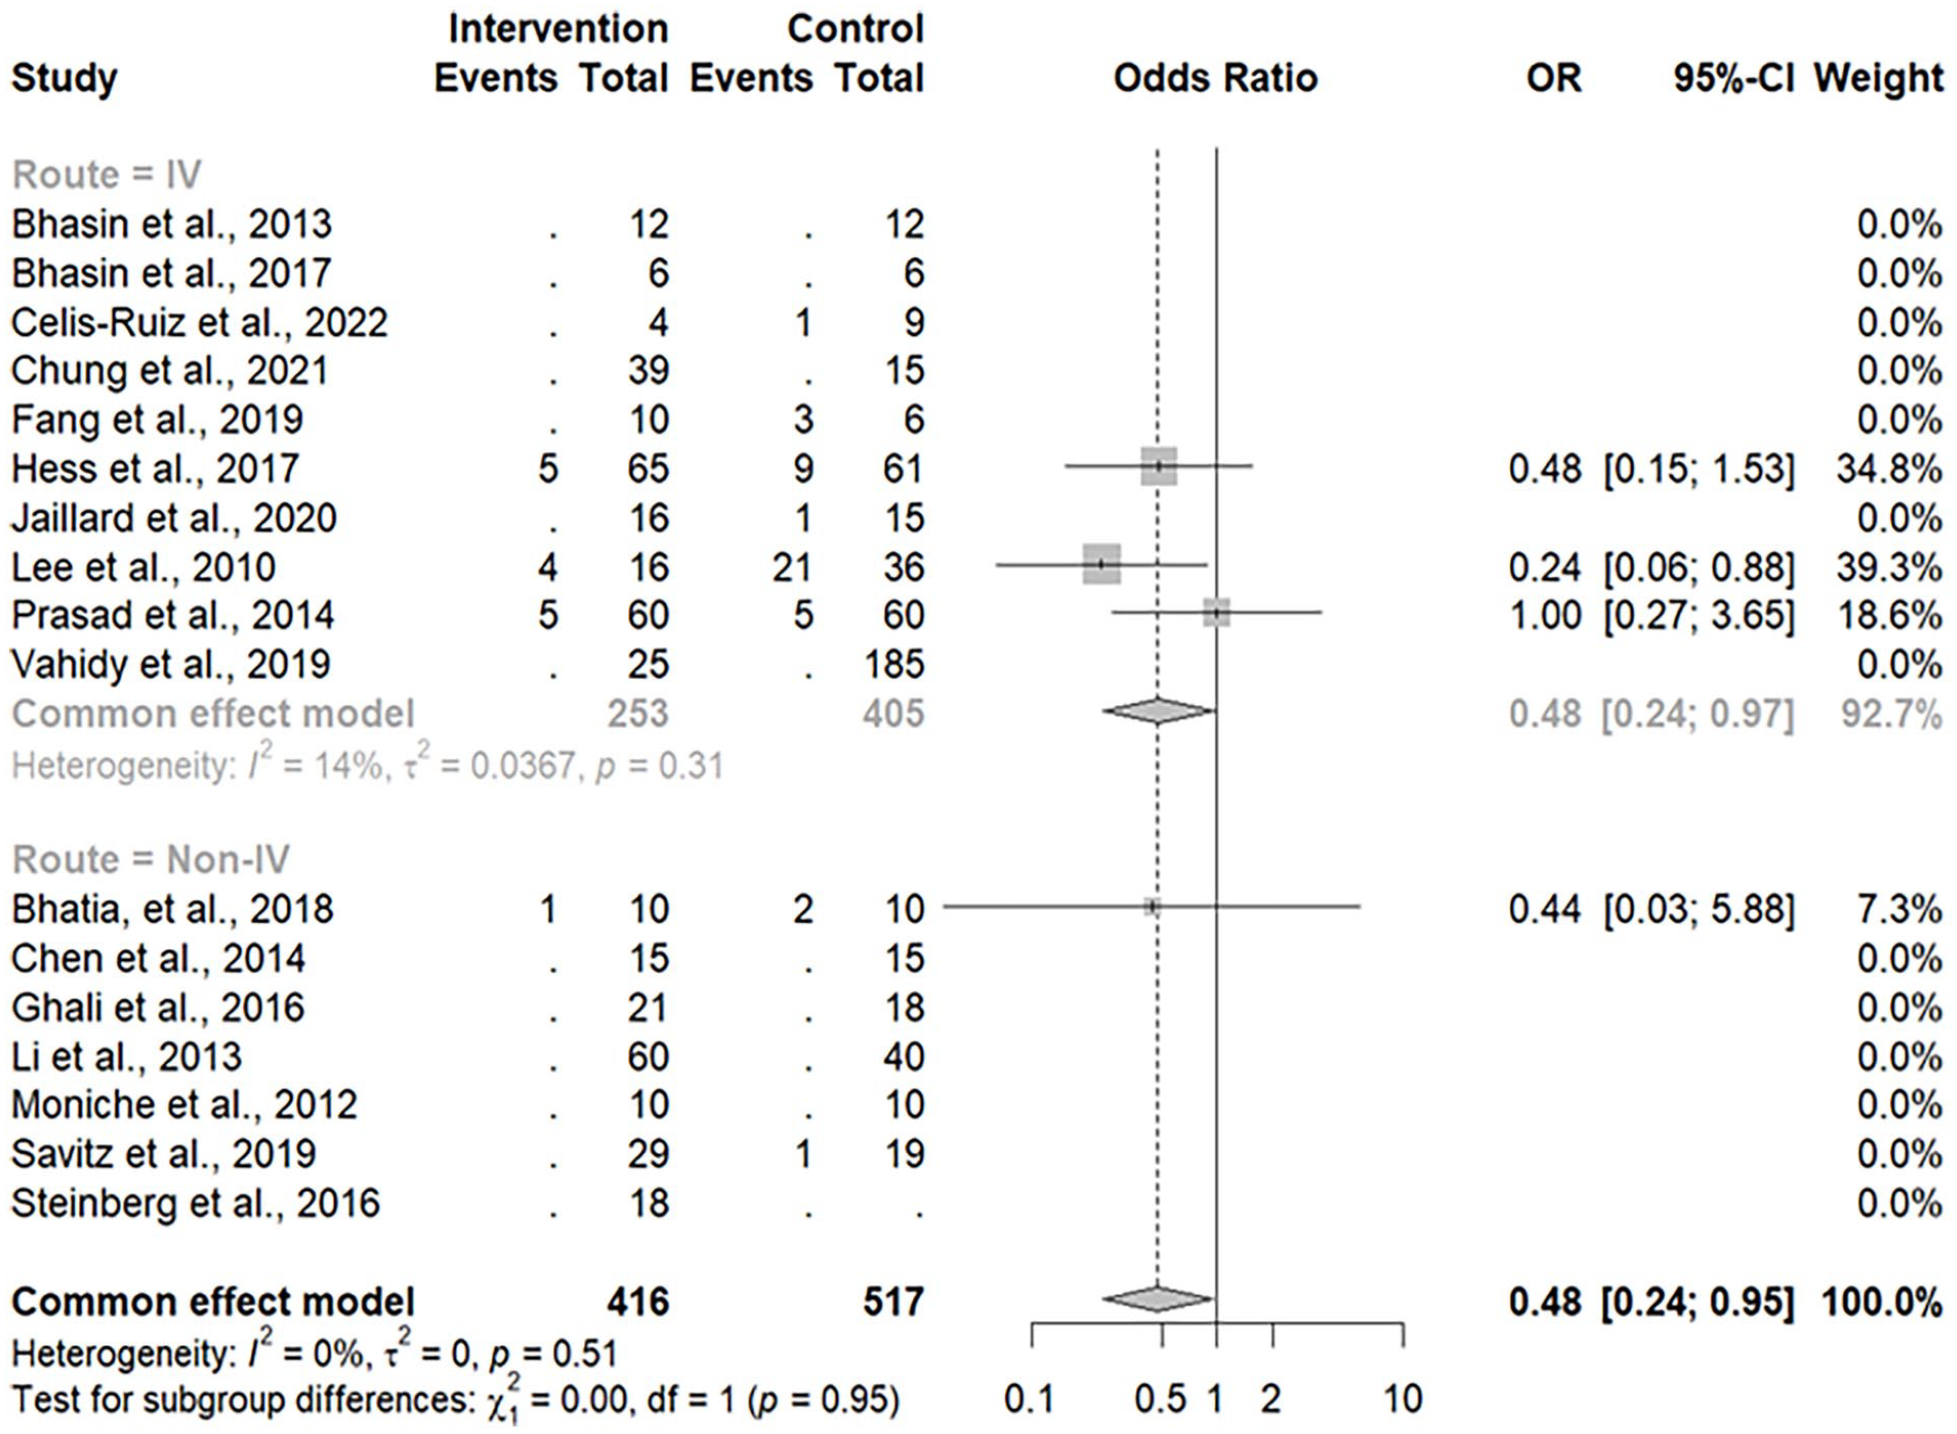
Forest plot of mortality events based on MOA.
The heterogeneity across all studies was consistently low, suggesting the mortality outcomes are comparable regardless of the MOA. This comparability between the IV and non-IV subgroups may be attributed to the stem cell therapy mechanisms which provide anti-inflammatory and neuroprotective effects, reducing stroke-related mortality.
Another secondary outcome is adverse events, divided into neurological and systemic complications (Fig. 6). Neurological complications comprise seizures, recurrent strokes, and depression. Within the intervention group, there were 35 such adverse events, with 20 via the IV route and 15 via the non-IV route. In contrast, the control group experienced 30 events, with 25 occurring through the IV route and 5 through non-IV routes. Analysis of neurological complications revealed no significant difference between the intervention and control groups, an overall OR of 1.35 [0.63–2.90] for IV and 2.35 [0.61–9.11] for non-IV, along with a low heterogeneity (I2 < 75%) within the studies which suggests consistency.

Forest plot of neurological and systemic complication adverse events.
Systemic complications, including urinary tract infection, pneumonia, deep vein thrombosis, and musculoskeletal pain, exhibited a similar trend, with a higher incidence in the intervention group (44 events, with 19 via IV route and 25 via non-IV route) compared to the control group (36 events, with 25 via IV route and 11 via non-IV route). Similarly to the neurological complications, no significant difference was found between the intervention and control groups, the overall OR was 1.30 [0.55–3.09] for IV and 1.12 [0.39–3.17] for non-IV, and the heterogeneity was equally low (I2 < 75%).
The lack of statistical significance in adverse events between the two groups highlights the safety profile of stem cell therapy. An overall observation on the adverse events showed an overall OR of 1.38 [0.87–2.21], with no significant difference present between the subgroups. This suggests that the MOA plays no significant role in the adverse event outcomes.
Discussion
After filtering 17,117 relevant papers from the database search and removing duplicates, further eligibility assessment led to the exclusion of 6,331 papers. Studies, such as Bang et al 49 and Zhang et al 50 , which were included in other publications were excluded from this meta-analysis due to insufficient quantitative primary outcome data pertinent to our analysis. Consequently, 17 studies were ultimately selected for inclusion in the meta-analysis.
Among the 17 studies with RCT and non-RCT designs, a total of 959 patients aged 42–78 years with IS in subacute (1 week and less than 3 months) and acute (6–12 h) stages, ICH, were included. Treatment was administered within 0.5–1,825 days post-stroke using BM-MNC, BMSC, EPC, MSC, or PBSC via IV, IA, and IC injections at dosages ranging from 9.47 × 10⁵ to 6.1 × 10⁸ cells. IV injections were used in 58.82% of the studies, while the remaining 41.18% utilized non-IV administration methods.
To assess the primary and secondary outcomes of stem cell treatment on stroke, forest plots were generated for each follow-up time point, categorized by MOA: either IV or non-IV. The heterogeneity score for each plot was also evaluated.
The primary outcomes of stroke treatment include the NIHSS, BI, and mRS, which are widely utilized to quantitatively assess stroke improvement 24 . The NIHSS evaluates stroke severity through 11 components: level of consciousness, best gaze, visual fields, facial palsy, arm motor, leg motor, limb ataxia, sensory, best language, dysarthria, and extinction and inattention. Each component is scored individually, with a maximum of 42 points. A lower NIHSS score indicates reduced stroke severity24–26,51.
In this meta-analysis, the mean NIHSS scores at baseline for the intervention and control groups were 9–20 and 9–19, respectively. During the 3-month follow-up, scores decreased to 5–10 for both groups. At the 6-month follow-up, scores further decreased to 2–10 for the intervention group and 3–14 for the control group. Subsequently, at the 12-month follow-up, scores were 4–9 for the intervention group and 3–9 for the control group. A decrease in the NIHSS score indicates a reduction in stroke severity. Moreover, the heterogeneity was <75% in most of the data.
The BI measurement is utilized to assess a patient’s functional independence, specifically their ability to perform activities of daily living. These activities encompass feeding, bathing, grooming, dressing, bowel and bladder management, toilet use, transferring between bed and chair, moving on level surfaces, and navigating stairs. Each activity is scored according to the patient’s level of dependency and capability, with the maximum achievable score being 100. A higher BI score is indicative of greater independence in stroke patients and suggests a less severe stroke27–29.
At baseline, the mean BI scores for the intervention and control groups ranged from 14 to 49 and 15 to 50, respectively. At the 6-month follow-up, these scores ranged from 26 to 81 for the intervention group and from 29 to 78 for the control group. At the last follow-up, the scores ranged from 57 to 89 for the intervention group and from 47 to 85 for the control group. The I2 values for all baseline and follow-up assessments were less than 75%. Notably, although the study by Bhasin et al 33 was included in the analysis, it was excluded from the BI analysis because it used a modified BI rather than the conventional BI employed in the other studies.
Similarly, the mRS measures the degree of disability or dependence in daily activities of stroke patients and is widely used to assess treatment success. It features seven scoring categories, ranging from 0 to 6, based on the patients’ disability and ability to perform daily activities. A score of 0 indicates no stroke symptoms and the ability to live normally, 5 indicates severe disability, and 6 denotes mortality30,31,52.
In this meta-analysis, the forest plot of mRS scores at baseline, 3-month follow-up, 6-month follow-up, 12-month follow-up, and last follow-up was analyzed. This was followed by a range of 0.6–0.9 for the intervention group and 0.8–1.3 for the control group at the 3-month follow-up. At the 6-month follow-up, the ranges were 1–5 for the intervention group and 2–4 for the control group. Both groups had a range of 3–4 at the 12-month follow-up. At the last follow-up, the intervention group ranged from 1 to 4, while the control group ranged from 2 to 5, with I2 < 75% for all results.
Both the intervention and control groups demonstrated improvements across all quantitative measures, accompanied by a trend of low heterogeneity (I2 < 75%), which suggests consistency among the study results 53 .
Stem cells can enhance clinical outcomes in stroke patients through differentiation, immunomodulation, angiogenesis, neurogenesis, and the secretion of neurotrophic factors 54 . For instance, BM-MNC, the most commonly used cell type in the studies analyzed here, with a 50% usage rate, can activate angiogenesis to improve primary patient outcomes. Kikuchi-Taura et al 16 demonstrated that BM-MNC has connexons 37 and 43, which form gap junction channels that facilitate the transfer of small molecules, such as glucose or glycolytic substrates, between BM-MNC and ECs. This transfer stimulates hypoxia-inducible factor-1α, inducing vascular endothelial growth factor uptake by ECs and endothelial nitrogen monoxide synthase phosphorylation, leading to angiogenesis. MSC, the second most utilized cell type, is thought to enhance patient outcomes through all the aforementioned mechanisms. Ercelen et al 55 highlighted that MSC’s key role in stroke treatment is immunomodulation, which reduces inflammation by creating an anti-inflammatory microenvironment in damaged tissues. Additionally, MSCs can differentiate into neural cells and migrate to infarct areas, secreting trophic factors via paracrine signaling to promote angiogenesis, neurogenesis, and immunomodulation, thereby reducing infarct volume and improving clinical outcomes 56 . In contrast, BMSCs cannot directly differentiate into neural cells but instead migrate to the infarct area to support survival and regeneration, repairing infarctions and enhancing neurological function 57 . EPCs, similar to other cell types, migrate to the infarct area, mediated by chemokine stromal cell–derived factor-1 (SDF-1 or CXCL12), and contribute to angiogenesis and neurogenesis, aiding in the recovery of neurological function 21 . Similarly, Chen et al 23 reported that PBSCs significantly enhance angiogenesis and neurogenesis, potentially through the production of brain-derived neurotrophic factor and platelet-derived growth factor.
Mortality and adverse events are secondary outcomes of stroke treatment. Fig. 5 presents a forest plot of mortality events. In the IV MOA group, the intervention group had fewer mortalities, with 14 out of 253 patients, compared to 40 out of 405 patients in the control group. In the non-IV MOA group, the intervention group reported only one mortality out of 416 patients, while the control group had three mortalities out of 517 patients. Studies asserting a correlation between patient mortalities and the treatments conducted are unsubstantiated.
Adverse events are unintended, negative, and harmful outcomes that afflict patients due to medical treatments. These adverse events include side effects, injury, and physical or psychological harm, and can even lead to mortality. However, less serious adverse events can be improved and cured with appropriate treatments58,59. Adverse events are commonly categorized into two groups: neurological complications and systemic or medical complications 60 . Fig. 6 presents a forest plot comparing neurological and systemic complications through IV and non-IV MOAs. The neurological complication data indicate 20 events in the intervention group and 25 in the control group for the IV route. For the non-IV route, there are 15 events in the intervention group and 5 in the control group. Regarding systemic complications, the IV route data reveal 19 events in the intervention group and 25 in the control group, while the non-IV route data show 25 events in the intervention group and 11 in the control group. However, most of the studies claim that the adverse events reported were not related to the administered treatments.
Adverse events are common in stroke treatments, while mortalities are rare. However, studies discussing the correlation between mortalities and adverse events associated with these treatments are lacking. The results of this meta-analysis revealed no significant differences between the intervention and control groups in terms of the number of mortalities and adverse events, consistent with findings from previous meta-analysis61,62.
This meta-analysis provides valuable insights into the outcomes of various stem cell–based therapies on stroke treatment via different administration methods. In this study, an analysis of how the MOA subgroups (IV and non-IV) would affect each functional outcome along with the mortality and adverse events was provided. Furthermore, this study separately analyzes the neurological and systemic adverse events before observing the overall analysis; hence providing a more in-depth understanding of the potential risks associated with stem cell–based therapy via different MOAs to help identify specific adverse event patterns that may relate to the different MOA and patient populations. In addition, this study presents the MOA outcomes in a side-by-side manner to offer a comprehensive comparison, allowing readers to consider the implications of each delivery method for real-life clinical translation. The point that sets this study apart from others is the analysis approach, wherein we incorporated the MOA and subgroup differences into addressing the efficacy of stem cell–based therapy through the functional outcomes but also explored the safety comprehensively through mortality and adverse event analyses. Furthermore, to compare with other published meta-analyses 63 , this study takes a different perspective by categorizing the adverse events into systemic and neurological complications to further explore the risks associated with each treatment along with its administration route. This multifaceted analysis may hopefully provide clinicians and researchers with critical insights to refine therapeutic strategies.
However, it is important to acknowledge the limitations of this meta-analysis. First, obtaining raw and complete data from studies to be analyzed was challenging. Second, the diversity of past studies with varying sample sizes and methodologies that have significantly evolved may have affected the comparability of study results. Furthermore, the diversity in stem cell types used across the studies (eg, MSC, BM-MNC, PBSC, EPC) is likely to significantly influence the observed outcomes. As described previously, the different cell types have varying mechanisms of action and therapeutic potential, underscoring the critical need for standardization in the selection of stem cells for clinical application. The heterogeneity in dosage and MOA may also contribute to the inconsistencies in effect sizes, evident in the forest plots for adverse events. Finally, the varying patient populations across studies (eg, stroke type, treatment timing post-onset) may influence the functional outcomes and likelihood of mortality or adverse events. The relatively small sample size in some studies is also likely to reduce the statistical power to detect the significant effects such as in the subgroups.
This meta-analysis, which was done according to the PRISMA guidelines, incorporated 17 studies that met all the set inclusion criteria to study the potential of stem cell–based therapy via different MOAs as a promising intervention for stroke recovery. The results revealed its role in improving functional outcomes and reducing mortality. The primary outcomes (NIHSS, BI, and mRS) demonstrated consistent improvement in functional recovery, particularly in the non-IV subgroup at later follow-up time points. This finding potentially highlights the time-dependent nature of stem cell therapy, as it is observed that the benefits are more pronounced as the stem cells induce neuroprotective and regenerative effects. Furthermore, reduction in mortality within the intervention group supports the clinical viability of using stem cell–based therapy for stroke treatment.
In future research, it is advised to prioritize robustly designed RCTs to address the gaps and limitations of this study, for instance, by focusing on more comparable cell types, dosages, and long-term safety evaluation.
Conclusion
To conclude this study, it is apparent that stem cell–based therapy demonstrates great promise in promoting functional recovery, mitigating stroke-related mortality, and minimizing adverse events within stroke patients. However, its integration into standard clinical care may require addressing challenges related to the variability and limited data standardization to ensure a seamless translation from research to clinical application.
Footnotes
Appendix
Acknowledgements
This study was supported by the Sunny Brain Tumor and Brain Disease Research and Development Fund.
Author Contributions
G.M.: Conceptualization, Software, Investigation, Data curation, Writing—original draft preparation, Writing—review and editing, Visualization.
J.O.: Conceptualization, Methodology, Software, Validation, Formal analysis, Investigation, Resources, Writing—review and editing, Supervision.
J.W.: Conceptualization, Methodology, Validation.
H.M.: Conceptualization, Methodology, Validation.
Y.C.: Conceptualization, Methodology, Validation.
K.C.: Conceptualization, Validation, Investigation, Resources, Supervision.
N.A.: Conceptualization, Software, Investigation, Data curation, Writing—original draft preparation.
All authors have read and agreed to the published version of the manuscript.
Ethical Approval
This study was approved by our institutional review board.
Statement of Human and Animal Rights
This article does not contain any studies with human or animal subjects.
Statement of Informed Consent
There are no human subjects in this article and informed consent is not applicable.
Data Availability
The data used to support the findings of this study are available from the corresponding author upon request.
Declaration of Conflicting Interests
The author(s) declared no potential conflicts of interest with respect to the research, authorship, and/or publication of this article.
Funding
The author(s) disclosed receipt of the following financial support for the research, authorship, and/or publication of this article: This study was supported by grants from the Taiwan Experience Education Program (TEEP) at Taipei Medical University, issued by the Taiwan Ministry of Education (MOE), the National Science and Technology Council (NSTC 113-2811-B-038-032, 112-2811-B-038-016, 112-2314-B-038-108, 111-2314-B-038-134-MY3), University System of Taipei Joint Research Program (USTP-NTUT-TMU-110-01), and Taipei Medical University (DP2-TMU-112-N-2).