
Abstract
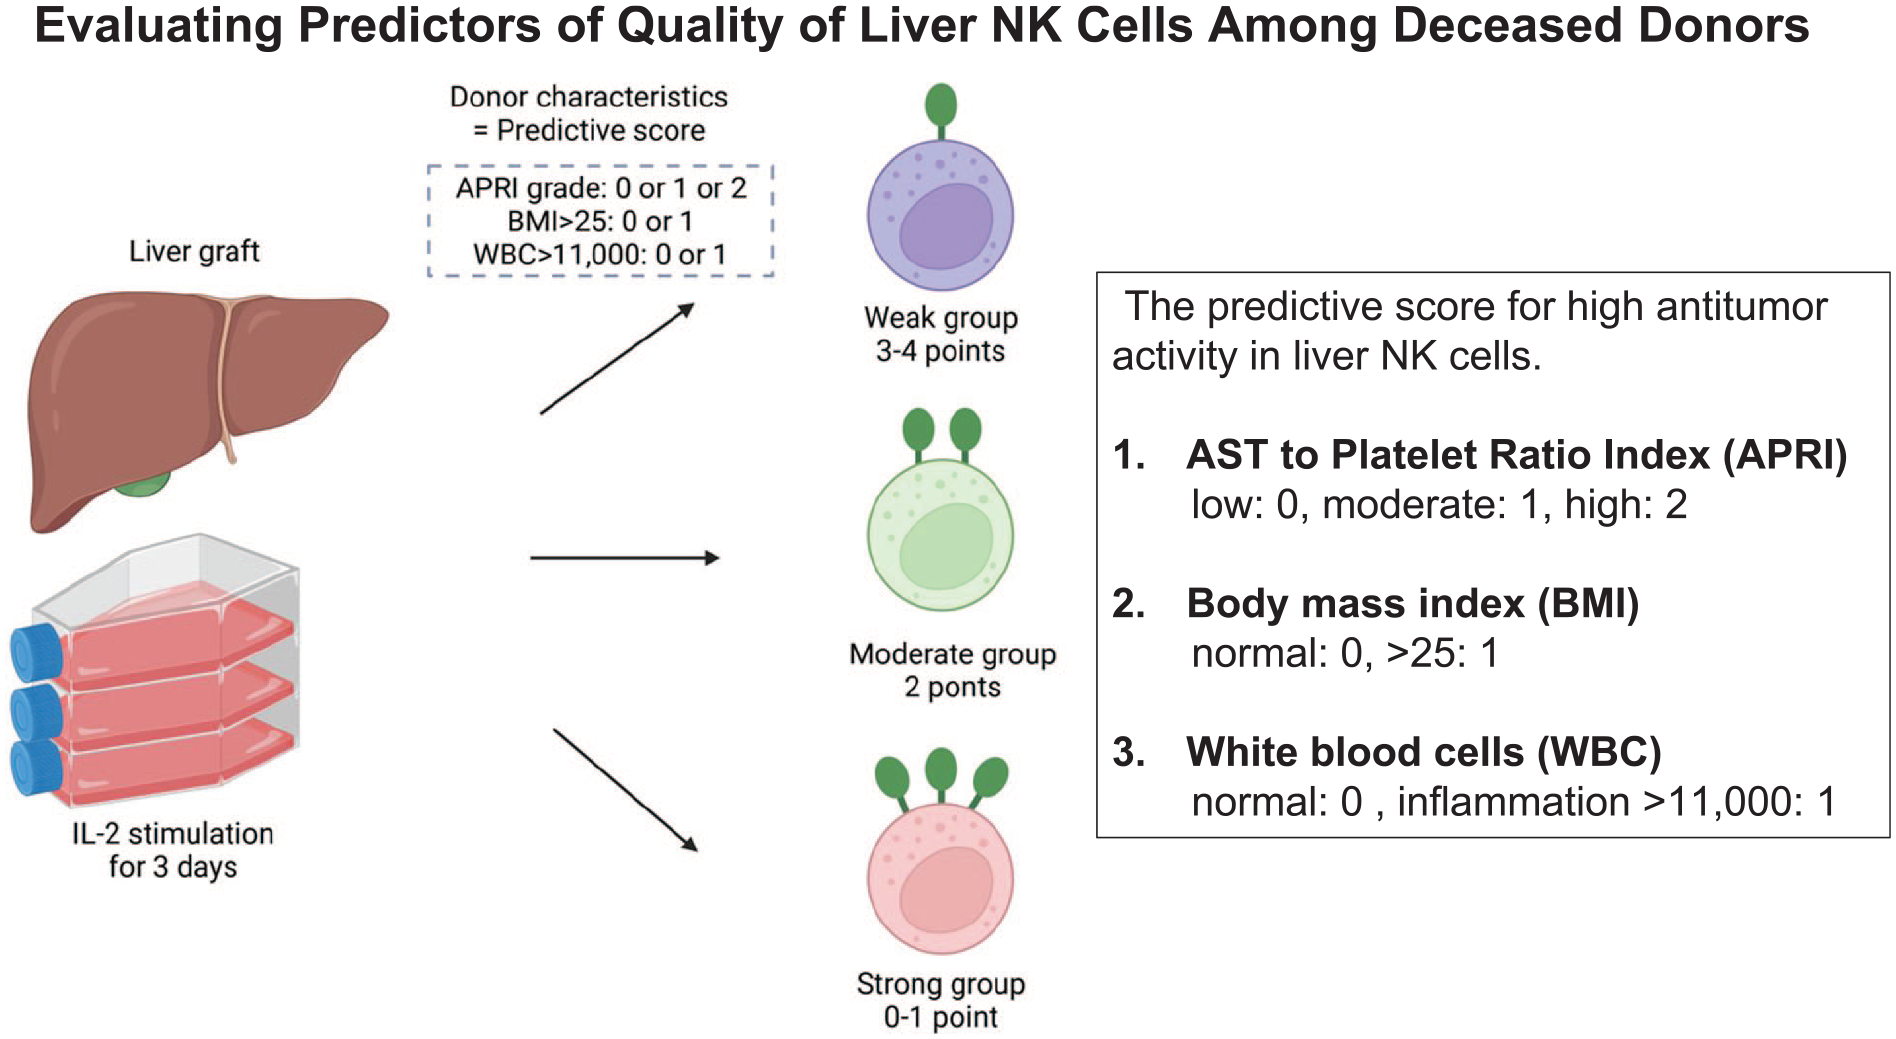
This study investigated the substantial variability in the quality of liver natural killer (NK) cells from deceased donors (DDs). This study assessed liver nonparenchymal cells from 51 DDs for activation receptors and cytotoxicity against K562 (leukemia) and HepG2 (hepatoma) cell lines. The results indicated variability in TNF-related apoptosis-inducing ligand (TRAIL) and NK stimulatory receptor NK group 2 member D (NKG2D) expression in liver NK cells from DDs, which correlated with cytotoxicity against tumor cell lines. In addition, the white blood cell (WBC) count, aspartate aminotransferase (AST) level, body mass index (BMI), and platelet count were significantly associated with enhanced TRAIL and NKG2D expression. A predictive score integrating AST/platelet ratio index, BMI, and WBC count was developed to effectively identify DDs with high antitumor activity in liver NK cells. This score is expected to predict DDs with high-quality liver NK cells, which can be used for the purpose of immunotherapies.
Introduction
Liver cancer constitutes a significant component of the global cancer burden. The incidence rates of liver cancer increased significantly in many countries over recent decades. Hepatocellular carcinoma (HCC) represents the majority of liver cancer cases and associated mortalities 1 . Several treatment modalities, including radiofrequency ablation, chemotherapy, and hepatectomy, are currently utilized as standard treatment for HCC. However, these approaches often fail as curative therapies especially when liver has cirrhosis, which is carcinogenic environment 2 . Liver transplantation (LTx) is the most effective treatment for HCC because it enables the complete removal of the tumor and underlying carcinogenic liver 1 . Nevertheless, the risk of distant metastases after transplant is high among patients with advanced HCC and can be exacerbated with immunosuppressive medications3–5. Immunotherapy, particularly with immune checkpoint inhibitors, has recently emerged as a prominent area of interest, and has been shown to be effective in reducing HCC recurrence 6 . Distant metastasis after LTx remains a major challenge. Thus, there is a pressing need to develop immune cell therapies to supplement existing treatments for HCC.
Our group is currently developing adoptive donor-derived liver natural killer (NK) cell therapy as adjuvant therapy after LTx for HCC. Adoptive transfer of donor-derived liver NK cells has the potential to attack circulating tumor cells (CTCs) and reduce distant metastasis after LTx7,8. The advantage of the adoptive transfer of liver NK cells in cancer therapy is that NK cells can cross allogeneic barriers and their capacity to expand ex vivo 9 . NK cells belong to the innate immune system and can eliminate virally infected cells and/or cancer cells, even when acquired immunity is suppressed with immunosuppression after transplantation. According to the missing self-hypothesis, NK cells can recognize target cells and kill them without prior sensitization 10 . NK cells play an important role in various tumors, such as leukemia, melanoma, and lung, breast, ovarian, and colorectal cancers 11 . Clinical trials of NK cells have predominantly focused on patients with hematological diseases, although promising data from recent preclinical studies strongly support their evaluation in solid tumors 12 . NK cells derived from the liver are preferred because of their higher cytotoxicity against HCC cells than NK cells derived from peripheral blood (PB) 13 . Interleukin-2 (IL-2) generally activates NK cells and this cytotoxicity of liver NK cells can be further augmented by IL-2 stimulation, resulting in enhanced antitumor ligands13–15.
However, the quality of NK cells that can activate better and kill tumors effectively shows considerable individual variability, and liver NK cells derived from donors can sometimes have low cytotoxic potential with suboptimal antitumor activity 16 . Currently, we do not have an established method to predict which deceased donor (DD) would possess liver NK cells with high antitumor cytotoxicity. Thus, this study aimed to assess donor factors that predict the quality of liver NK cells and to develop a practical scoring system.
Materials and Methods
Sample Collection
DDs accepted for LTx at Stanford University Medical Center, Palo Alto, California, in 2023, were analyzed in this study. Liver lymphocytes were collected as previously described8,15. Briefly, the liver graft was perfused ex vivo through the portal vein. Liver mononuclear cells (LMNCs) were isolated by gradient centrifugation using Ficoll-Paque (GE Healthcare Bio-Sciences, Little Chalfont, UK). Standard testing for infectious diseases, Including assays for the detection of hepatitis B virus (HBV) and hepatitis C virus (HCV), as well as the human immunodeficiency virus (HIV), specifically anti-HCV (antibodies to hepatitis C virus), anti-HIV (antibodies to human immunodeficiency virus), anti-HB core (antibodies to hepatitis B core antigen), and HBsAg (hepatitis B surface antigen), was performed. Donations were performed after brain death. Donors who tested positive for any of the infectious disease markers listed above and donations after circulatory death (DCDs) were excluded from this study. PB was collected from healthy volunteers (HVs) to compare peripheral blood natural killer (PBNK) cells with liver NK cells. Subsequently, peripheral blood mononuclear cells (PBMCs) were isolated by Ficoll-Hypaque (GE Healthcare, Uppsala, Sweden) density-gradient centrifugation. PBMCs and LMNCs were resuspended in X-VIVO 15 medium (LONZA, Walkersville, MD, USA) supplemented with 10% human AB serum (Valley Biomedical, Winchester, VA, USA). For DD patients, samples with research consent obtained from the organ procurement organization were analyzed. The study protocol was approved by the Ethics Committee of Stanford University School of Medicine Institutional Review Board (IRB No. 67239). This study conformed to the provisions of the Declaration of Helsinki.
Cell Culture
LMNCs and PBMCs were cultured with 100 U/ml of human recombinant IL-2 (Novartis, Emeryville, CA, USA) in a culture medium at 37°C in an atmosphere supplemented with 5% CO2. One microgram of human anti-CD3 monoclonal antibody was obtained from Miltenyi Biotec (Bergisch Gladbach, Germany). The cells were harvested for further analysis after 3 days of culture.
Flow Cytometric Analysis
All analytical procedures were performed using a FACS LSR-II Cytometer (BD Biosciences, Mountain View, CA, USA). For human PBMC and LMNC, the following mAbs were employed for the surface staining of the lymphocytes: anti-CD3, anti-TNF–related apoptosis-inducing ligand (TRAIL; CD253), anti-NK stimulatory receptor NK group 2 member D (NKG2D; CD314), anti-CD69, anti-DNAM-1 (CD226), anti-NKp44(CD336), anti-NKp46 (CD335), anti-NKp30 (CD337), anti-NKG2A (CD94), and anti-CD56. The gating strategy is illustrated in Supplemental Fig. 1 as following previous studies7,8,13,15,17. First, living cells were identified by 4',6-diamidino-2-phenylindole (DAPI) staining, and singlet cells were gated. After isolating the lymphocytes, the CD3−CD56+ lymphocyte population was defined as NK cells. The data obtained were subsequently analyzed using FlowJo software v10 (Tree Star, Inc, Ashland, OR, USA).
Cell Targets
K562, a human chronic myelogenous leukemia cell line (#CCl-243, ATCC, Manassas, VA, USA) that lacks the TRAIL-death receptors (DR4/5), was cultured in Dulbecco’s modified Eagle’s medium (DMEM; Invitrogen, Waltham, MA, USA) supplemented with 10% heat-inactivated fetal calf serum (Mediatech, Inc, Manassas, VA, USA), 100 U/ml penicillin, and 100 μg/ml streptomycin (Invitrogen, Waltham, MA, USA) at 37°C in 5% CO2. The K562 tumor cell line is widely used to assess the antitumor cytotoxicity of NK cells, making it the most frequently employed cell line in such evaluations 18 . Target cells were harvested during the logarithmic phase of growth, washed in phosphate-buffered saline (PBS; GIBCO, Grand Island, NY, USA), and counted using trypan blue staining before use.
HepG2, a human hepatoma tumor cell line that highly expresses TRAIL-DR4/5, was cultured in DMEM supplemented with 10% heat-inactivated fetal calf serum, 100 U/ml penicillin, and 100 μg/ml streptomycin at 37°C in 5% CO2. The target cells were harvested during the logarithmic phase of growth, washed in PBS, and counted using trypan blue staining before use.
Cytotoxicity Assay
The cell cytotoxicity assay was conducted by flow cytometry (FCM) as previously described 19 . In brief, target cells were labeled with 0.1 μM carboxyfluorescein diacetate succinimidyl ester using the Cell Tracer Kit (Invitrogen, Waltham, MA, USA). Effector cells were then co-incubated with the target cells at varying effector-to-target ratios for 1 h at 37°C in a 5% CO2 environment. Cytotoxicity was calculated as a percentage, using the following formula:
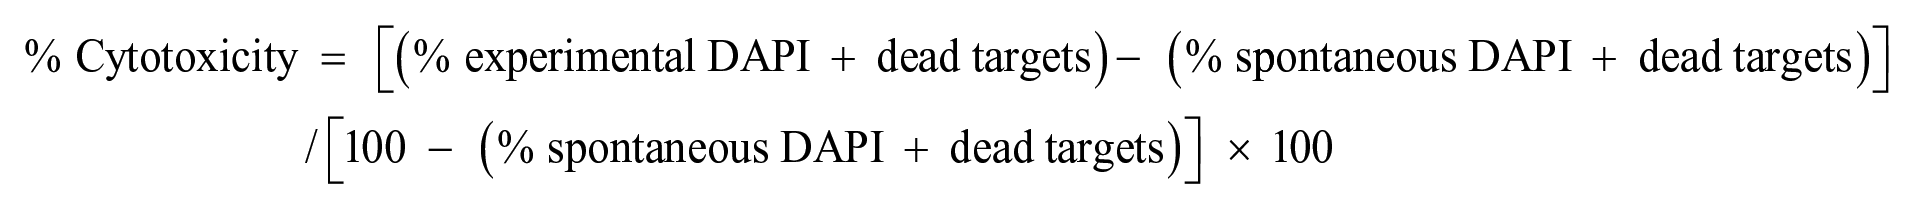
In this process, tumor cell lines were cultured in DMEM supplemented with 10% heat-inactivated fetal calf serum, 100 U/ml penicillin, and 100 µg/ml streptomycin at 37°C and 5% CO2 for 1 h with effector cells. The cytotoxicity assay was used to calculate the antitumor cytotoxicity of liver NK cells with an effector: target ratio of 40:1.
Assessment of Noninvasive Fibrosis Marker
The AST platelet ratio index (APRI), a well-known noninvasive fibrosis marker, was calculated as follows 20 : APRI = [AST (U/L) / Upper limit of normal AST (U/L)] × [100 / Platelet count (109/L)]
Liver immune status index (LISI) was subsequently used to predict TRAIL expression in liver NK cells 16 . The LISI was calculated using the following formula 16 : 36.39 – [6.18 × albumin (g/dl)] – [0.50 × body mass index (BMI)] + [2.91 × fibrosis-4 (Fib-4) index] 21 .
Statistical Analysis
The nonparametric Mann–Whitney U-test was performed to compare differences; P < 0.05 was considered statistically significant. The correlation (using the Spearman correlation coefficient) between the expression markers of liver NK cells and cytotoxicity against tumor cell lines was analyzed. Using K-means cluster analysis, patients were separated into three distinct groups according to the observed proportion of TRAIL and NKG2D in liver NK cells. Multivariate analyses for variables independently related to a higher proportion of TRAIL+ and NKG2D+ NK cells were performed using logistic analyses. Comparative evaluations of different prognostic frameworks were factored in metrics, such as the area under the receiver operating characteristic curve (AUROC), consistency across various risk strata, discriminatory prowess, and informational parsimony per Akaike criterion. All variables were included in the multivariate models, and the backward elimination method with the removal criterion P = 0.10 was used to select covariates. The JMP statistical software (JMP® 17; SAS Institute Inc, Cary, NC, USA) was used for all statistical analyses.
Results
Differences Between NK Cells From PB and DD Grafts
The backgrounds of the DDs are summarized in Table 1. This study included 51 DDs. The majority of the donors were male, representing 34 (66.7%) of the total donor group. The median donor age was 43 years. The median BMI was 28.4 kg/m2. Six HVs comprised individuals in their 20s and 30s, with no underlying medical conditions. PBNK cells from six HVs were used as controls.
Background Data.
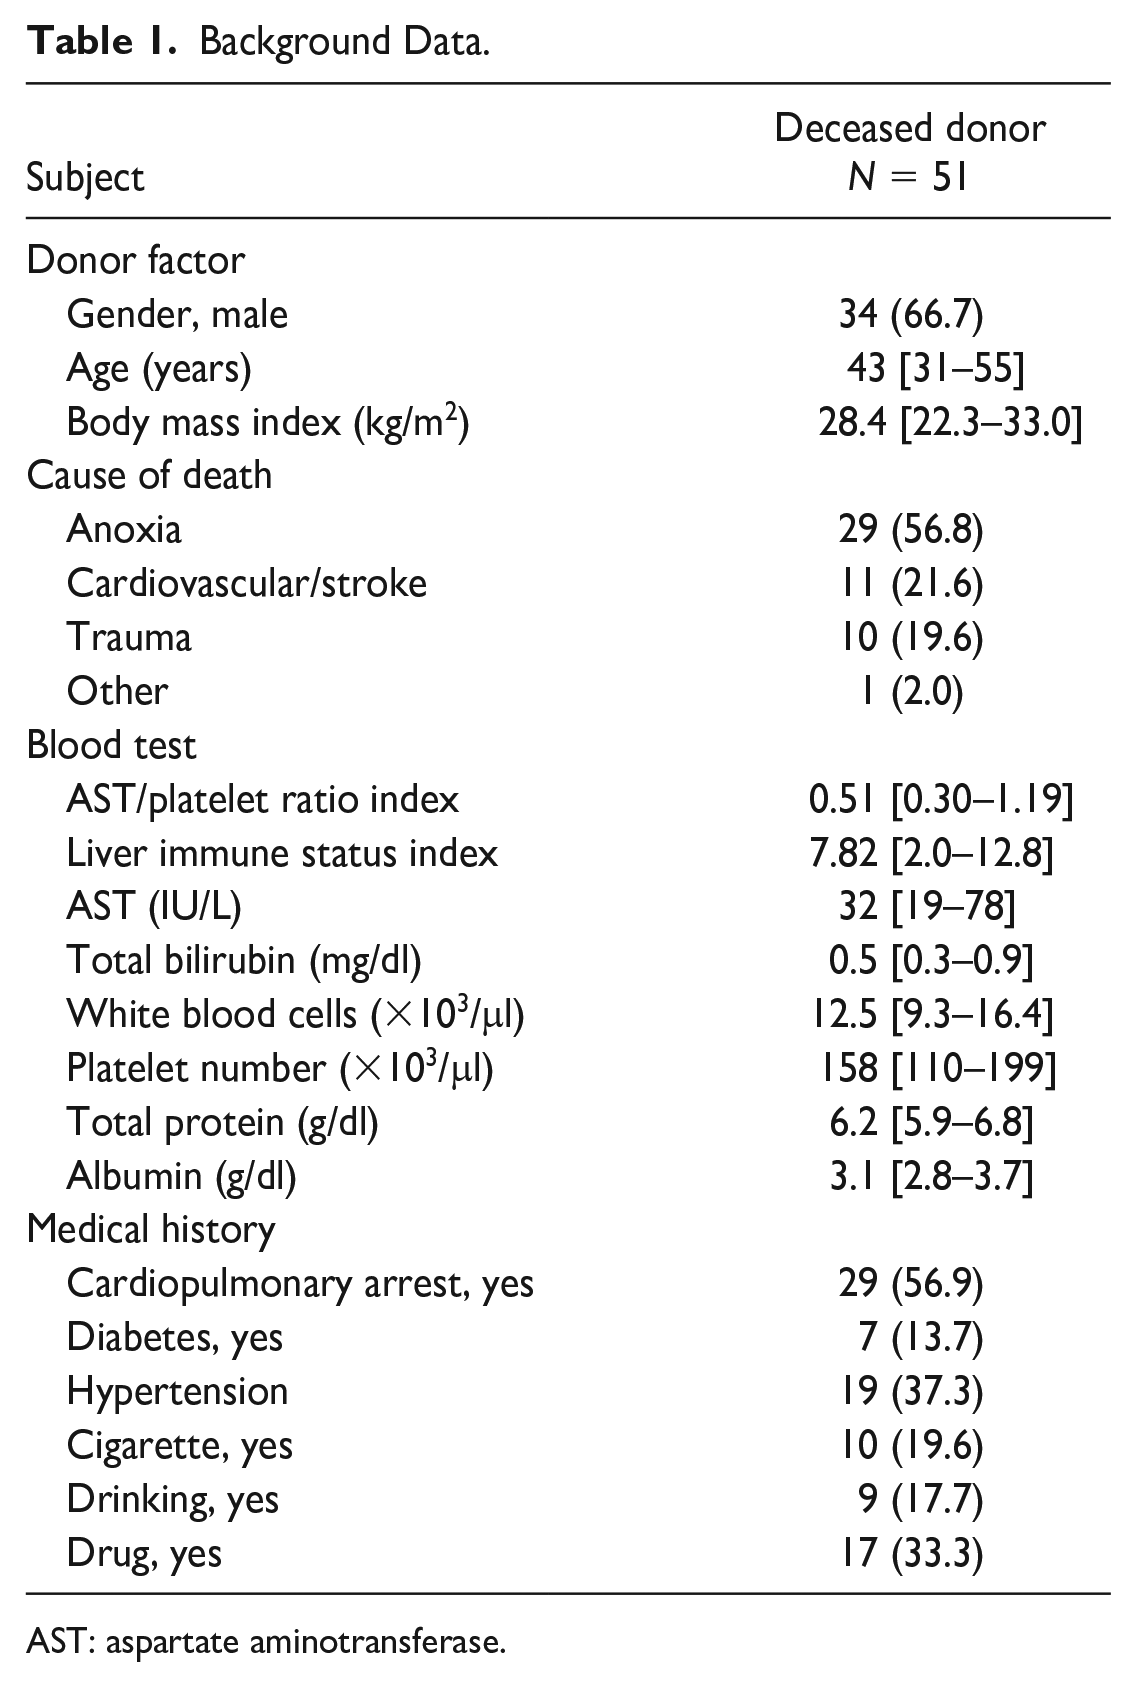
AST: aspartate aminotransferase.
The expression of activation markers in liver NK cells and PBNK cells, as analyzed by FCM, is presented in Supplemental Fig. 1A, B. Flow cytometric analysis revealed that liver NK cells from DDs exhibited a pronounced proportional increase (36.0 ± 15.5%) relative to PBNK cells from healthy donors (2.9 ± 2.9%; P < 0.01; Fig. 1A).
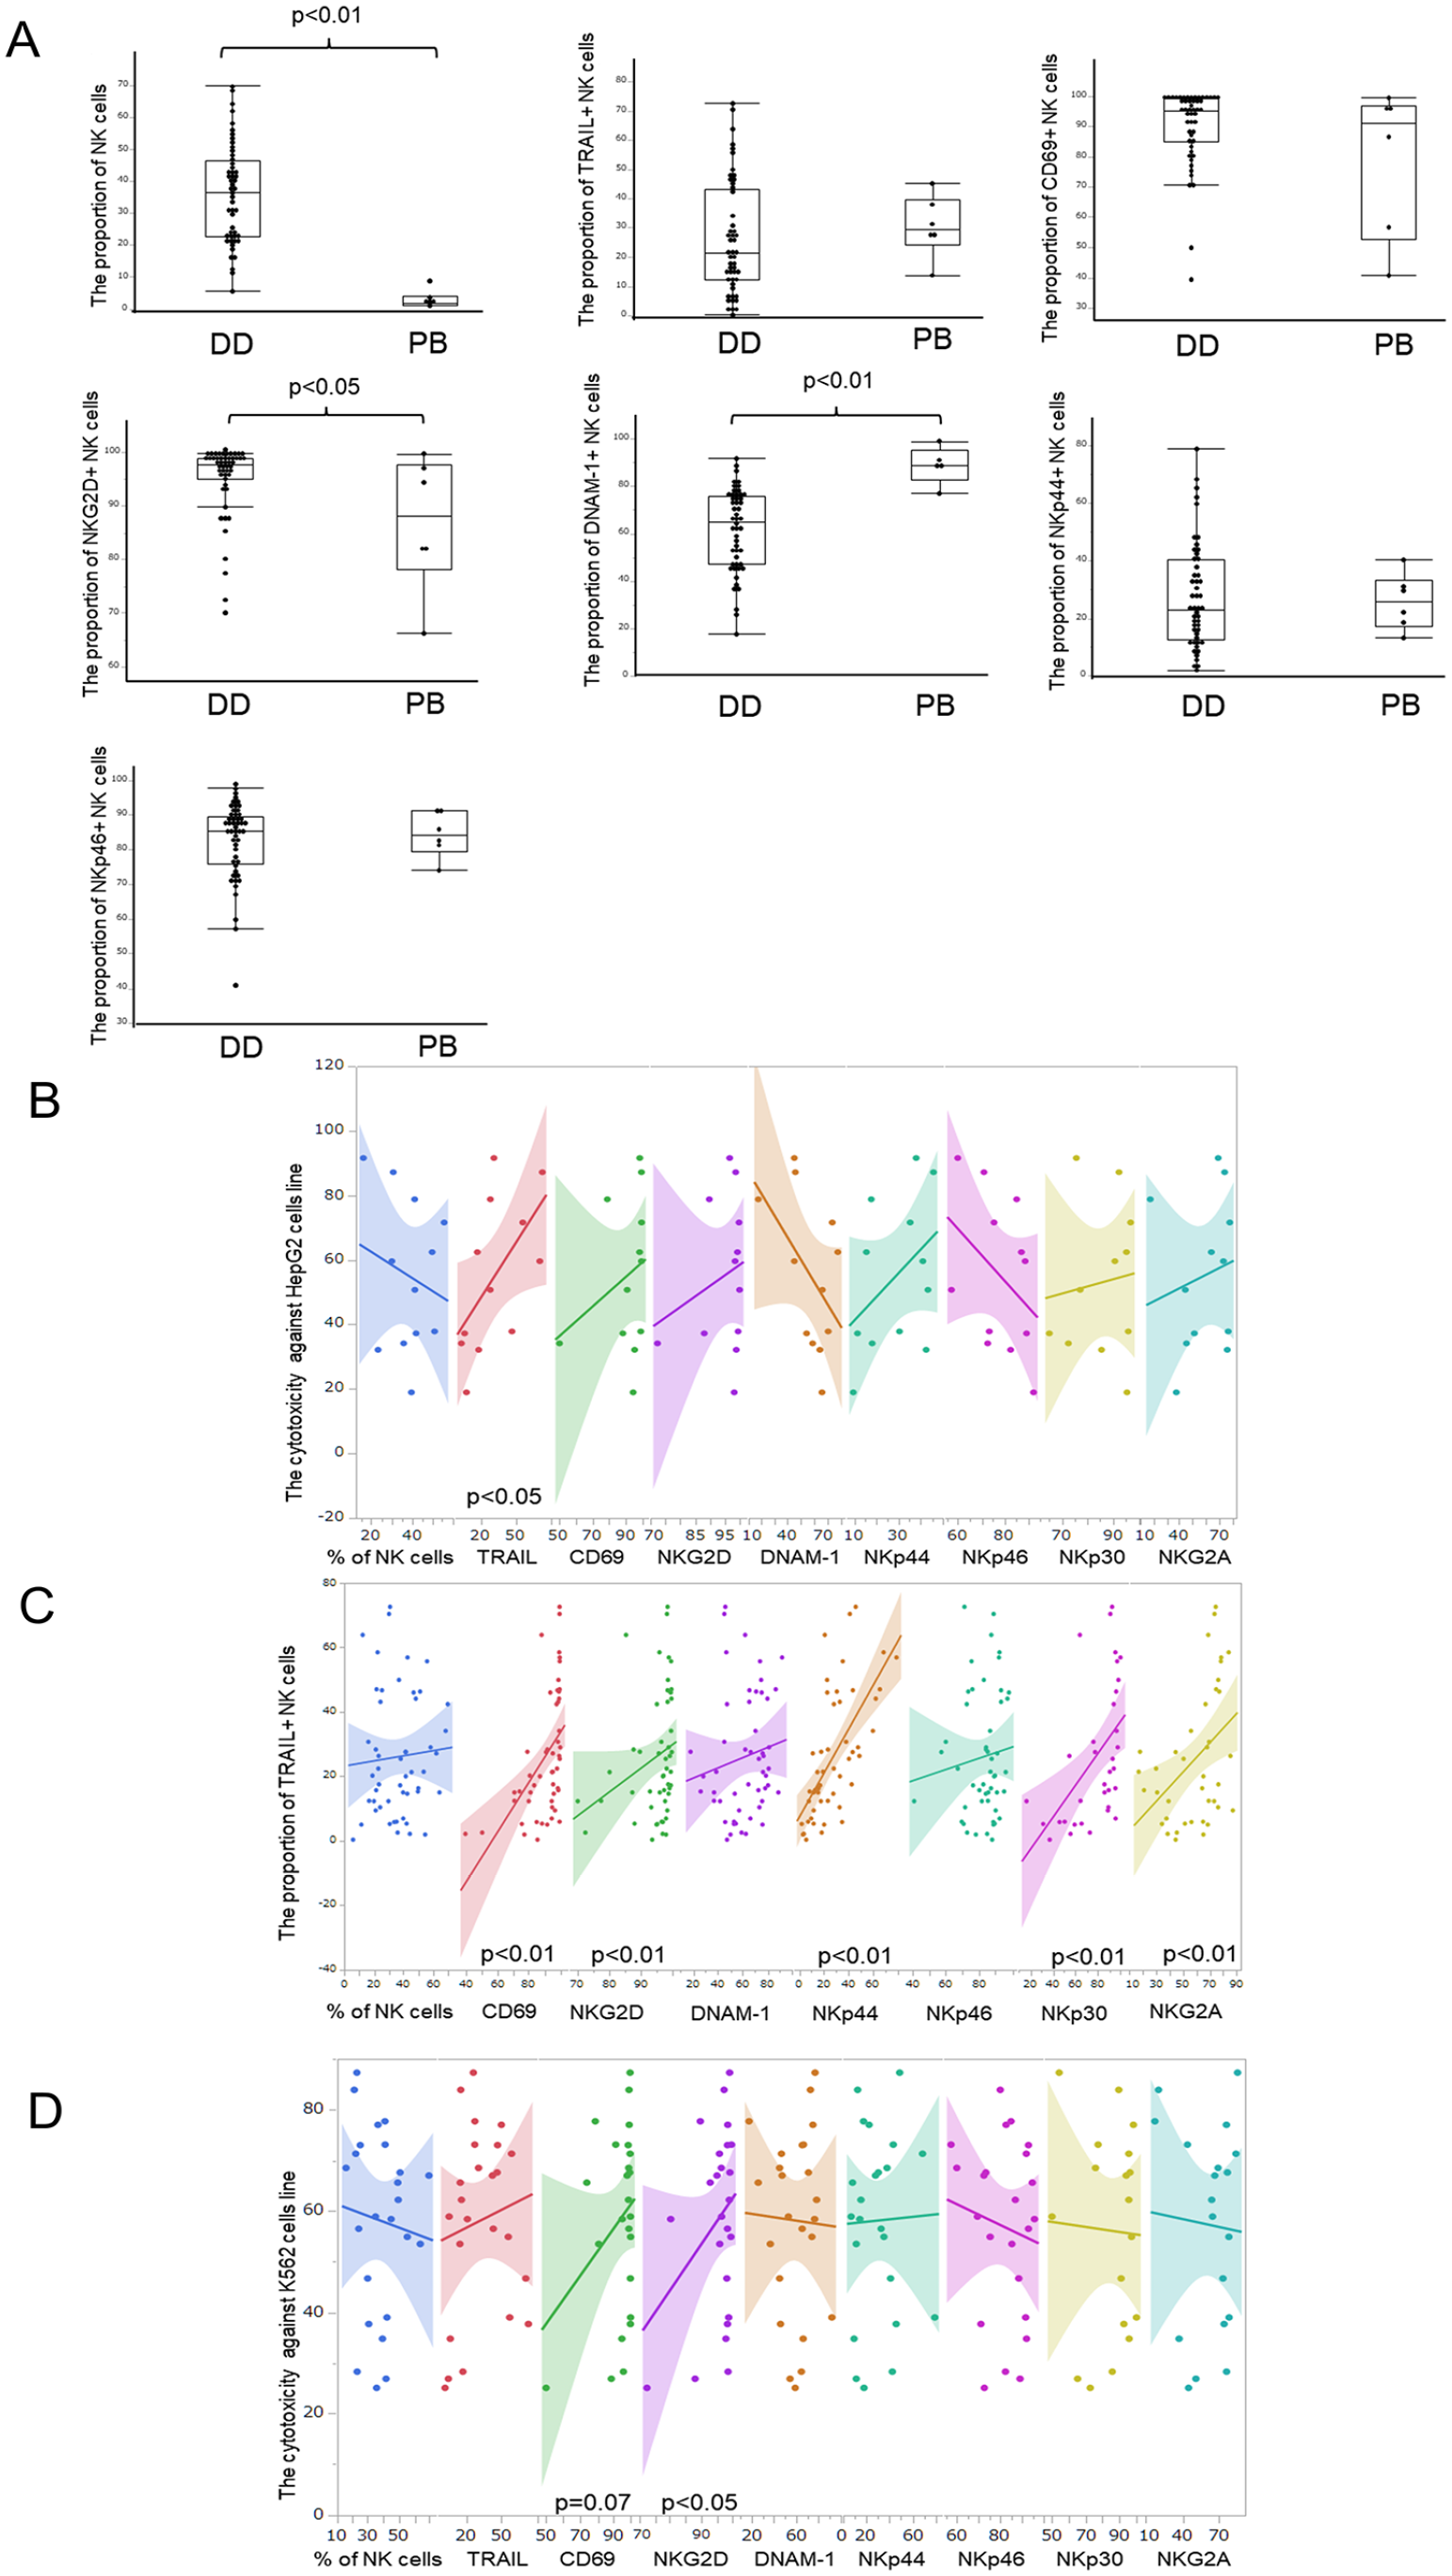
The phenotype and cytotoxicity of NK cells. (A) Compared the activation markers on NK cells between deceased donors and healthy volunteers. (B) The correlation between each activation marker and the cytotoxicity of NK cells against HepG2 tumor cells. (C) The correlation between TRAIL and other activation markers. (D) The correlation between each activation marker and the cytotoxicity of NK cells against K562 tumor cells. NK: natural killer; TRAIL: TNF-related apoptosis-inducing ligand.
The augmented proportions of CD69 and NKG2D in NK cells were significantly increased. TRAIL, CD69, NKG2D, DNAM-1, NKp44, and NKp46 expressions in liver NK cells from the DD group were 26.1 ± 19.3%, 90.2 ± 12.7%, 94.9 ± 6.9%, 61.7 ± 17.3%, 27.6 ± 18.5%, and 82.6 ± 11.1%, respectively. In contrast, the expression of the same markers in PBNK cells were 30.6 ± 10.7%, 79.2 ± 24.5%, 86.9 ± 12.6%, 88.8 ± 7.9%, 25.9 ± 9.8%, and 84.5 ± 6.6%, respectively. There was a significant reduction in the proportion of DNAM-1+ NK cells (P < 0.01) and a significant increase in the proportion of NKG2D+ NK cells in the DD group (P < 0.05), whereas TRAIL, CD69, Nkp44, and NKp46 expression levels remained similar.
Correlation Between Cytotoxicity Against Tumor Cell Lines and Each Activation Receptors
After IL-2 stimulation, each NK cell activation marker was evaluated for cytotoxicity against tumor cells, with the percentage of TRAIL+ NK cells correlating most significantly with that of the HepG2 cells (Spearman’s correlation coefficient, 0.66; P = 0.02; Fig. 1B). In addition, we evaluated the correlation between the percentage of TRAIL+ NK cells and the expression of other receptors. We found that the percentage of TRAIL expression on NK cells had a significant correlation with the other receptors, including CD69 (Spearman’s correlation coefficient: 0.56, P < 0.01), NKG2D (0.38, P < 0.01), NKp44 (0.71, P < 0.01), NKp30 (0.50, P < 0.01), and NKG2A (0.44, P < 0.01; Fig. 1C).
When the same markers (CD69, NKp44, NKp30, and NKG2A) were examined for cytotoxic activity in another NK cell-sensitive tumor line, K562, only NKG2D was found to be significantly associated with cytotoxicity (Spearman’s correlation coefficient: 0.42, P = 0.03, Fig. 1D).
Cluster Classification of Liver NK Cells by TRAIL and NKG2D Expression
We then evaluated a combination of TRAIL and NKG2D expression to investigate the association with donor background factors. Using K-means cluster analysis, donors were separated into three distinct groups according to the observed proportions of TRAIL and NKG2D in liver NK cells. Cluster 1 was identified as a group with low NKG2D and TRAIL expression (N = 4); cluster 2, comprising most samples (N = 32), was characterized by high NKG2D expression and low TRAIL expression; and cluster 3 (N = 15) was characterized by high expression of both NKG2D and TRAIL. The distribution of these markers within each cluster is shown in Fig. 2. The proportion of TRAIL+ NK cells in clusters 1, 2, and 3 was 15.7 ± 9.2%, 12.1 ± 7.7%, and 51.8 ± 10.9%, respectively. Similarly, the percentages of NKG2D+ NK cells in each cluster were 15.7 ± 9.2%, 12.1 ± 7.7%, and 51.8 ± 10.9%, respectively. Cluster 3 (high NKG2D and high TRAIL group) had significantly higher percentages of CD69+ (98.0 ± 3.1%), NKp44+ (43.8 ± 18.8%), and NKp30+ (92.2 ± 10.4%) NK cells compared to the other groups.
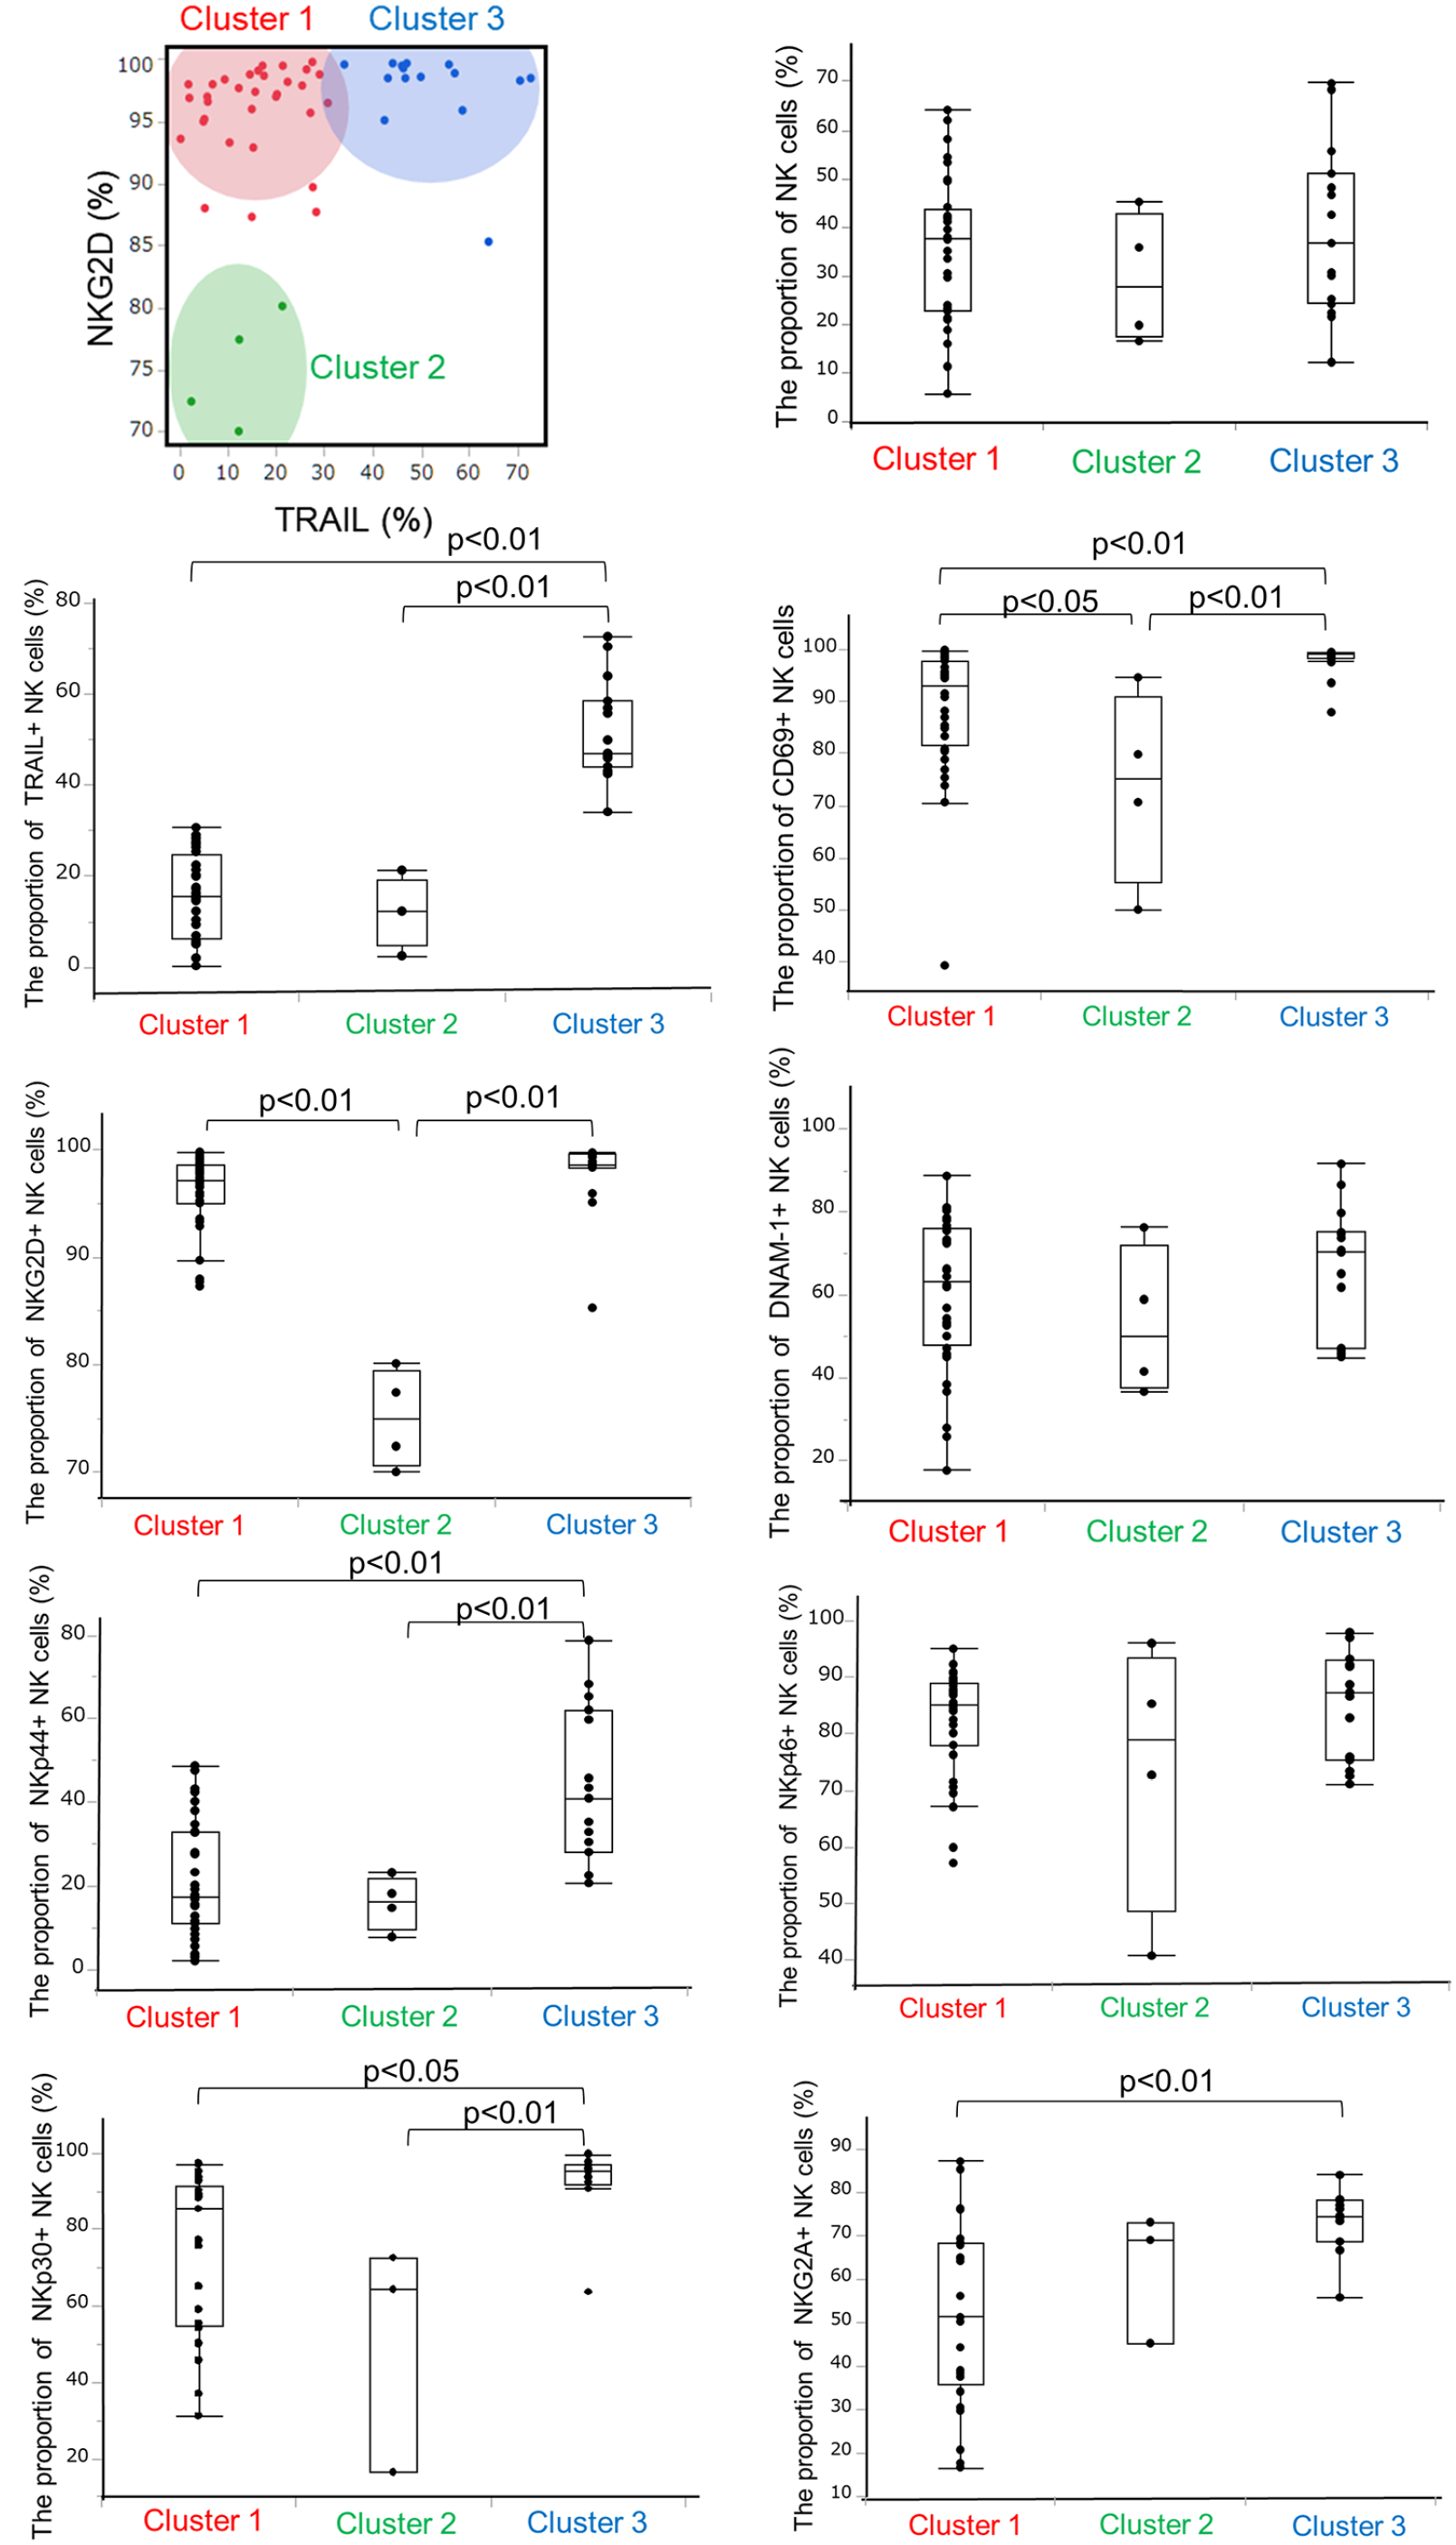
Each activation marker according to the cluster classification.
The donor factors associated with each cluster are summarized in Table 2. While no significant difference was observed, cluster 3 (high NKG2D and high TRAIL group) had a lower median BMI (25.1 kg/m2) and a lower median APRI (0.37) than the other groups. They also had a significantly lower Fib-4 index (median, 0.15; P = 0.03).
Donor Background According to the Expression of TRAIL and NKG2D.
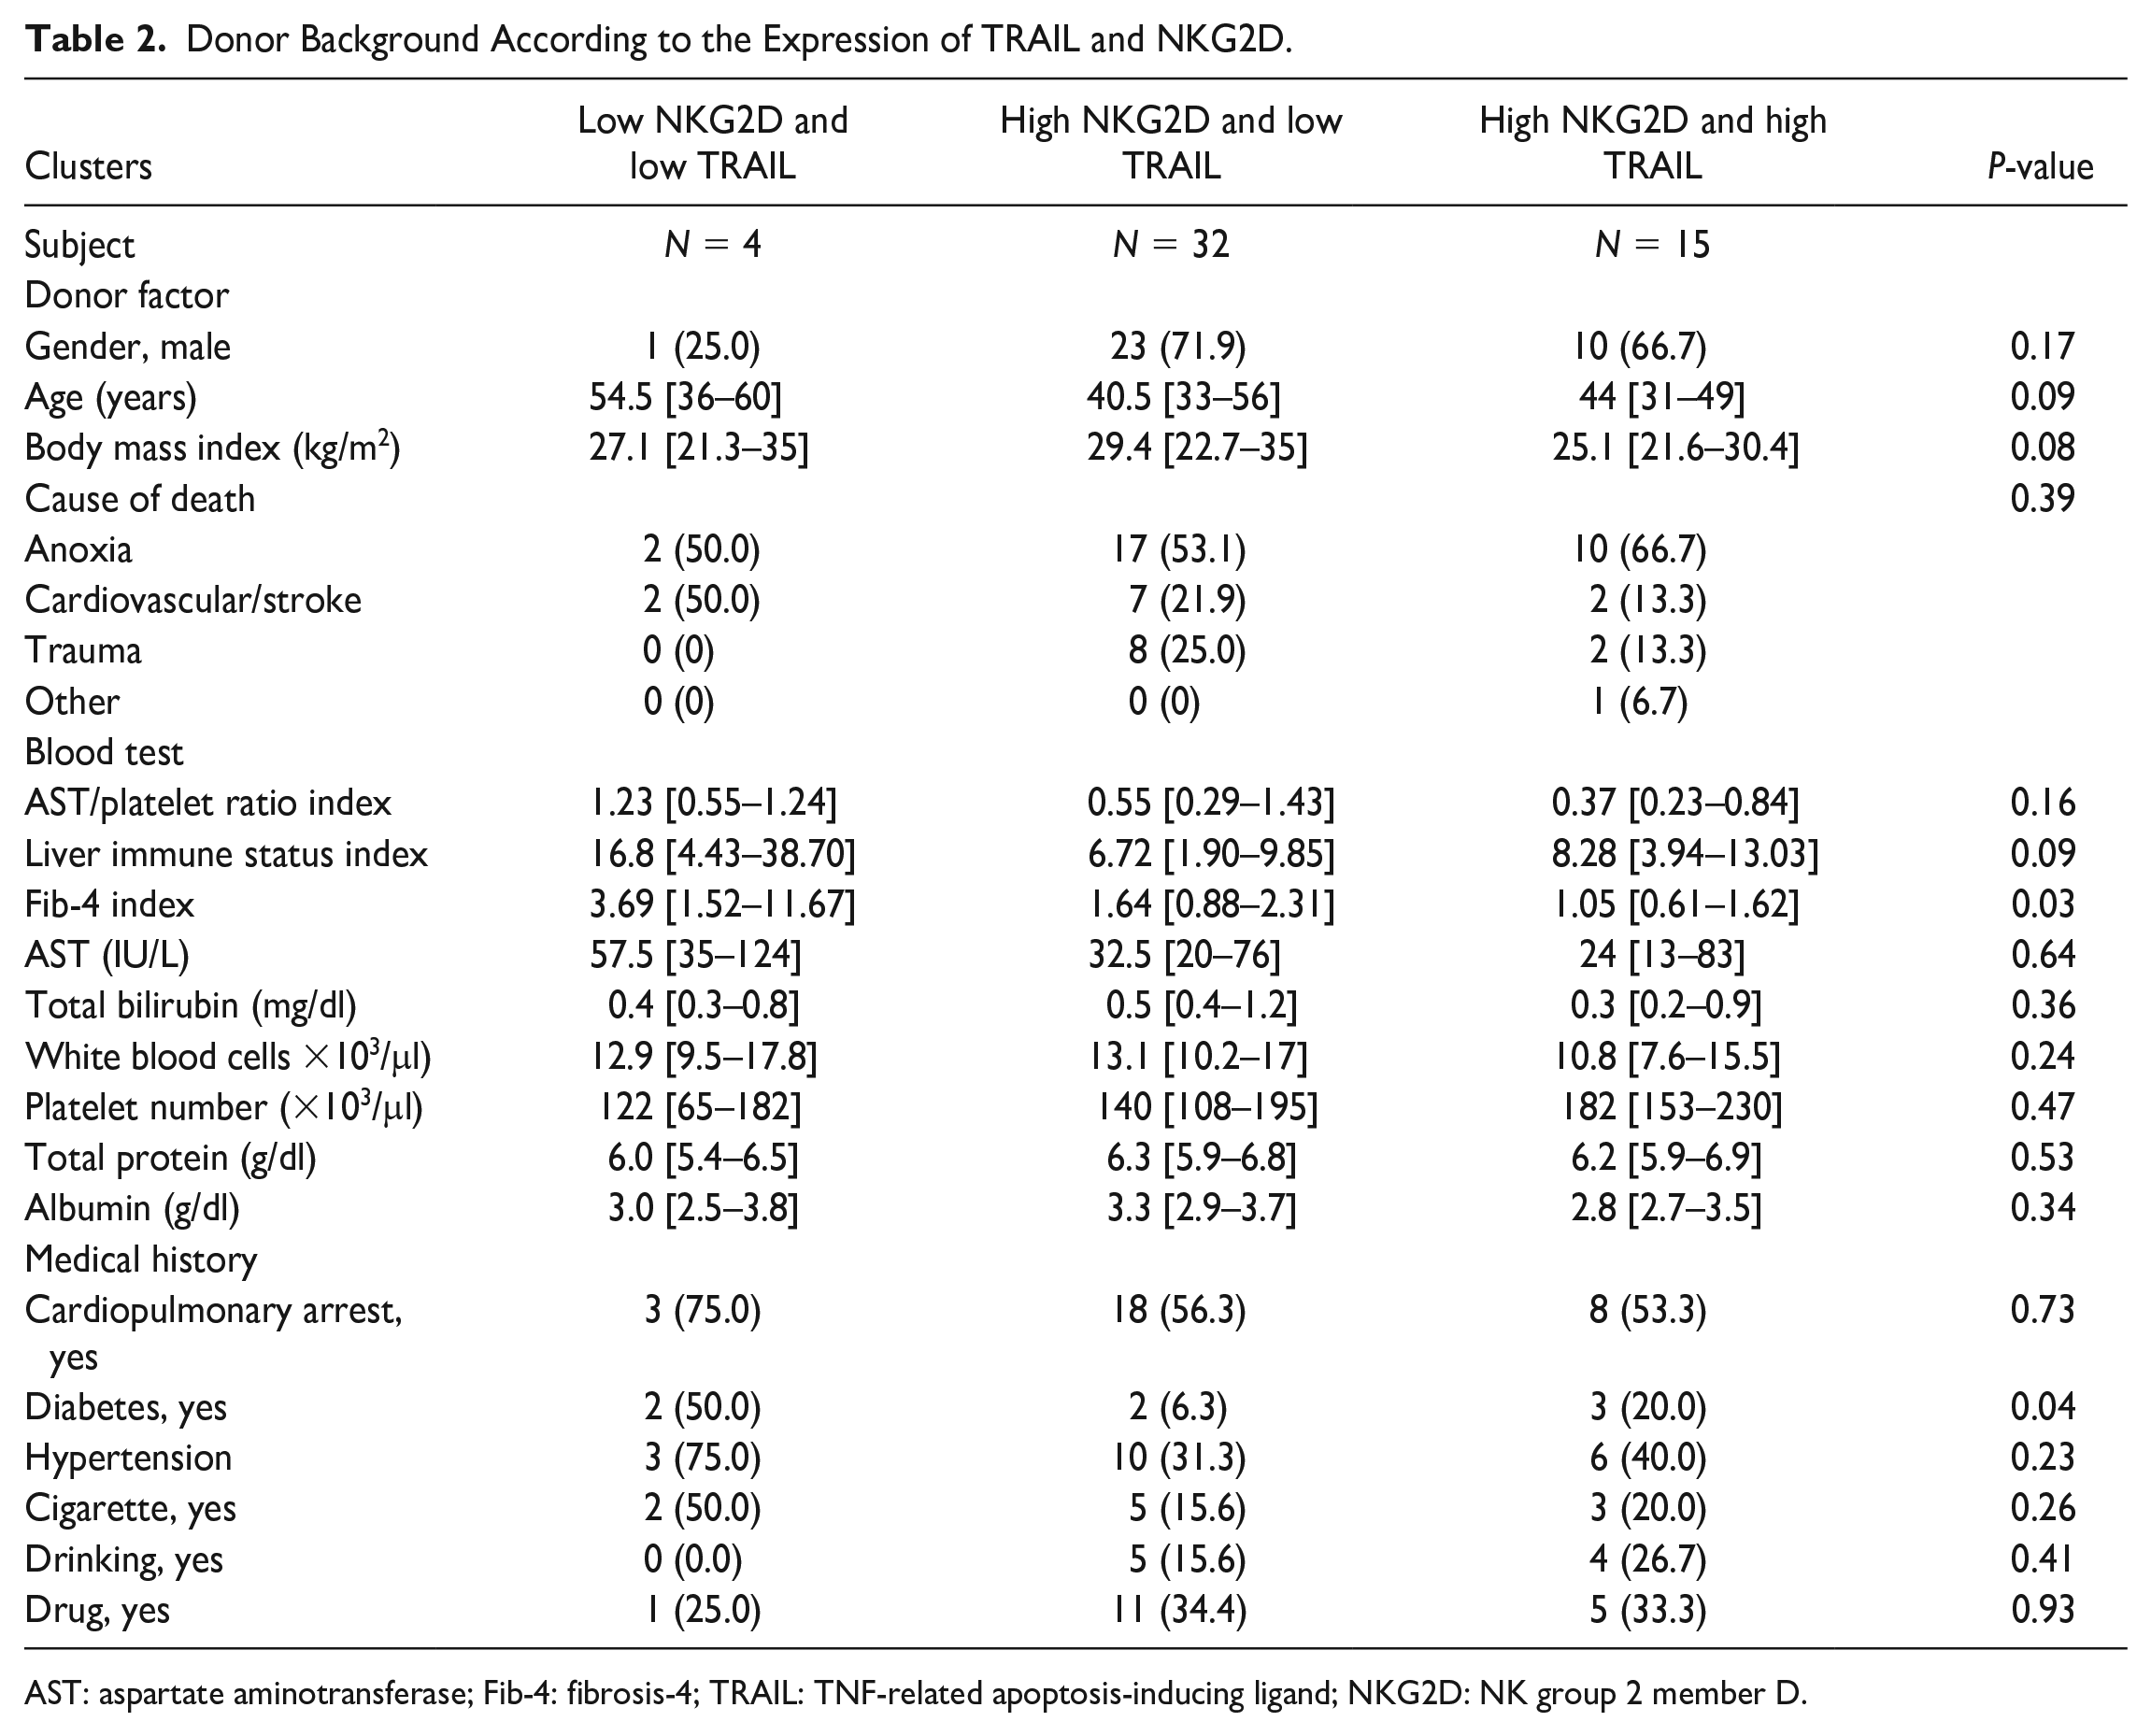
AST: aspartate aminotransferase; Fib-4: fibrosis-4; TRAIL: TNF-related apoptosis-inducing ligand; NKG2D: NK group 2 member D.
Predictive Factors for a Higher Proportion of TRAIL+ and NKG2D+ NK Cells
In the previous section, cluster 3 was defined as a higher proportion of TRAIL+ and NKG2D+ NK cells. This association indicated that a high proportion of TRAIL+ and NKG2D+ NK cells could potentially serve as a predictive indicator of the antitumor efficacy of liver NK cells. In this section, we describe donor factors associated with elevated TRAIL (>40%) and NKG2D (>95%) levels in liver NK cells. A subset analysis of the 51 DDs indicated that the white blood cell (WBC) count [odds ratio (OR) 0.82, 95% confidence interval (CI) 0.66–0.99, P = 0.04], AST level (OR 0.98, 95% CI 0.96–0.99, P = 0.02), BMI (OR 0.87, 95% CI 0.77–0.99, P = 0.02), and platelet count (OR 1.02, 95% CI 1.00–1.03, P = 0.02) were significantly correlated with enhanced TRAIL (>40%) and NKG2D (>95%) expression in liver NK cells (Table 3).
Predictive Factors for a Higher Proportion of TRAIL+ and NKG2D+ NK Cells.
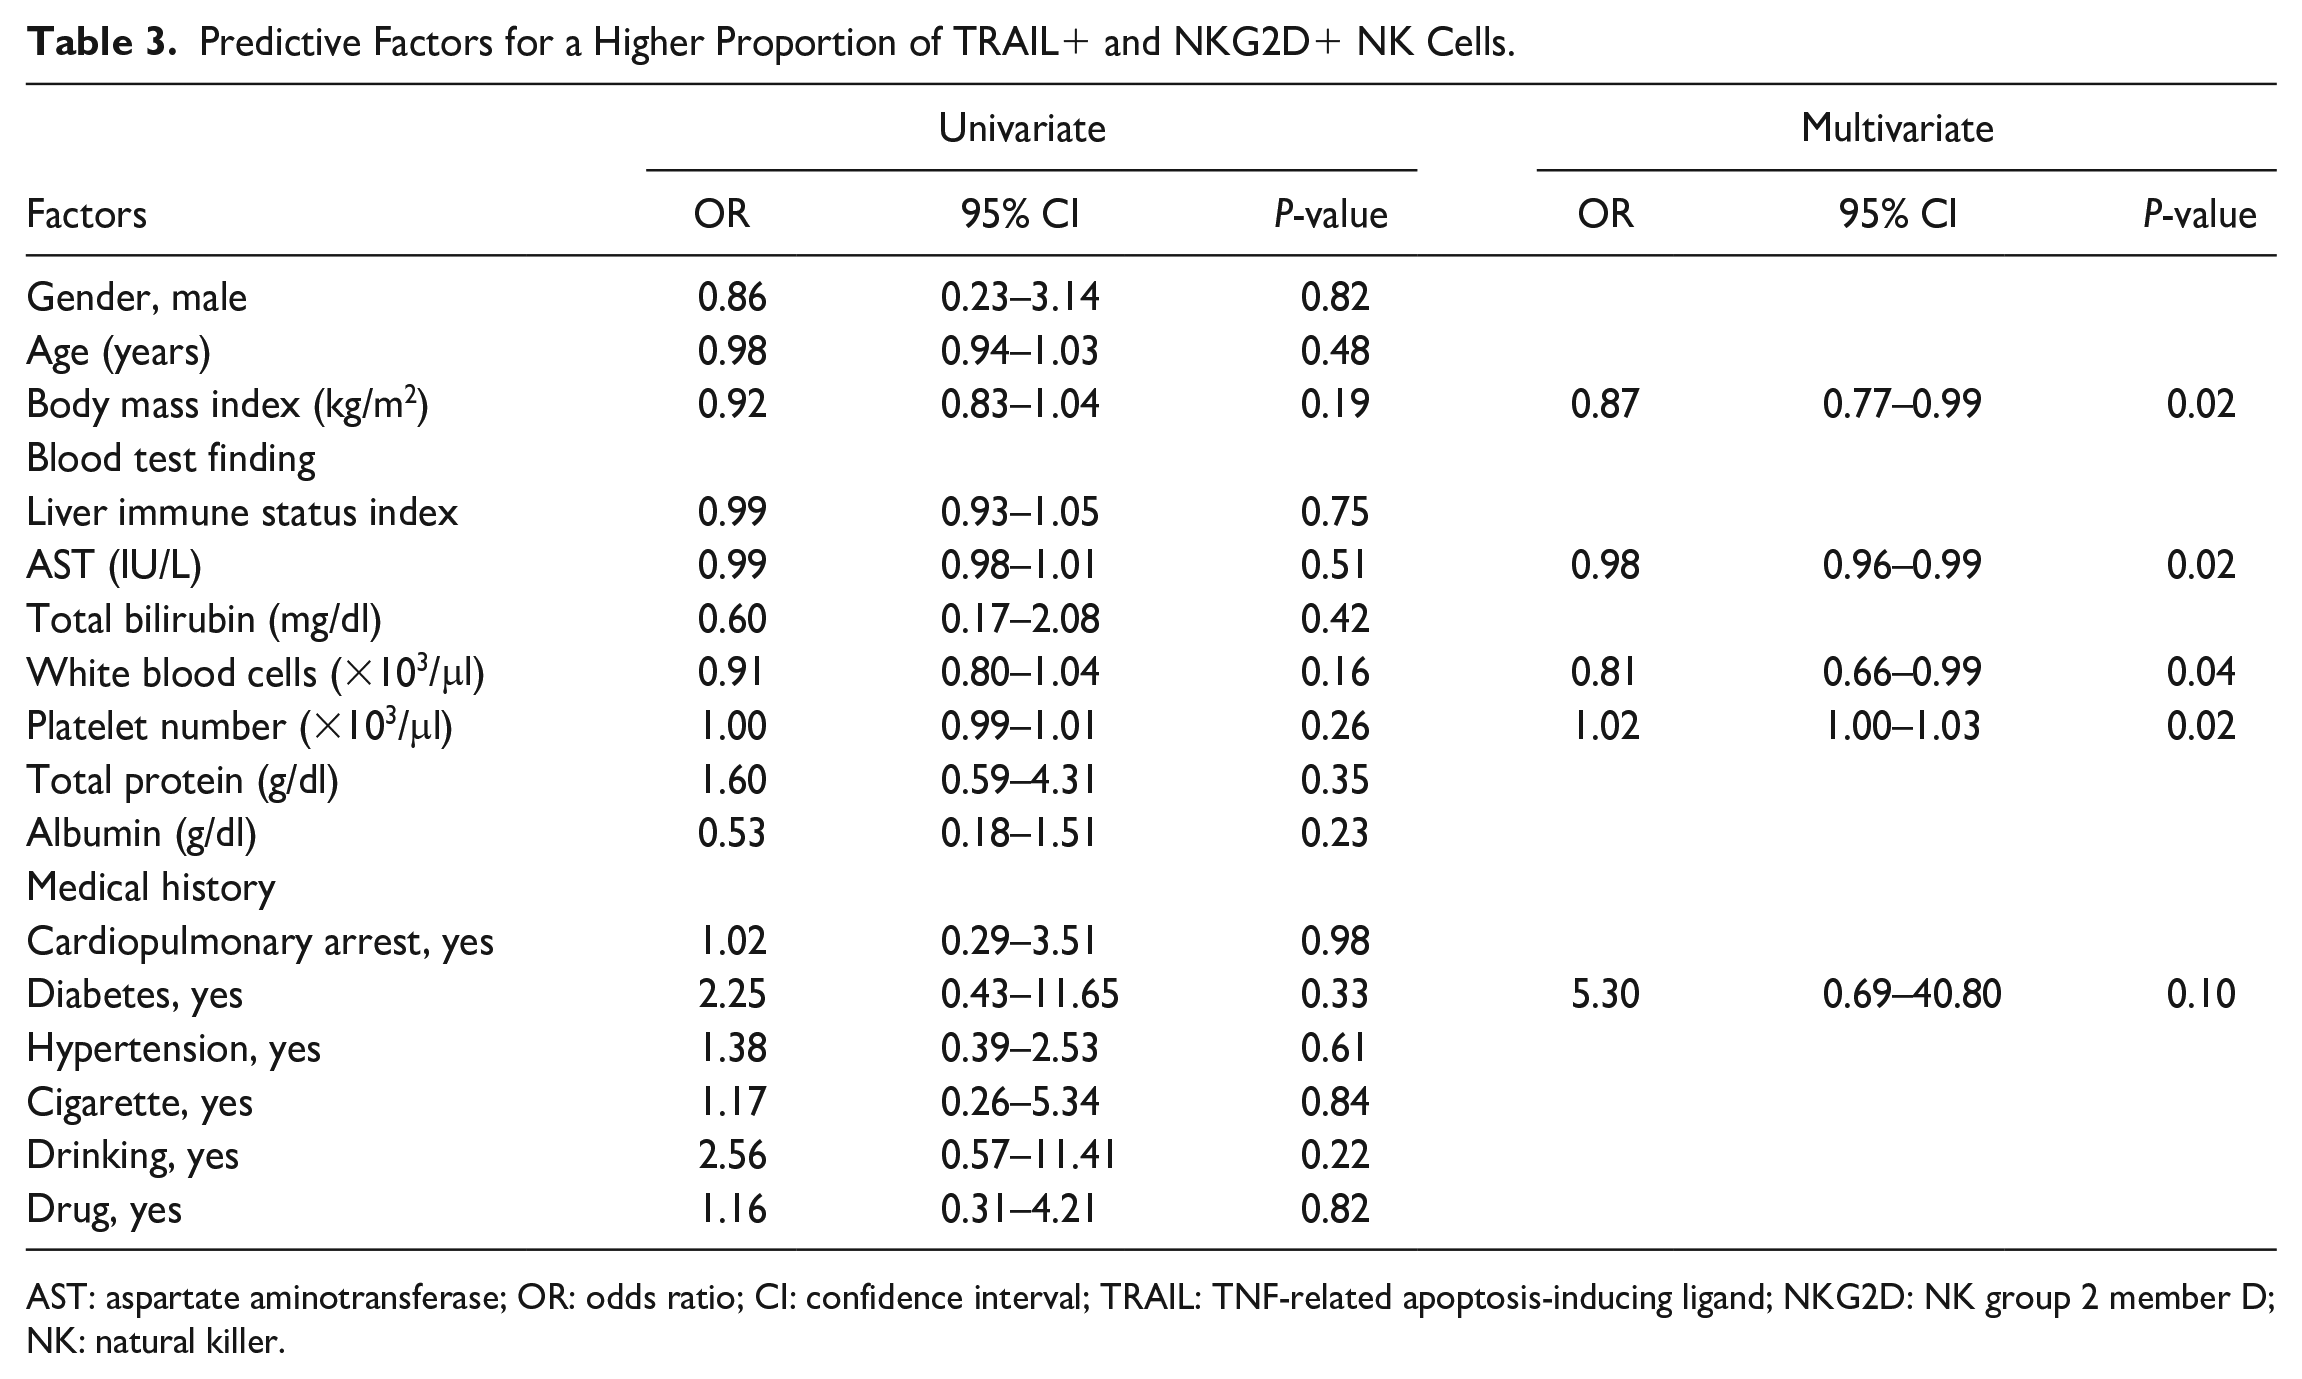
AST: aspartate aminotransferase; OR: odds ratio; CI: confidence interval; TRAIL: TNF-related apoptosis-inducing ligand; NKG2D: NK group 2 member D; NK: natural killer.
Predictive Scores for the High Proportion of Activation Markers of Liver NK Cells
APRI, which was calculated from AST levels and platelet numbers 20 , was inversely correlated with the proportion of TRAIL+ NK cells (Spearman’s correlation coefficient: −0.36, P = 0.01; Fig. 3A). We used APRI, BMI, and WBC count, which were independent factors that had significant correlation TRAIL and NKG2D levels in liver NK cells, to develop a predictive score to differentiate TRAIL+ and NKG2D+ NK cell proportions. Based on the APRI grade, the low-risk group (<0.5) was assigned a score of 0, the moderate-risk group (0.5–1.5) had a score of 1, and the high-risk group (>1.5) had a score of 2. In addition, 1 point was added for patients with BMI >25% or WBC count >11,000/μl. The predictive score was calculated by adding these points (minimum, 0 point; maximum, 4 points). Three distinct patterns were identified in the predictive score distribution (the second row, Supplemental Table 1). Among the 51 cases, the distribution of the predictive scores was relatively balanced. Scores of 1 and 2 were the most commonly observed, occurring in 35.3% of cases. The scores at the extremes were less prevalent, with only 2.0% of cases scoring 0, 23.5% scoring 3, and 3.9% scoring 4.
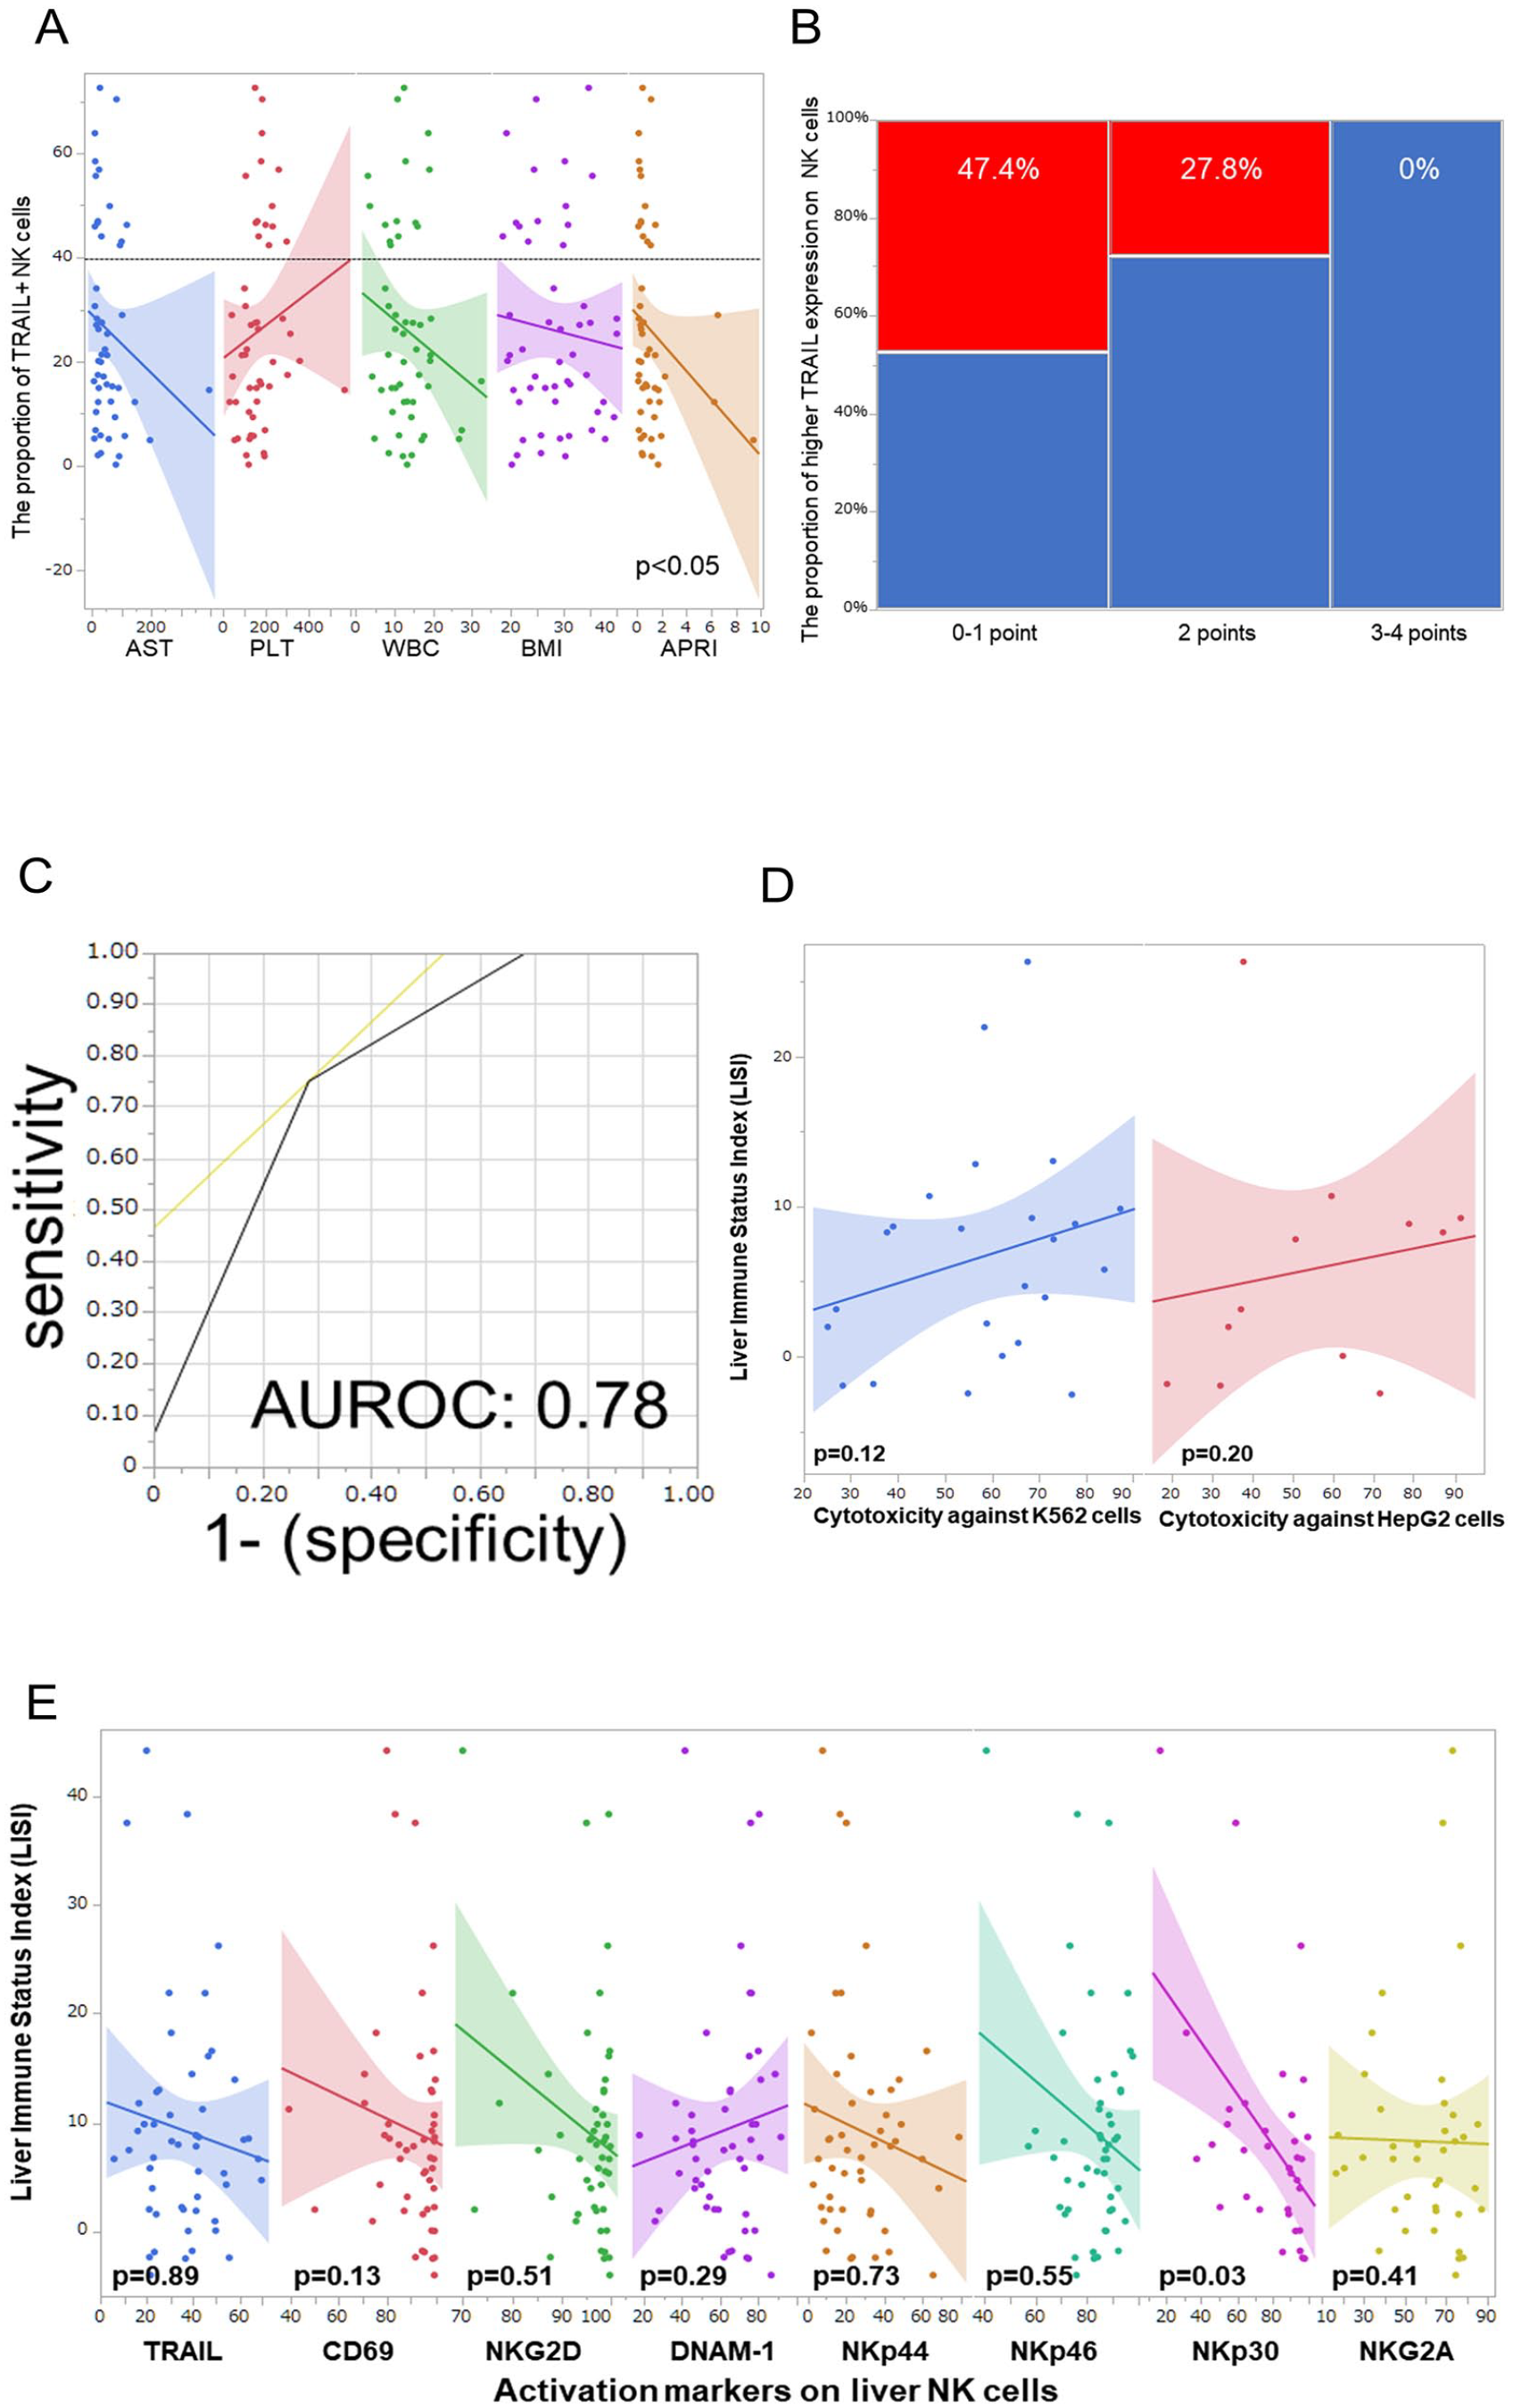
The predictive score system. (A) The correlation between the proportion of TRAIL+ NK cells and each predictive factor. (B) The predictive score can predict the proportion of higher TRAIL expression on liver NK cells. (C) AUROC of the predictive score for higher TRAIL expression on liver NK cells. (D) The cytotoxicity against tumor cell lines. (E) Correlation between the LISI and each activation marker. NK: natural killer; TRAIL: TNF-related apoptosis-inducing ligand; AUROC: area under the receiver operating characteristic curve; LISI: liver immune status index.
The distribution of patients in the high TRAIL group was characterized by a distinct decline across the point-based scale: 100% at 0 points, 44.4% at 1 point, 35.7% at 2 points, and complete absence (0%) at both 3 and 4 points. When categorized into broader score ranges, the high TRAIL group exhibited the following percentages: 47.4% for scores 0–1, 27.8% for score 2, and 0% for scores 3–4 (P = 0.01, Fig. 3B). The AUROC of the predictive score for a higher proportion of TRAIL+ NK cells was 0.78 (Fig. 3C). However, LISI was not correlated with the cytotoxicity of liver NK cells against tumor lines (Fig. 3D) and activation markers, excepting NKp30 (Fig. 3E).
Furthermore, this study detailed the mean expression of various NK cell markers according to the predictive score. The mean proportion of liver NK cells in scores 0–1, score 2, and scores 3–4 was reported as 35.9 ± 16.2%, 41.4 ± 14.2%, and 29.3 ± 14.3%, respectively. (P < 0.05; Fig. 4) The mean proportions of TRAIL+ NK cells were reported as 33.4 ± 21.4%, 29.8 ± 17.3%, and 11.2 ± 8.4% across the respective score ranges (P < 0.01, Fig. 4). Specifically, the mean proportions of CD69+ NK cells were 88.3 ± 17.5%, 95.7 ± 4.5%, and 85.6 ± 9.8%, respectively (Fig. 4). The mean proportions of NKG2D+ NK cells were 95.0 ± 7.1%, 96.5 ± 4.9%, and 92.8 ± 8.6% (P < 0.05), while those of DNAM-1+ NK cells were 67.8 ± 15.2%, 63.4 ± 16.3%, and 51.2 ± 17.6% (P < 0.01, Fig. 4). Moreover, the mean proportions for NKp44+ and NKp46+ NK cells were reported as 35.7 ± 7.1%, 29.2 ± 15.2%, and 15.4 ± 12.0%, and 85.0 ± 10.1%, 83.3 ± 8.2%, and 78.4 ± 14.7% (Fig. 4), respectively. Finally, the mean proportions of NKp30+ and NKG2A + NK cells were found to be 78.8 ± 16.4%, 93.8 ± 3.4%, and 55.9 ± 24.4% (P < 0.01), and 63.4 ± 17.3%, 60.4 ± 20.6%, and 52.6 ± 21.1% (Fig. 4), respectively. The results of this study are summarized in Fig. 5.
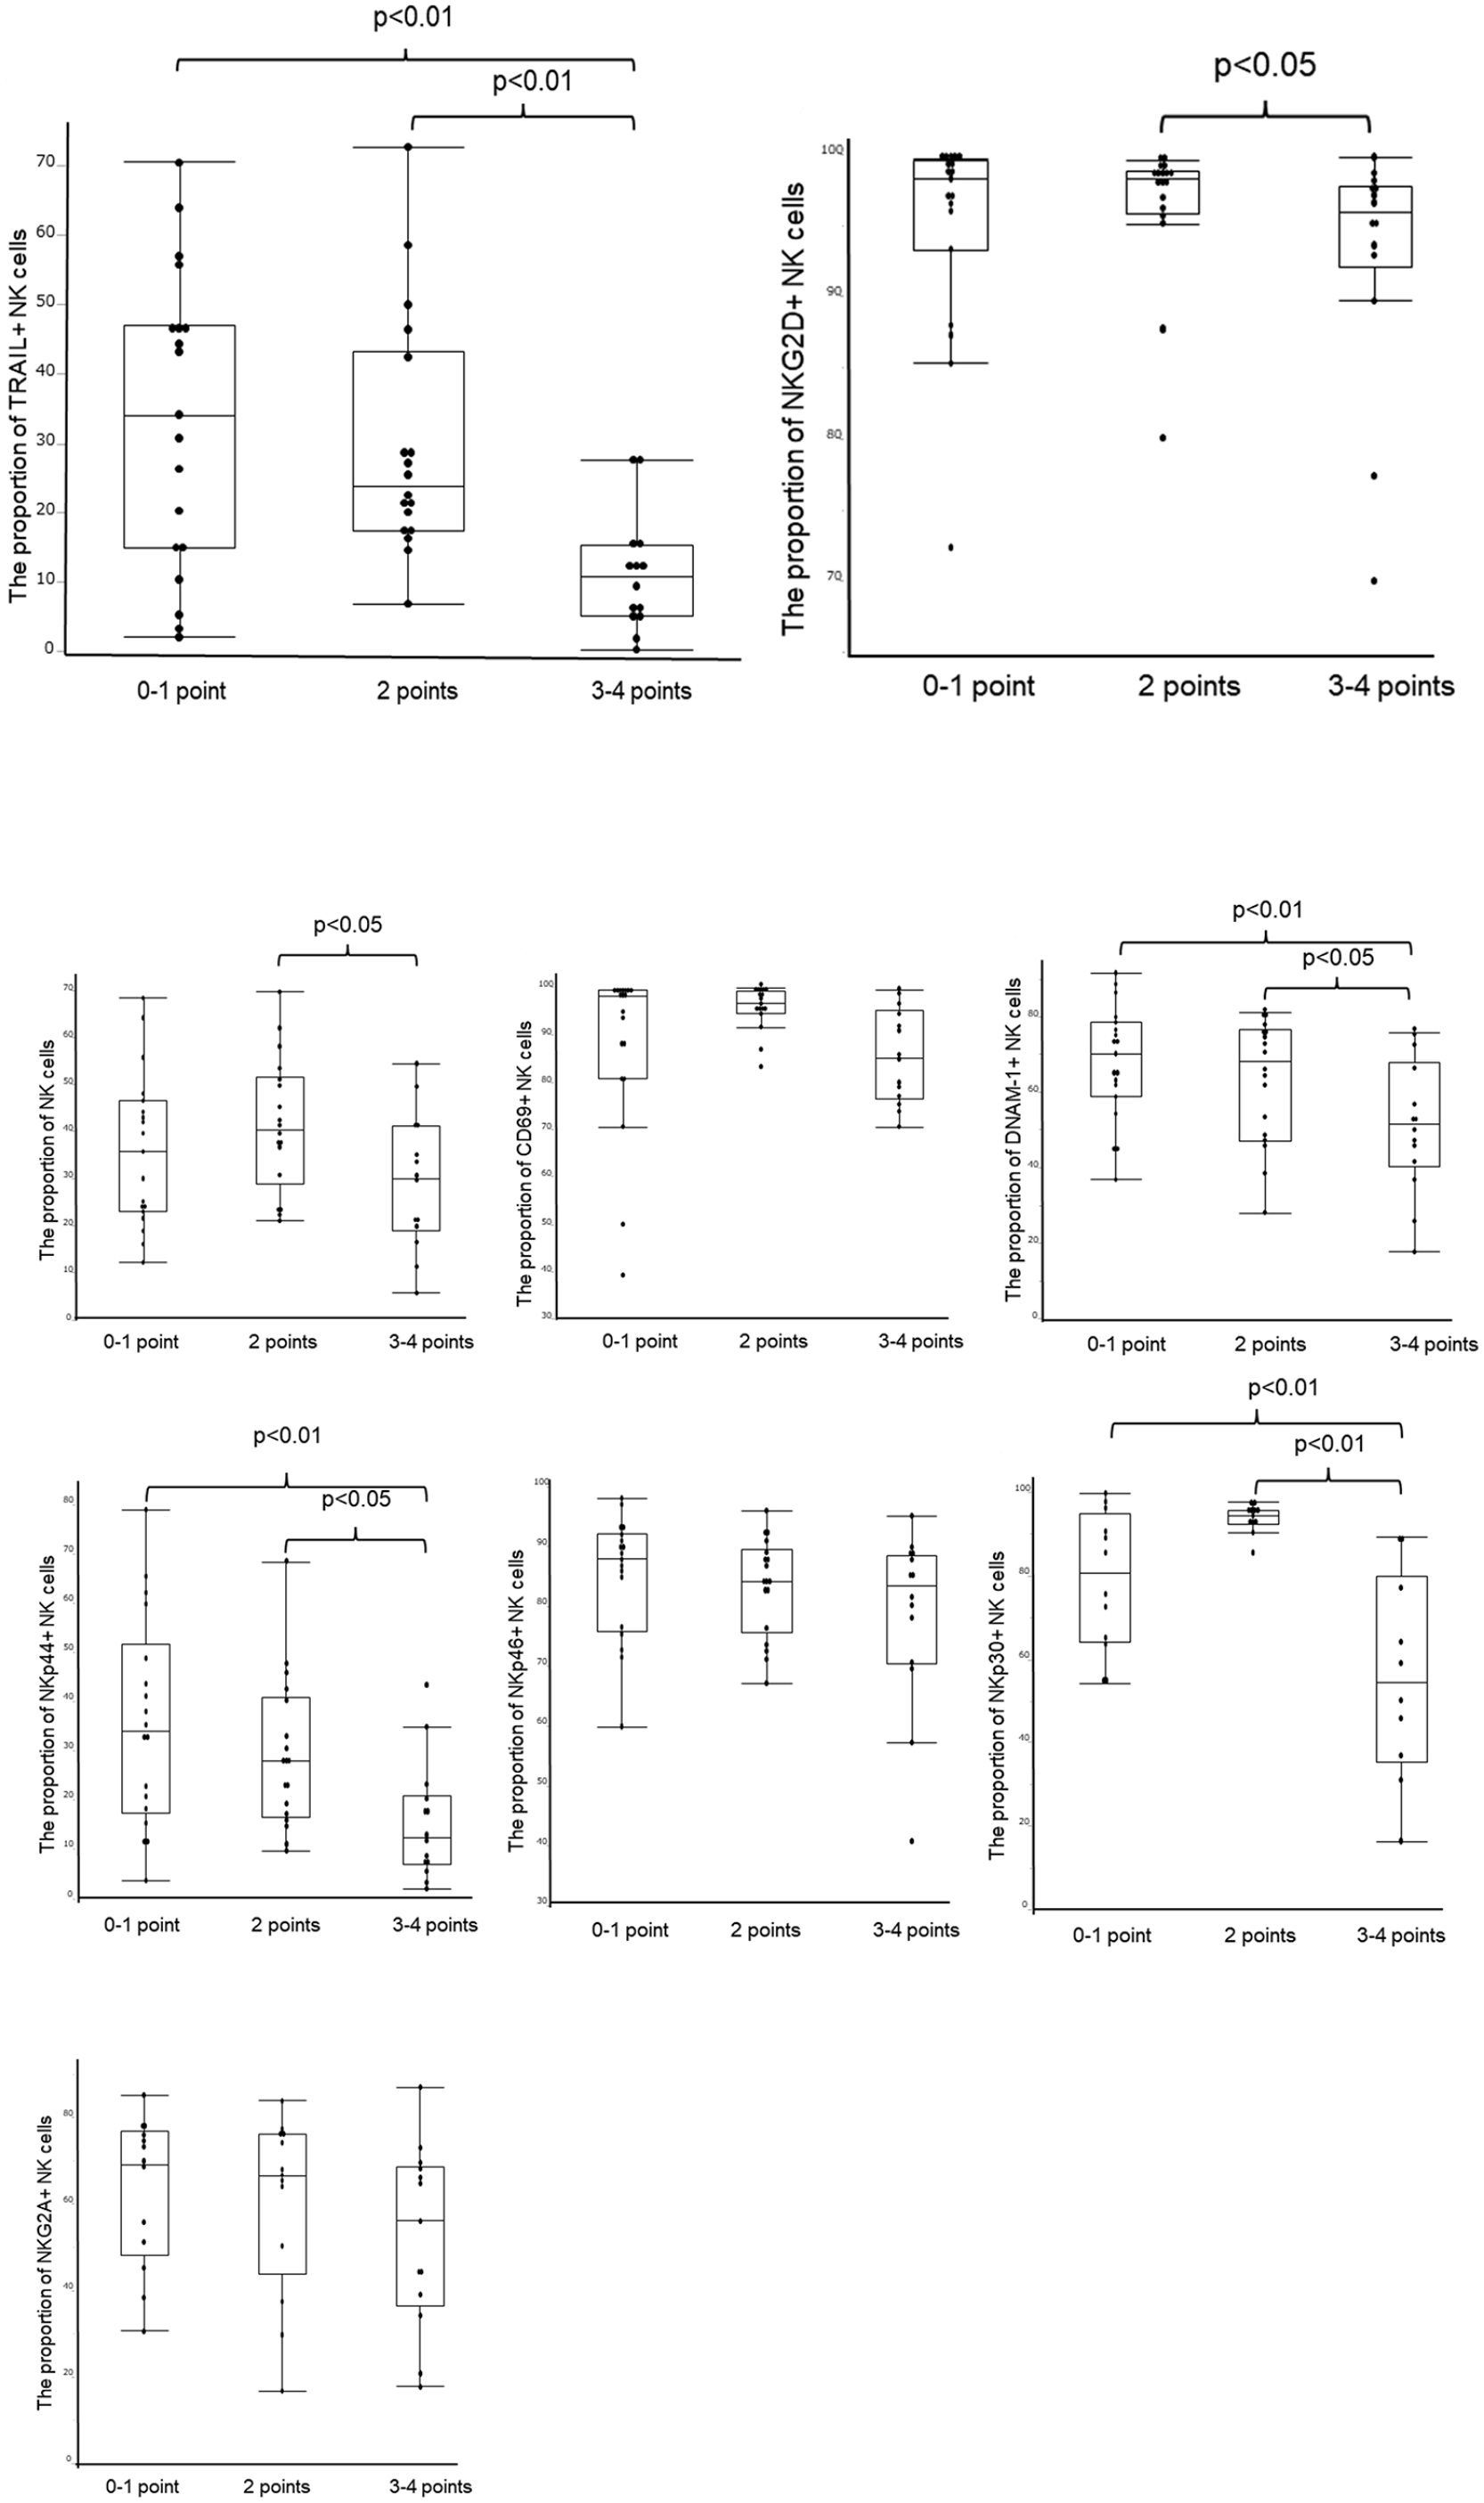
Correlation between the predictive score system and each activation marker.
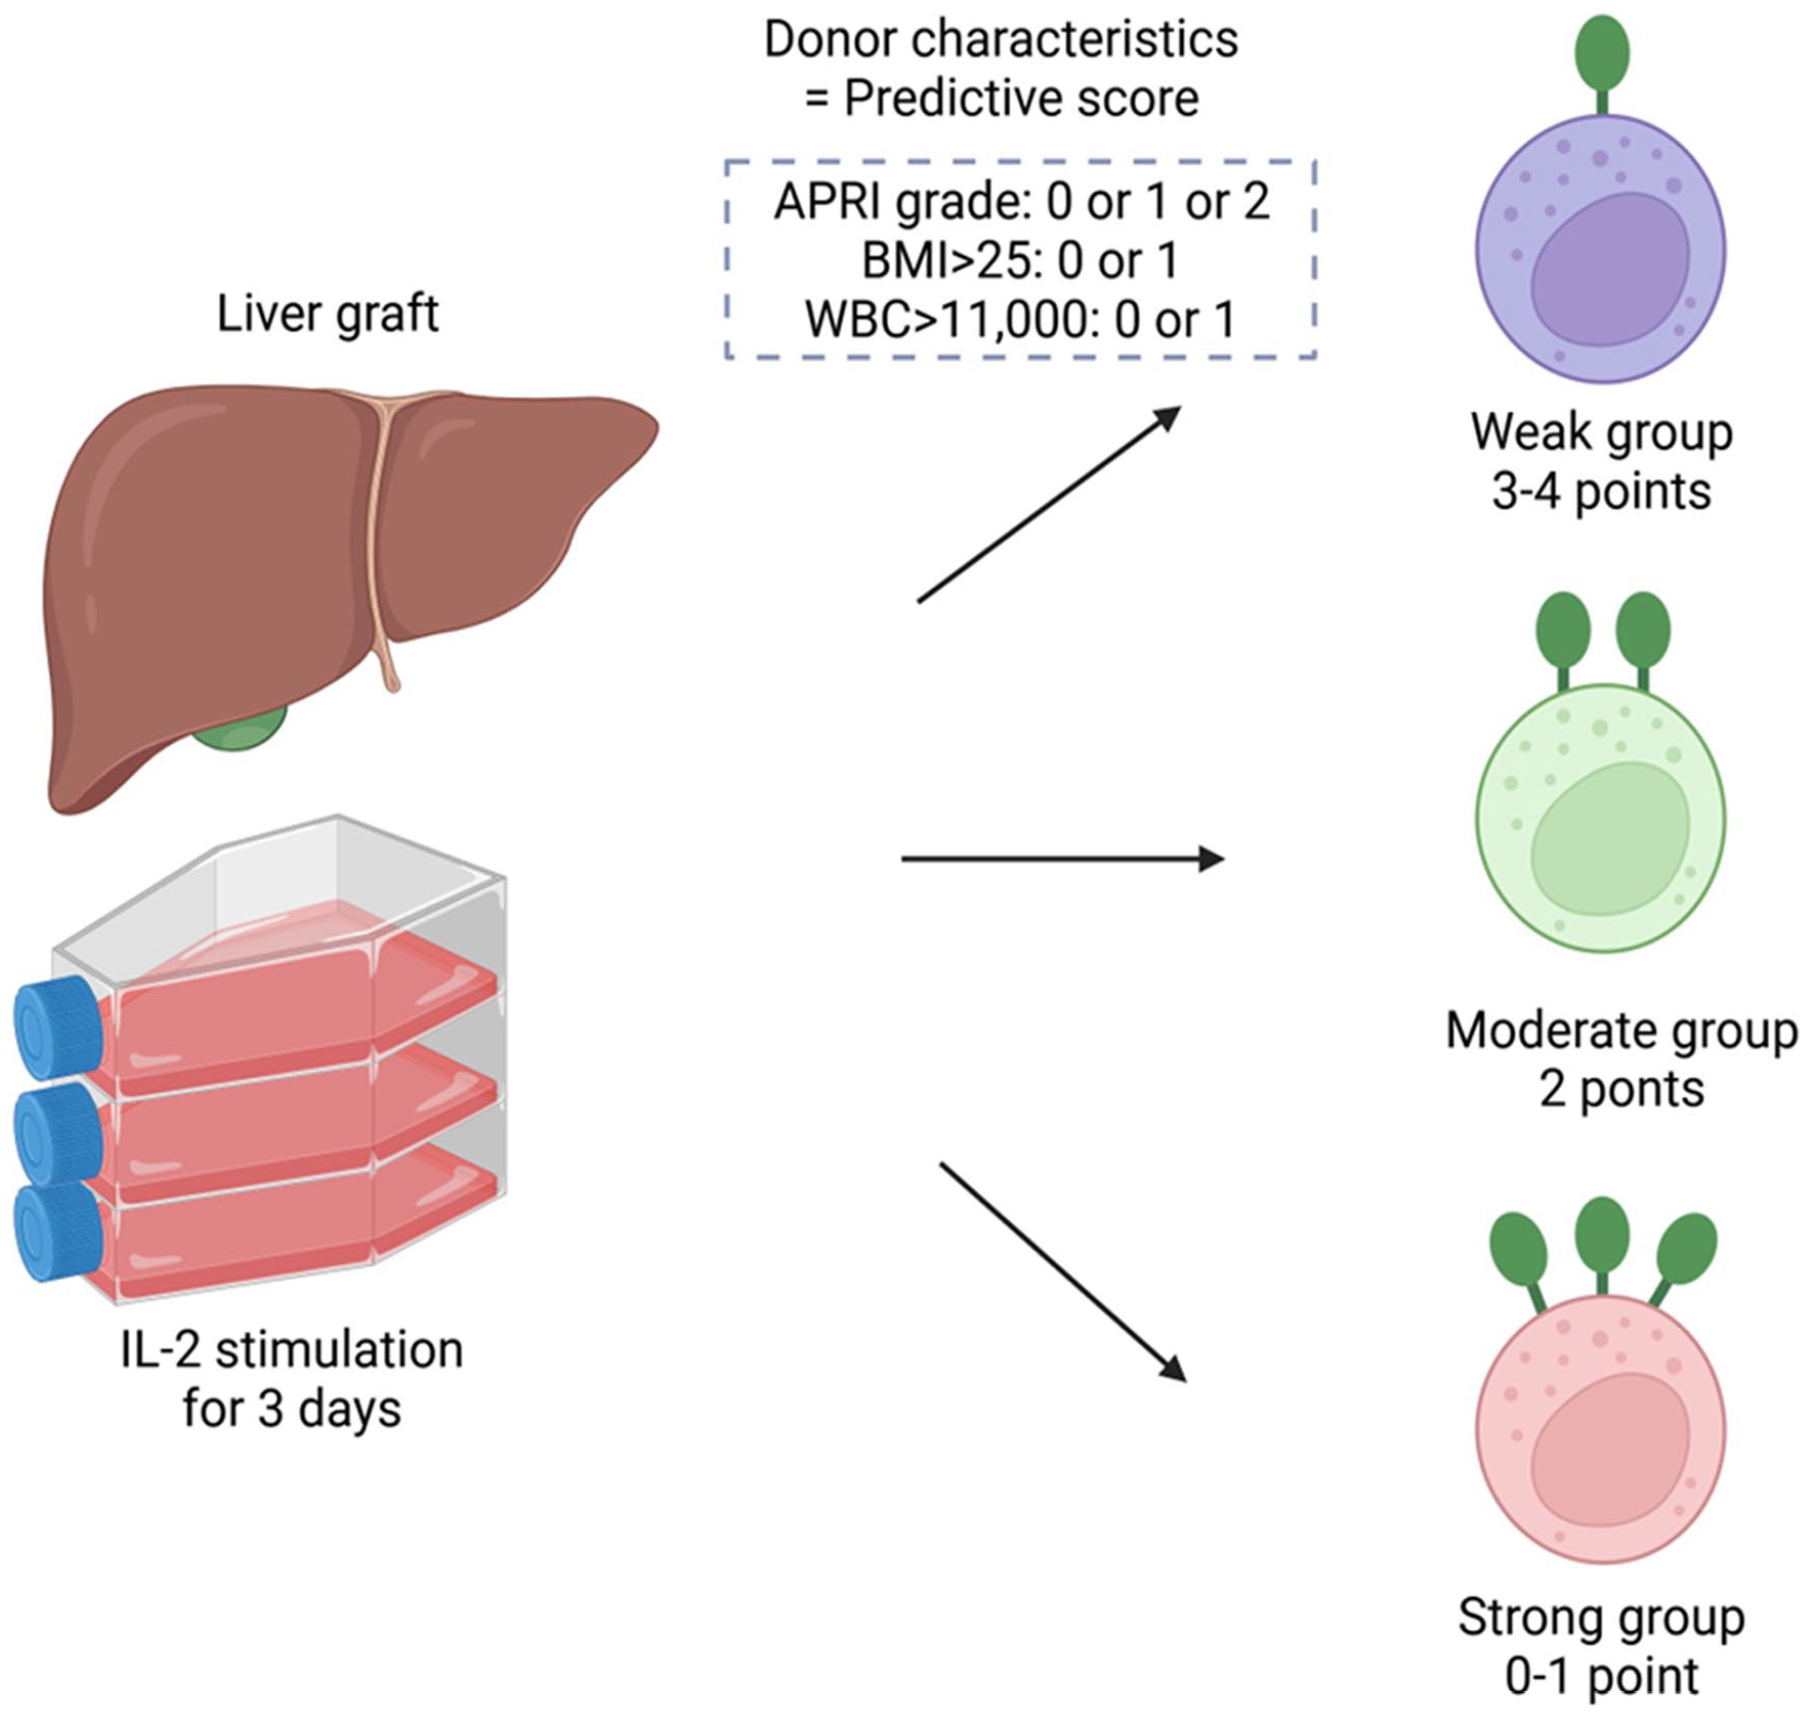
The study summary. IL-2: interleukin-2; APRI: AST platelet ratio index; BMI: body mass index; WBC: white blood cell.
Discussion
Predicting variations in the activation markers of liver NK cells based on donor factors is a complex task. Through this study, we successfully developed a practical scoring system that allows for the prediction of activation marker variation in liver NK cells, based on a comprehensive analysis of liver NK cells derived from DDs. The presence of a higher proportion of TRAIL+ and NKG2D+ NK cells, which activate better and kill tumors more effectively, was associated with favorable donor health conditions, such as low liver fibrosis (normal APRI), absence of obesity or overweight (normal BMI), and lack of inflammation (normal WBC count; Fig. 5). This scoring system can be utilized to more accurately identify DDs who possess high-quality liver NK cells and to more efficiently isolate effective cells for use in cell therapy.
NK cells represent the first line of defense against infectious agents and cancers. As innate lymphocytes, NK cells play a pivotal role in detecting and eliminating CTCs to prevent cancer recurrence 22 . Previous research has demonstrated NK cell as potential cancer immunotherapy by modulating its activation 23 . Liver antitumor immunity in LTx recipients is generally diminished 13 , due to the suppressed T cell–based acquired immune system by immunosuppression after LTx3–5. Thus, adoptive cell therapy using cells other than T cells, such as NK cells, may be a promising candidate for adjuvant therapy after LTx for HCC. NK cell activation is regulated by a series of activators and co-stimulators (summarized in Supplemental Table 2) and inhibitory receptors, including KIR2DL1-3, KIR3DL1-2, NKG2A/CD94, TIGIT, PD-1, LAG-3, and Tim-324–26. NK cells also attack tumor cells through the release of perforin, granzyme B, and interferon-gamma via exocytosis pathways 27 . NK cell effector function in melanoma patients is diminished by the downregulation of NKG2D, NKp46, and DNAM-1 receptors 28 . In multiple myeloma, altered expression of CD161 activating receptor (KLRB1) and CD158a KIR inhibitory receptor likely reduces NK cell antitumor activity 29 . Reduced NKG2D and NKp30 expression, along with increased TIGIT and TIM3 expression, is associated with impaired NK cell antitumor effects in patients with HCC26,30,31. Recent studies using single-cell ribonucleic acid (RNA) sequence test32,33 identified genes that were differentially expressed in liver NK cells and conventional NK cells. Genes with increased expression in liver NK cells include EOMES and CXCR6, which have been validated as protein-level phenotypic markers. The liver NK cell cluster upregulates activating receptor genes, such as CD160, CD27, CD7, IL2RB, TMIGD2, TNFSF14, and SH2D1A, which are involved in signal transduction. Regarding inhibitory receptors, liver NK cells upregulate KLRB1, KLRC1 (related to NKG2A), and TIGIT 34 .
Two tumor cell lines were used in this study to evaluate specific liver NK cell cytotoxicity via the TRAIL–TRAIL-DR pathway. K562 cells exhibited a relatively low expression of TRAIL-DR4/5, which reflects the non-TRAIL–related cytotoxicity of NK cells. In contrast, HepG2 cells show high expression of TRAIL-DR4/5, which enables the assessment of TRAIL-dependent cytotoxicity specific to liver NK cells. Our results indicate that cytotoxicity toward K562 cells is correlated with NKG2D expression, whereas in HepG2 cells, it is correlated with TRAIL expression. HCC tumor cells express both NKG2D ligand35–37 and TRAIL-DR 13 , which allows for a comprehensive evaluation of the cytotoxicity of liver NK cells by comparing these two tumor cell lines. Unlike NK cells from PB, liver NK cells exhibit an immature phenotype (CD56bright and CD16low) and unique ligand expression, such as TRAIL, CD69, EOMES, and CXCR613,15,38. Liver NK cells demonstrate significant cytotoxicity against HCC cells through the TRAIL–TRAIL-DR pathway13,39. TRAIL expression in NK cells is significantly correlated with other activation markers, and TRAIL and NKG2D were useful indicators of the antitumor activity of NK cells. Therefore, adoptive cell therapy using liver NK cells may be an effective therapeutic strategy.
Our analysis revealed significant variability in the quality of liver NK cells among DDs. Based on the results of this study, we developed a practical scoring system that utilized parameters such as APRI, BMI, and WBC count to accurately predict the quality of liver NK cells. This novel observation may enable the identification of donors with more potent NK cells with high TRAIL and NKG2D expressions, which would allow for better selection and more efficient isolation of liver NK cells for the purpose of adoptive immunotherapy. We have previously analyzed NK cells from LD grafts and developed LISI 16 . The characteristics of DDs differ significantly from those of LDs (Table 4). Thus, LISI did not predict the antitumor activity of NK cells significantly in the DD cohort. LISI and the scores developed in this study share significant similarities; both APRI and Fib-4 index are noninvasive liver fibrosis scores. The median BMI differs, being 28.4 in the DD cohort compared to 22.0 in the LD cohort 16 , implying that a normal BMI (18.5–25 kg/m2) may maintain liver NK cell activity. The serum albumin level, another LISI factor, is greatly influenced by infusion for treatment and inflammation before brain death determination. Thus, while fibrosis and BMI predictors are common, differences in albumin level and WBC count arise from varying donor backgrounds with inflammation. The combination of WBC count and platelets, such as WBC count to mean platelet volume ratio and neutrophil-to-platelet ratio, has also been demonstrated as a biomarker reflecting inflammation 40 . Inflammatory cytokines have been reported to decrease NK cell activity41–45.
Deference Between the Living Donor and Deceased Donor.
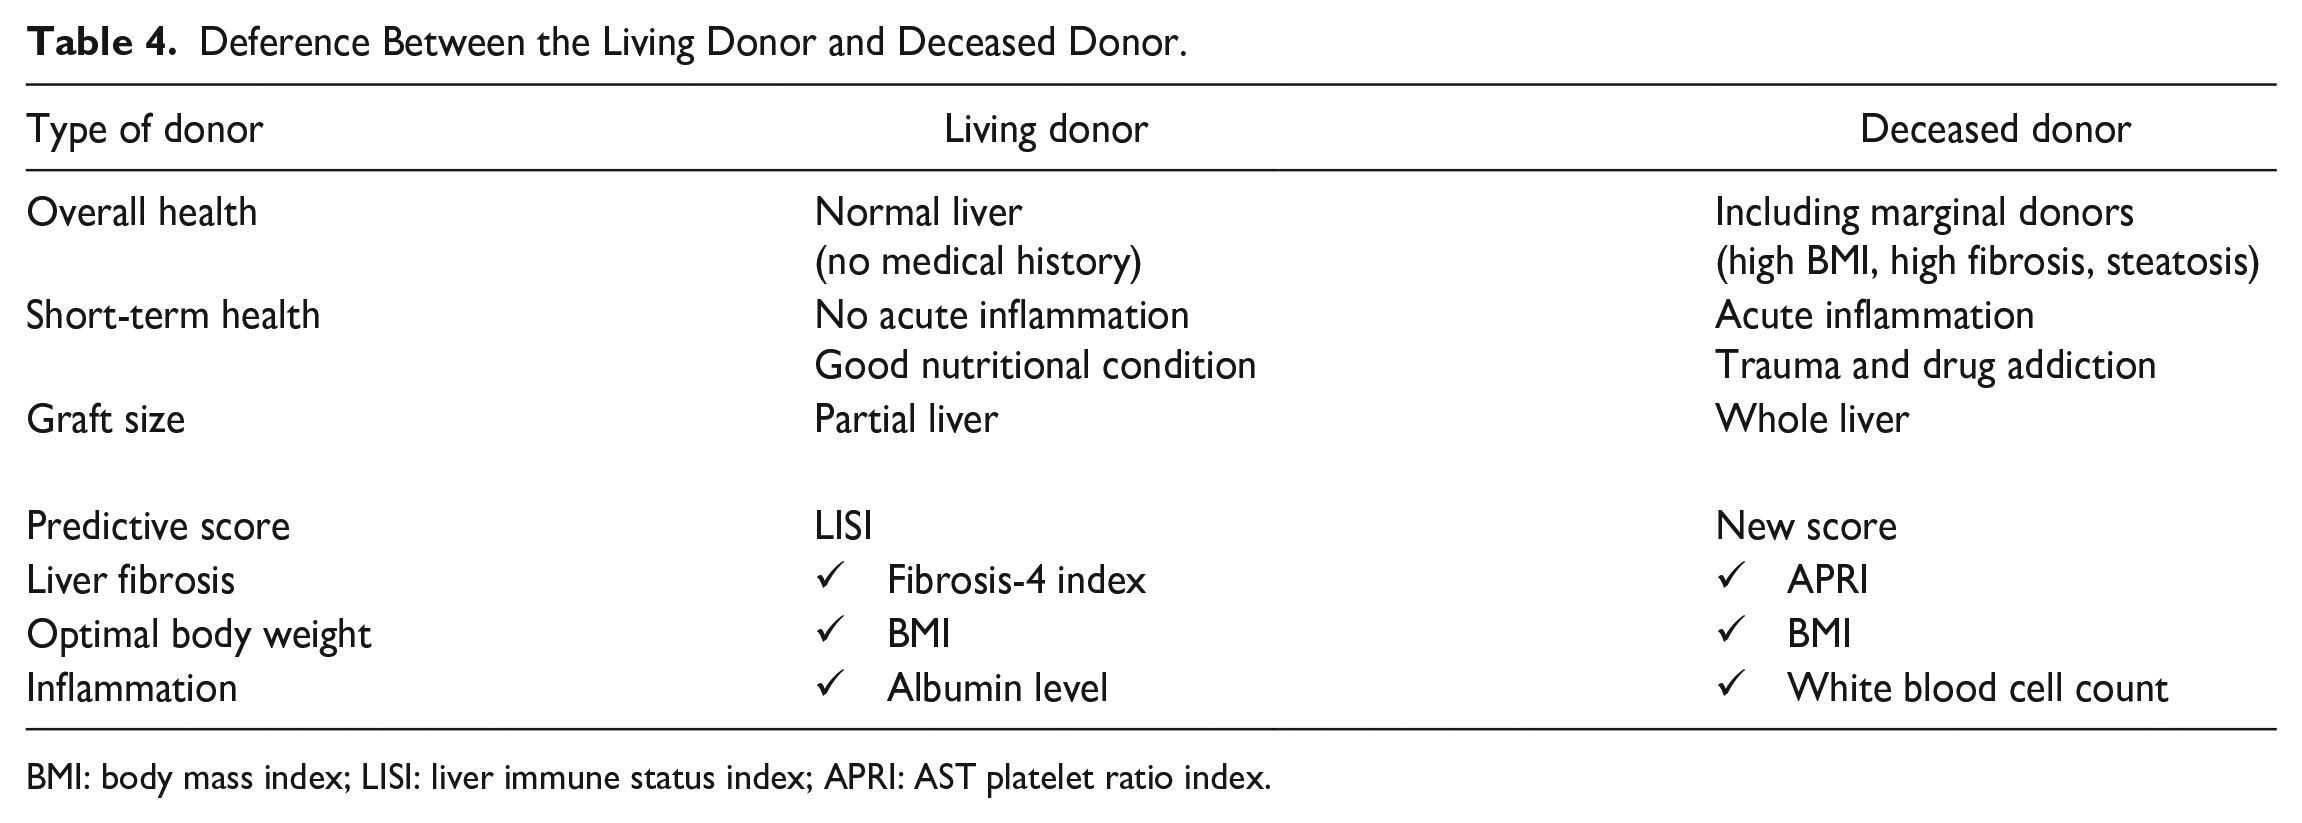
BMI: body mass index; LISI: liver immune status index; APRI: AST platelet ratio index.
The current study has several limitations. First, the study was conducted on a relatively small patient cohort at a single center and interpretation should be cautious, especially since the cluster analysis divides the patients into three groups, with only four cases in cluster 2. Thus, a larger multicenter study is required to test the generalizability of our prediction scores. Second, this study excluded cases involving DCD and machine perfusion. Given the increasing use of machine perfusion and DCD donors, future studies should evaluate liver NK cells in these settings. As illustrated in Supplemental Fig. 2, one mechanical perfusion case exhibited a higher percentage of liver NK cells but remarkably lower levels of activation markers, such as TRAIL, CD69, and NKp44, even after stimulation with IL-2. Thus, future research should include an analysis of liver NK cell activity in both DCD and machine perfusion, in accordance with evolving practices and trends in the field of organ transplantation. Finally, RNA-seq test and proteomics of selected NK cells, such as TRAIL+NK cells and NKG2D+NK cells, are needed to provide a better understanding of the potential antitumor capacity of NK cells.
In conclusion, the predictive score calculated from APRI, BMI, and WBC counts effectively identified high NKG2D and TRAIL expression in DD-derived liver NK cells. The use of a predictive score would allow better identification of DDs with high-quality liver NK cells, and could lead to more efficient isolation of these cells for immunotherapy against HCC.
Supplemental Material
sj-docx-3-cll-10.1177_09636897241283289 – Supplemental material for Evaluating Predictors of Quality in Liver NK Cells Among Deceased Donors
Supplemental material, sj-docx-3-cll-10.1177_09636897241283289 for Evaluating Predictors of Quality in Liver NK Cells Among Deceased Donors by Yuki Imaoka, Masahiro Ohira, Toshihiro Nakayama, Miho Akabane, Tetsuya Tajima, Shinichiro Yokota, Sheri M. Krams, Olivia M. Martinez, Carlos O. Esquivel, Kazunari Sasaki and Hideki Ohdan in Cell Transplantation
Supplemental Material
sj-tif-1-cll-10.1177_09636897241283289 – Supplemental material for Evaluating Predictors of Quality in Liver NK Cells Among Deceased Donors
Supplemental material, sj-tif-1-cll-10.1177_09636897241283289 for Evaluating Predictors of Quality in Liver NK Cells Among Deceased Donors by Yuki Imaoka, Masahiro Ohira, Toshihiro Nakayama, Miho Akabane, Tetsuya Tajima, Shinichiro Yokota, Sheri M. Krams, Olivia M. Martinez, Carlos O. Esquivel, Kazunari Sasaki and Hideki Ohdan in Cell Transplantation
Supplemental Material
sj-tif-2-cll-10.1177_09636897241283289 – Supplemental material for Evaluating Predictors of Quality in Liver NK Cells Among Deceased Donors
Supplemental material, sj-tif-2-cll-10.1177_09636897241283289 for Evaluating Predictors of Quality in Liver NK Cells Among Deceased Donors by Yuki Imaoka, Masahiro Ohira, Toshihiro Nakayama, Miho Akabane, Tetsuya Tajima, Shinichiro Yokota, Sheri M. Krams, Olivia M. Martinez, Carlos O. Esquivel, Kazunari Sasaki and Hideki Ohdan in Cell Transplantation
Footnotes
Author Contributions
YI, MO, and KS conceived of and designed the study. YI acquired the data and performed all the experiments. YI, MO, and KS analyzed and interpreted the data. YI and MO drafted the manuscript. YI, MO, KS, SY, and HO revised the manuscript critically. YI, MO, SY, TN, MA, TT, SY, SMK, OMM, COE, KS, and HO reviewed and approved the final version of this manuscript.
Ethical Approval
This study was approved by our institutional review board.
Statement of Human and Animal Rights
This article does not contain any studies with human or animal subjects.
Statement of Informed Consent
There are no human subjects in this article and informed consent is not applicable.
Declaration of Conflicting Interests
The author(s) declared no potential conflicts of interest with respect to the research, authorship, and/or publication of this article.
Funding
The author(s) disclosed receipt of the following financial support for the research, authorship, and/or publication of this article: AMED supported this work under grant number 24fk0210108.
Supplemental Material
Supplemental material for this article is available online.
References
Supplementary Material
Please find the following supplemental material available below.
For Open Access articles published under a Creative Commons License, all supplemental material carries the same license as the article it is associated with.
For non-Open Access articles published, all supplemental material carries a non-exclusive license, and permission requests for re-use of supplemental material or any part of supplemental material shall be sent directly to the copyright owner as specified in the copyright notice associated with the article.