
Abstract
Bone marrow–derived mesenchymal stromal cells (BMSCs) are attractive candidates in tissue engineering and regenerative medicine. Growing evidence has suggested that a high body mass index (BMI) can affect the properties of BMSCs, resulting in a reduced quality of the cells. However, the results are not consistent. Therefore, this study aimed to investigate the influences of high BMI on human BMSCs (hBMSCs). To avoid gender bias, BMSCs from females and males were studied independently. Finally, hBMSCs from 89 females and 152 males were separately divided into the normal BMI group (18.5 kg/m2 ≤ BMI < 25 kg/m2) and the high BMI group (BMI > 25 kg/m2). The cells were analyzed for the colony-forming potential; proliferation capacity; in vitro adipogenic, osteogenic, and chondrogenic differentiation potentials; and the expression of 32 common surface antigens. The results showed that high BMI did not change the number of colonies at passage 1 in females and males. In contrast, significantly reduced colony numbers at passage 4 (P4) were found in both female and male donors with high BMI. The doubling time of hBMSCs was comparable between the normal and the high BMI groups of females and males. Furthermore, the results of trilineage differentiation did not differ between the different BMI groups of males. In females, the high and the normal BMI groups also showed similar adipogenic and chondrogenic differentiation, while osteogenic differentiation was significantly enhanced in the high-BMI group. Regarding the expression of surface antigens, the expressions of CD200 and SSEA4 on hBMSCs were reduced in the high-BMI group of females and males, respectively. In conclusion, high BMI suppressed the clonogenicity of female and male hBMSCs at P4, improved the in vitro osteogenesis of female hBMSCs, and decreased the expressions of CD200 on hBMSCs in females and SSEA4 in males.
Introduction
Bone regeneration, cartilage repair, and healing of other musculoskeletal tissues are significant challenges in orthopedics and trauma surgery. Although enormous progress has been made in the past few decades, it remains an unsolved clinical problem worldwide. With the deepening of research, mesenchymal stromal cell (MSC)–based therapeutic strategies may become one of the favorable weapons to reverse this situation 1 . Studies on MSCs derived from various tissues for tissue repair and regeneration have been carried out, while bone marrow–derived mesenchymal stromal cells (BMSCs) are still one of the most widely studied and commonly used adult stem cells2–7. BMSCs are mainly characterized by multilineage differentiation, hematopoietic support, self-renewal, rapid proliferation, low immunogenicity, and immunomodulation5,8. These capabilities lead to a variety of possible applications in the field of regenerative medicine. Therefore, musculoskeletal repair with the help of BMSCs represents a promising therapeutic strategy. However, noticeable inter-individual discrepancies of BMSCs in functions were found in daily operations and research, which may impact the efficacy of BMSC-based therapy. Many studies have pointed out that the changes in the characteristics of BMSCs are closely related to several factors, such as the age and gender of study subjects9–11. Moreover, evidence accumulated in recent years indicates that abnormal weight gain is also recognized as a reason for the functional differences of BMSCs12–14.
The body mass index (BMI), also called the Quetelet index, is the most used indicator to measure an individual’s weight status15,16. It is defined as the weight in kilograms divided by the square of the height in meters 17 . Adults, according to BMI, are usually classified as underweight (<18.5 kg/m2), normal (18.5–24.9 kg/m2), overweight (25–29.9 kg/m2), and obese (≥30 kg/m2) 18 . A high BMI usually refers to any BMI above normal weight (BMI ≥25 kg/m2), indicating overweight/obese conditions19–22. There are many factors responsible for overweight and obesity. Excessive fat accumulation primarily arises from an imbalance between energy intake and consumption 23 . In addition, insufficient sleep, excessive mental stress, and genetic background can also lead to overweight and obesity 24 . According to the World Health Organization, the rate of worldwide obesity has nearly tripled since 1975, and more than 1.9 billion adults aged 18 and over were overweight and obese in 201623,25. If the prevalence continuously increases, up to 45% of the global population are predicted to be overweight and 16% obese by 2050 26 . The escalating epidemic of overweight and obesity could potentially position the high BMI population as one of the important sources of BMSCs in the future. Therefore, it is urgent to elucidate the changes in the characteristics of BMSCs under high BMI conditions.
Various properties of BMSCs, such as proliferation, differentiation, clonogenic potential, and surface antigen expression, have been proven to be affected by overweight or obesity in animals and humans12,13,27,28. Notably, these properties are important criteria for the clinical application of BMSCs29–31. However, current research results on these aspects are contradictory. For example, several studies believed that overweight or obesity inhibited the proliferation or clonogenicity of BMSCs13,28,32, while other studies did not find similar evidence in animal or human BMSCs (hBMSCs)14,33–35. In addition, multi-directional differentiation potentials—mainly including adipogenic, osteogenic, and chondrogenic differentiation—and surface antigen expression of BMSCs also exhibit debated results12,13,27,28,34,36–40. These variations are partially attributed to the difference in species, gender, sample sizes, and experimental approaches. Therefore, this study aimed to use a large cohort of hBMSCs analyzed under unified, standardized conditions to elucidate the effects of high BMI on proliferation, colony-forming ability, trilineage differentiation, and antigen expression of BMSCs. Meanwhile, given that gender might bias the results 11 , the analyses were separately performed on females and males. The findings will provide a reliable reference for the clinical application of BMSCs.
Materials and Methods
Source of hBMSCs
hBMSCs were collected from the iliac crest bone marrow of voluntary patients who came to the Department of Trauma Surgery of the Hannover Medical School for elective surgery. They were informed about the project and signed the consent forms. Bone marrow aspiration was carried out under anesthesia as part of the routine surgery, and the isolation of hBMSCs from bone marrow was performed in the laboratory. The study protocol and process of sample donation complied with the Declaration of Helsinki and received approval from the ethics committee of Hannover Medical School (Votum No. 2562).
Selection and Grouping of hBMSC Donors
In this study, the minimum age was set as 20 years old. The donors who suffered from infectious diseases such as human immunodeficiency virus or hepatitis were excluded from this research. General data such as gender, age, height, and weight were recorded. BMI was calculated as follows: BMI = weight (kg)/height (m2). According to the value of BMI18–22, both females and males were divided into two groups: the normal BMI group (18.5 kg/m2 ≤ BMI < 25 kg/m2) and the high BMI group (BMI ≥25 kg/m2).
HBMSCs Isolation, Cultivation, and Passaging
After collection from the donors, the bone marrow was mixed with three times the volume of phosphate-buffered saline (PBS; Sigma Aldrich, Steinheim, Germany). hBMSCs were then separated by centrifugation at 500 × g for 30 min without brake at room temperature (RT) using a synthetic polysaccharide-epichlorohydrin-copolymer (Biocoll®; Biochrom, Berlin, Germany). Subsequently, the mononuclear cell layer was collected and washed with the same volume of PBS. Afterward, the mononuclear cells/PBS mixture was centrifuged at RT for 5 min at 500 × g. The supernatant was removed, and the cell pellet was resuspended in the complete medium consisting of Dulbecco’s Modified Eagle’s Medium FG0415 (DMEM; Bio&Sell, Feucht, Germany), 1% (100 U/ml/100 µg/ml) penicillin/streptomycin (P/S; Bio&Sell), 25 mM 4-(2-hydroxyethyl)-1-piperazineethanesulfonic acid (HEPES; Bio&Sell), 10% fetal calf serum (FCS; Bio&Sell) and 2 ng/ml human recombinant fibroblast growth factor 2 (PeproTech, Hamburg, Germany). Then, the cells were transferred into a cell culture flask and incubated at 37°C and 5% CO2 for expansion [passage 0 (P0)]. After 24 h, the medium was first changed to remove the suspended fraction of mononuclear cells. The cells were observed until at least five cell colonies were formed. The cells were then detached from the bottom of the cell culture flask by trypsin/ethylenediamine tetraacetic acid (Bio&Sell) solution [0.05%/0.02% (v/v)] and counted. The remaining cells were reseeded at a density of 2,000 cells/cm2 in new cell culture flasks. The cells were now at passage 1 (P1). When the cells reached a confluency of 80%–90%, they were again collected and counted. Aliquots of 1 × 10⁶ P1 cells were frozen in cell cryopreservation tubes filled with 1 ml of freezing medium, which contained 95% FBS and 5% dimethyl sulfoxide (Sigma Aldrich) and stored in the Hannover Unified Biobank for further use. The cells were now at passage 2 (P2). To have enough cells available for this study, 1 × 10⁶ hBMSCs at P2 per donor were thawed, cultured, and passaged so that the experiments were carried out with cells at passage 4 (P4).
HBMSCs Proliferation
The proliferation ability of hBMSCs was evaluated by the doubling time using the following formula 11 :

where N0 is the number of cells seeded at P1, Nd is the number of cells harvested at the end of P1, and d is the number of days in cell culture during P1.
Colony Forming Unit–Fibroblast Assay
The self-renewal potential of hBMSCs at P1 and P4 was analyzed using the colony forming unit–fibroblast assay (CFU-F Assay). Briefly, the cells were seeded on 6-well plates (Greiner Bio-one, Frickenhausen, Germany) at four different densities (125, 250, 500, and 1,000 cells per well) in duplicate. The CFU-F Assay was stopped after 10 days of standard incubation at 37°C and 5% CO2. Afterward, the cells were fixed with 100% methanol for 30 min at RT and then washed with distilled water. After staining with 1% crystal violet (Merck, Darmstadt, Germany) for 30 min at RT, the colonies were counted according to the following requirements: (1) consisting of more than 50 cells; (2) more than 1 mm in diameter; and (3) macroscopically visible. Finally, the colonies that met these criteria were counted, and the average number of colonies per 100 seeded cells was calculated.
Flow Cytometry
hBMSCs at P4 were used to detect 32 antigens by flow cytometry (FC). On the one hand, the surface antigens of the minimum standard of the International Society for Cell Therapy (ISCT) criteria 41 were used to identify hBMSCs cultures using CD73, CD90, CD105 as positive makers and CD11b, CD14, CD19, CD34, CD45, human leukocyte antigen (HLA)-DR as negative markers. Currently, isolated hBMSCs, according to ISCT criteria, are reported to be heterogeneous 42 . On the other hand, other surface antigens reported in the literature used for the quality control of hBMSCs or inconsistently described were also tested by FC. They consisted of CD4, CD10, CD11c, CD13, CD15, CD29, CD31, CD44, CD49f, CD54, CD56, CD106, CD117, CD146, CD166, CD200, CD271, CD274, GD2, MSCA1, SSEA4, SSEA5, and STRO1. Detailed information of the antibodies is listed in Supplemental Table 1.
For use in FC, 1 × 10⁶ cells were centrifuged at 500 × g for 5 min at RT, followed by resuspension in 1 ml FC buffer [2% (v/v) FBS in PBS]. Afterward, 100 µl of the cell suspension were moved to each well of a 96-well plate (Greiner Bio-one). The cells were centrifuged at 4°C and 400 × g for 2 min and washed two times with FC buffer. Then, the cells were incubated with the antibodies listed in Supplemental Table 1 for 1 h at 4°C in the dark. Subsequently, the cells were washed twice with FC buffer. Finally, the cells were resuspended with 200 µl FC buffer. The measurements were carried out on the BD FACS Canto (BD Biosciences, Heidelberg, Germany). The BD FACS Diva software (BD Biosciences) and Flowing Software version 2.5.0. (Perttu Terho, Turku, Finland) were used for further data analysis.
In vitro Differentiation Assays
To investigate whether there were differences in adipogenic, chondrogenic, and osteogenic differentiation of hBMSCs between the different BMI groups, hBMSCs at P4 from each donor were used for differentiation into the three directions in vitro.
Adipogenic and Osteogenic Differentiation and Histological Examinations
A total of 150,000 cells per well were seeded in a 6-well plate for adipogenic and osteogenic differentiation. Each well for differentiation had a concomitant control well. After 24 h, the complete medium was changed into a differentiation or control medium, which was defined as day 0 of the differentiation. The composition of the medium for adipogenic differentiation was as follows: DMEM FG0435 (Bio&Sell), 60 µM indomethacin (Sigma Aldrich), 1 µM dexamethasone (Sigma Aldrich), 10 µg/ml insulin (Sigma Aldrich), 500 µM 3-isobutyl-1-methylxanthine (Sigma Aldrich), 20 mM HEPES (Bio&Sell), 20% FBS (Bio&Sell), and 1% P/S (Bio&Sell). The differentiation medium for osteogenesis contained: DMEM FG0415 (Bio&Sell), 50 µM ascorbate-2-phosphate (Sigma Aldrich), 0.1 µM dexamethasone (Sigma Aldrich), 20 mM HEPES (Bio&Sell), 3 mM disodium hydrogen phosphate (Merck), 10% FBS (Bio&Sell), and 1% P/S (Bio&Sell). The corresponding control medium for adipogenesis and osteogenesis contained the following ingredients: DMEM FG0415 (Bio&Sell), 10% FBS (Bio&Sell), 20 mM HEPES (Bio&Sell), and 1% P/S (Bio&Sell). The culture medium was changed every 7 days with a fresh differentiation or control medium. On day 28, the medium was removed, and the cells were washed with PBS and fixed with 4% formalin solution at RT for 30 min. For the histological examinations, Oil Red O [Sigma Aldrich; 5 g/L dissolved in 60% (w/v) isopropanol] was used for 25 min to analyze adipogenesis, while histological staining for the analysis of osteogenesis was performed with Alizarin Red [Carl Roth, Karlsruhe, Germany; 0.5% (w/v) in distilled water; pH = 4.5] in the dark for 10 min. After staining, the cells were washed with distilled water and analyzed. For image analysis, at least three randomly selected areas of each well were photographed at 10 × magnification using a light microscope (CKX41 Microscope; Olympus, Tokyo, Japan). The average of the percentage of the stained area to the total area in three images was used to assess the level of adipogenic and osteogenic differentiation. During the data processing, a self-written application from the laboratory based on the OpenCV library (version 4.1.0; Intel Corporation, Santa Clara, USA) was used11,43. A representative image was utilized to get the percentage by setting the hue and saturation value manually, and then the thresholds of these parameters were automatically applied to the other images.
Chondrogenic Differentiation and Histological Examination
For chondrogenic differentiation, 250,000 cells were centrifuged in a 15-ml tube at RT and 400 × g for 5 min to form a cell pellet. Each pellet for differentiation had a control pellet cultured in a control medium. After 24 h of cell seeding, the complete medium was replaced with the corresponding chondrogenic differentiation or control medium, which was considered as day 0. The pellet was cultivated in the 15-ml tube for 28 days in an incubator (37°C, 5% CO2), and the corresponding medium was changed at 7 days interval. The control medium consisted of DMEM FG0435 (Bio&Sell), 0.1 µM dexamethasone (Sigma Aldrich), 20 mM HEPES (Bio&Sell), 1% P/S (Bio&Sell), 170 µM ascorbate-2-phosphate (Sigma Aldrich), 10 µl/ml insulin-transferrin-selenium (Sigma Aldrich), 350 µM proline (Carl Roth), and 1 mM sodium pyruvate (Bio&Sell). In addition to the above components, the differentiation medium was also supplemented with 10 ng/ml transforming growth factor-beta 3 (Peprotech). On day 28, the pellet was washed with PBS and then fixed with 4% formalin for 30 min at RT. Afterward, the pellet was embedded in TissueTek (Sakura Finetek, Staufen, Germany), which was frozen in liquid nitrogen and stored at −20°C for further processing. For histological staining, the pellets were cut into 5 µm thin slices on a cryotome (CM3050 S Cryostat; Leica, Heidelberger, Germany), and then the slices were transferred to microscope slides (Thermo Fisher Scientific, Waltham, MA USA 02451). The slides were washed with distilled water and dyed with Safranin O [0.1% (w/v) Safranin O in distilled water; Merck] for 15 min at RT. Thereafter, the slices were dried, embedded in Vitro-Clud (R. Langenbrinck GmbH, Emmendingen, Germany) and covered with coverslips. The slides were documented at 4 × magnification using a light microscope (BX41 Microscope; Olympus). For image analysis, the percentage of the stained area to the total area of the cell pellet slice calculated by the same self-written application represented the degree of chondrogenesis.
Data Analysis and Statistics
Statistical analyses were performed using SPSS software (IBM SPSS version 27; IBM Corp, Armonk, New York, USA). Figures were created using GraphPad Prism 9 software (version 9.3.1, GraphPad Company, Boston, MA 02110, USA). Data normal distribution was evaluated using the Kolmogorov–Smirnov and Shapiro–Wilk tests (a P > 0.05 was considered normally distributed). The normally distributed data were presented as mean ± standard deviation, and the two-sample independent t-test was used in the comparison between the different BMI groups. The non-normally distributed data were expressed as median (Mdn) and interquartile range (IQR). Between-group comparisons of them were assessed by the Mann–Whitney U test. A P < 0.05 was considered statistically significant.
Results
Characteristics of Donors
A total of 241 donors (89 females and 152 males) were included in this study. Approximately, 50% (44 cases) of females and 68% (103 cases) of males belonged to the high BMI group. No significant difference in age was detected between the different BMI groups of females and males (Table 1).
Characteristics of the Included Donors.
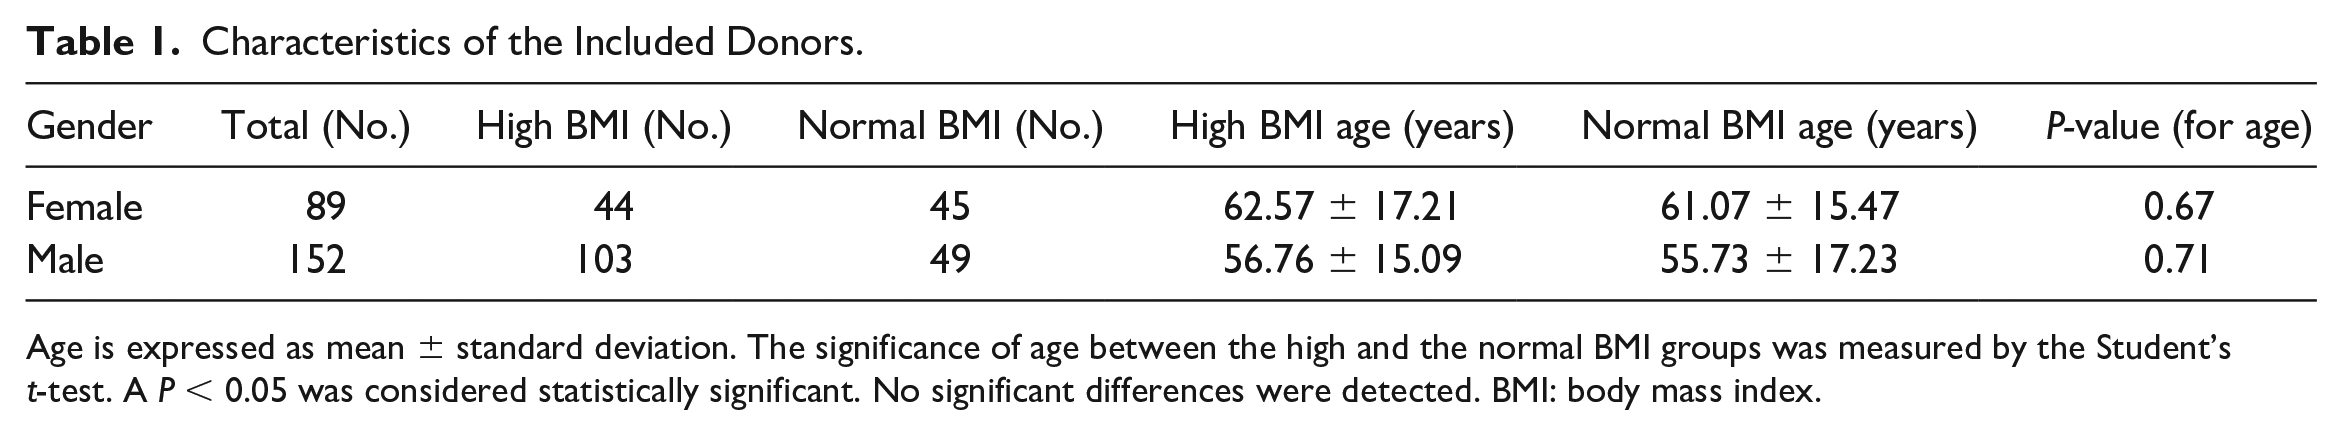
Age is expressed as mean ± standard deviation. The significance of age between the high and the normal BMI groups was measured by the Student’s t-test. A P < 0.05 was considered statistically significant. No significant differences were detected. BMI: body mass index.
Colony Forming Unit–Fibroblast Assay
No significant difference in the number of colonies at P1 (CFU-P1) was detected between the normal and the high BMI groups in both females and males (females: Mdn = 2.53, IQR = 5.37 vs Mdn = 2.64, IQR = 5.20, P = 0.982, Fig. 1A; males: Mdn = 3.95, IQR = 5.62 vs Mdn = 3.47, IQR = 4.81, P = 0.105, Fig. 1B). On the other hand, the number of colonies at P4 (CFU-P4) in the female high BMI group (Mdn = 0.57, IQR = 2.00, Fig. 1C) was significantly reduced compared with the female normal BMI group (Mdn = 2.38, IQR = 2.71, P = 0.003, Fig. 1C). In males, the number of CFU-P4 in the high BMI group (Mdn = 1.65, IQR =2.75, Fig. 1D) was less than that in the normal BMI group (Mdn = 3.12, IQR = 4.79, P = 0.012, Fig. 1D).
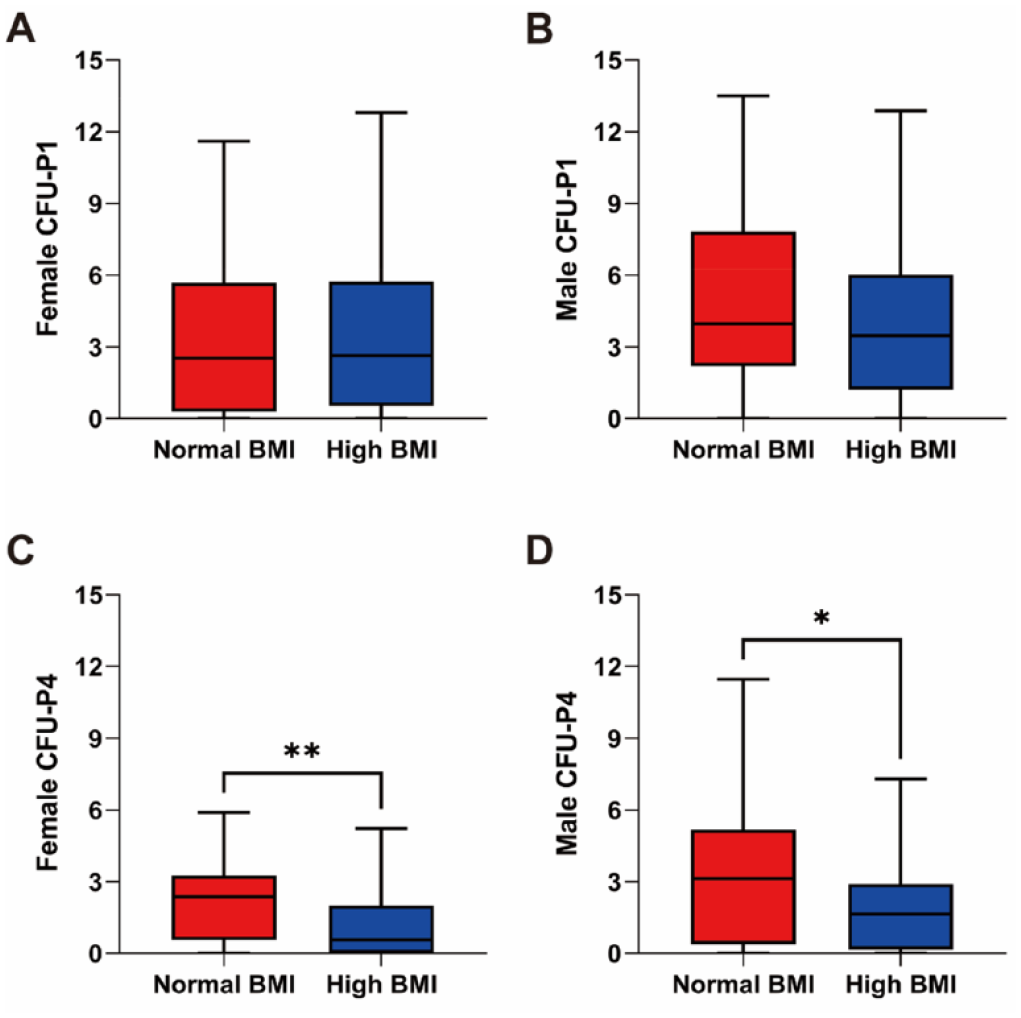
CFU-fibroblast assay at P1 and P4 in relation to donor BMI. (A) The number of CFU-P1 in female donors did not differ between the high and the normal BMI groups (n = 39 for normal BMI and n = 44 for high BMI). (B) The number of CFU-P1 in male donors between high and normal BMI did not change (n = 42 for normal BMI and n = 96 for high BMI). (C) The number of CFU-P4 formed by female hBMSCs was significantly reduced in the high BMI group (n = 44 for normal BMI and n = 43 for high BMI). (D) In males, the number of CFU-P4 in the high BMI group was less than that in the normal BMI group (n = 49 for normal BMI and n = 98 for high BMI). BMI: body mass index; CFU: colony forming unit; hBMSCs: human bone marrow–derived mesenchymal stromal cells; P1: passage 1; P4: passage 4. Statistically significant differences are shown as follows: *P ≤ 0.05; **P ≤ 0.01.
Furthermore, the average colony number from the normal and the high BMI groups of females was 1.63- and 3.07-fold higher at P1 compared to P4, respectively. In males, the mean number of CFU-P1 was 1.46 and 2 times higher than that of CFU-P4 for the normal and the high BMI groups, respectively.
Cell Proliferation
The doubling time at P1 was compared between the two different BMI groups in females and males. For female participants, the doubling time in the high BMI group (Mdn = 1.88 days, IQR = 1.14 days, Fig. 2A) was not significantly different from that in the normal BMI group (Mdn = 1.99 days, IQR = 0.98 days, P = 0.184, Fig. 2A). Similarly, there was no significant difference in the doubling time between the high (Mdn = 1.64 days, IQR = 0.60 days, Fig. 2B) and the normal BMI (Mdn = 1.56 days, IQR = 0.68 days, P = 0.158, Fig. 2B) groups in males.
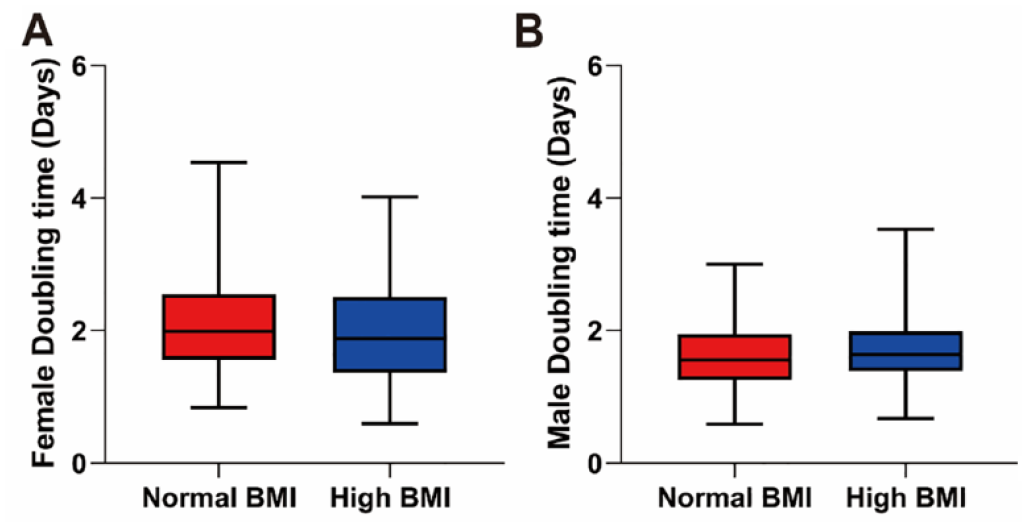
The doubling time in relation to donor BMI. (A) The doubling time in the female high BMI group was not different from that in the female normal BMI group (n = 41 for normal BMI and n = 38 for high BMI). (B) In males, no significant difference in the doubling time was found between the normal and the high BMI groups (n = 45 for normal BMI and n = 95 for high BMI). BMI: body mass index.
Differentiation Potential
The in vitro differentiation experiments showed that hBMSCs at P4 could differentiate into adipocytes, osteoblasts, and chondrocytes (see Fig. 3 for representative images).
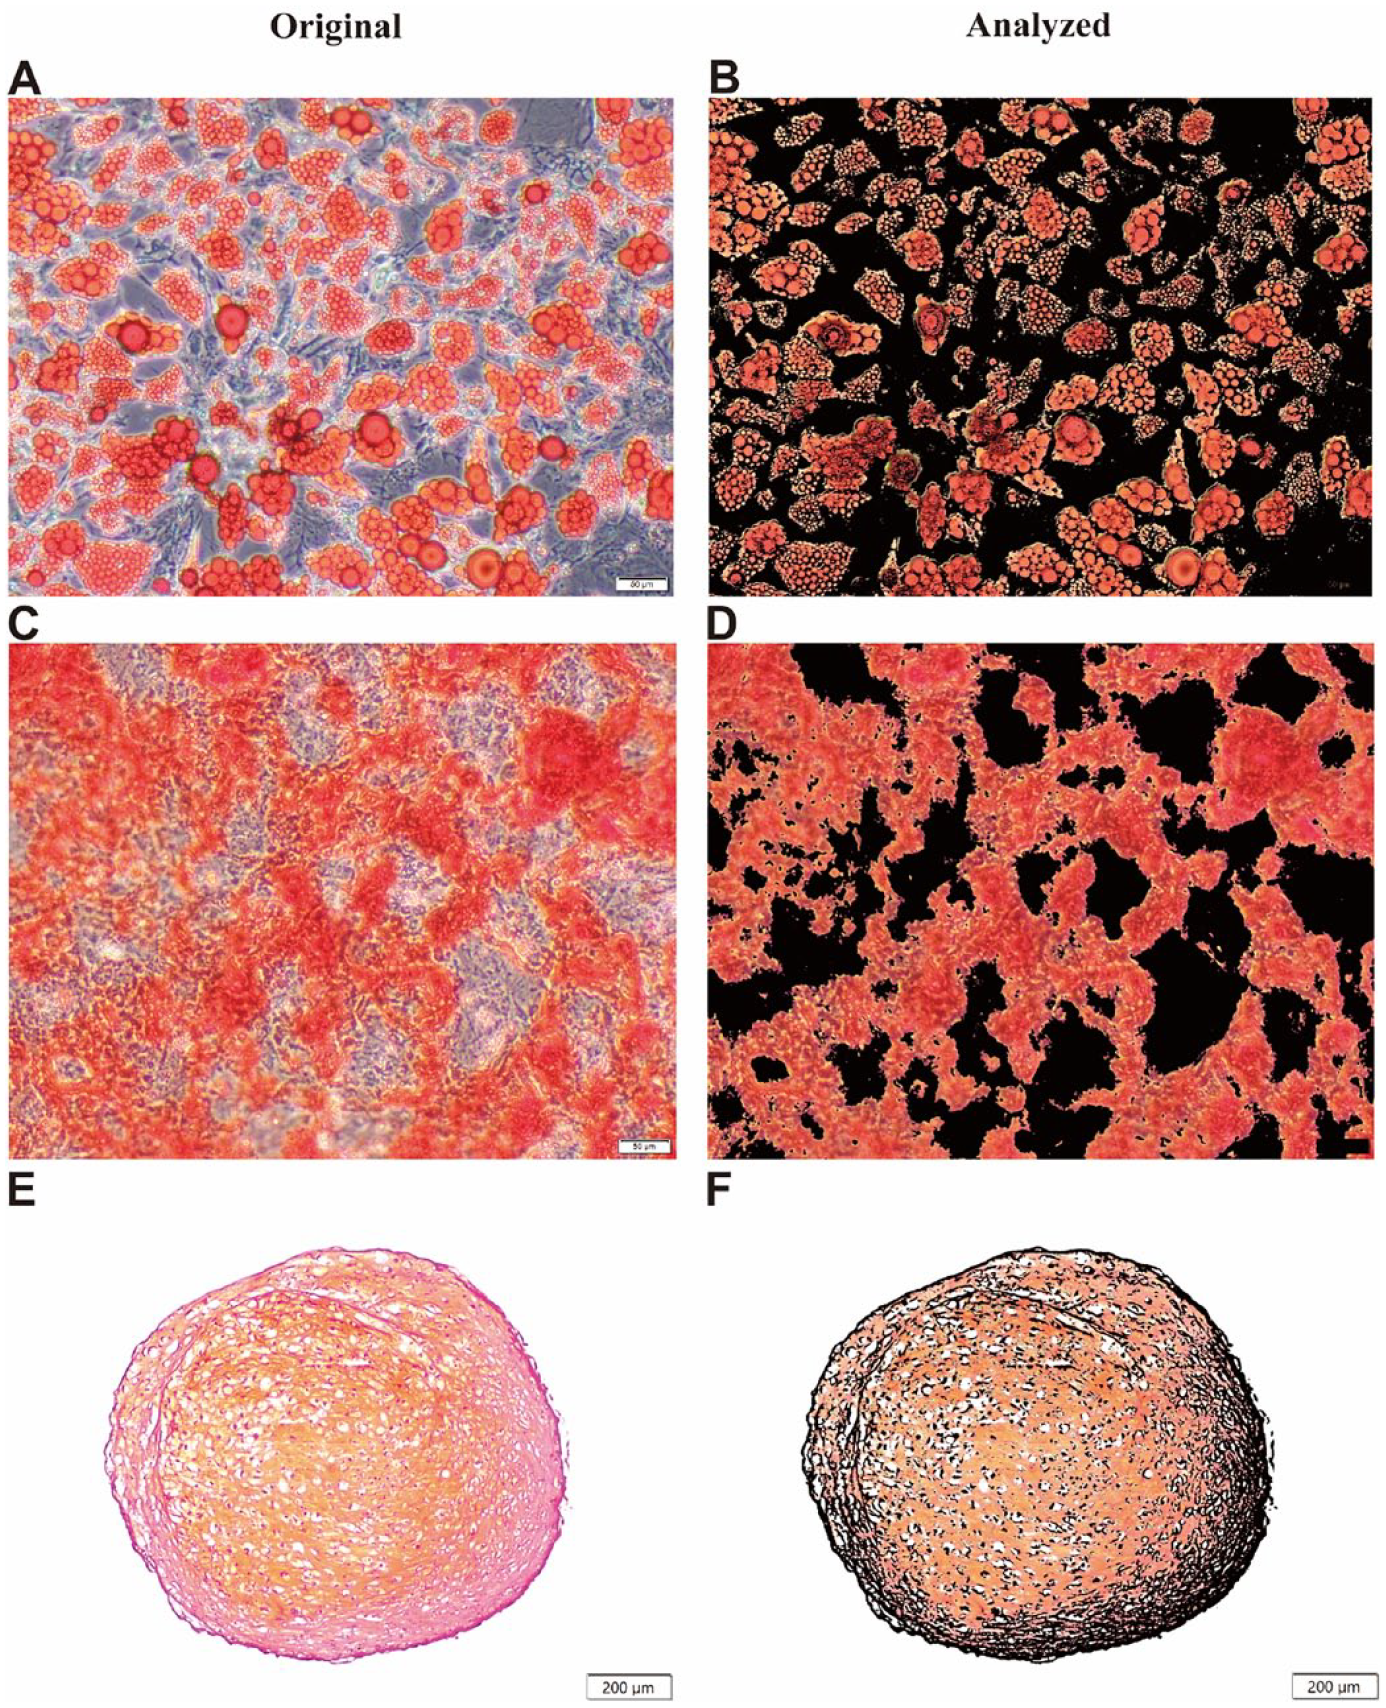
Representative images of in vitro trilineage differentiation of hBMSCs at P4 after 28 days. (A) Adipogenesis of hBMSCs stained by Oil Red O. (B) The corresponding analyzed image of adipogenesis with lipid drops stained in red. (C) Osteogenesis of hBMSCs stained by Alizarin Red. (D) The corresponding analyzed image of osteogenesis with calcium deposits stained in red. (E) Chondrogenesis of hBMSCs stained by Safranin O. (F) The corresponding analyzed image of chondrogenesis with proteoglycan stained in red. Scale bars: (A to D) 50 µm and (E and F) 200 µm. hBMSCs: human bone marrow–derived mesenchymal stromal cells; P4: passage 4.
No obvious alterations were found in the adipogenic potential between the different BMI groups of females and males (females: 34.85% ± 11.68% vs 38.39% ± 14.65%, P = 0.213, Fig. 4A; males: 36.59% ± 11.58% vs 36.38% ± 13.89%, P = 0.927, Fig. 4B). The amount of osteogenesis of female hBMSCs in the high BMI group (Mdn = 75.99%, IQR = 24.79%, Fig. 4C) was higher than that in the normal BMI group (Mdn = 66.11%, IQR = 85.86%, P = 0.026, Fig. 4C), while it did not differ between the different BMI groups of males (Mdn = 67.21%, IQR = 38.77% vs Mdn = 71.23%, IQR = 41.84%, P = 0.967, Fig. 4D). In addition, the chondrogenic capacity was comparable between the normal and the high BMI groups of females and males (females: Mdn = 20.42%, IQR = 31.99% vs Mdn = 15.71%, IQR = 29.54%, P = 0.670, Fig. 4E; males: Mdn = 27.77%, IQR = 33.36% vs Mdn = 20.72%, IQR = 24.16%, P = 0.106, Fig. 4F).
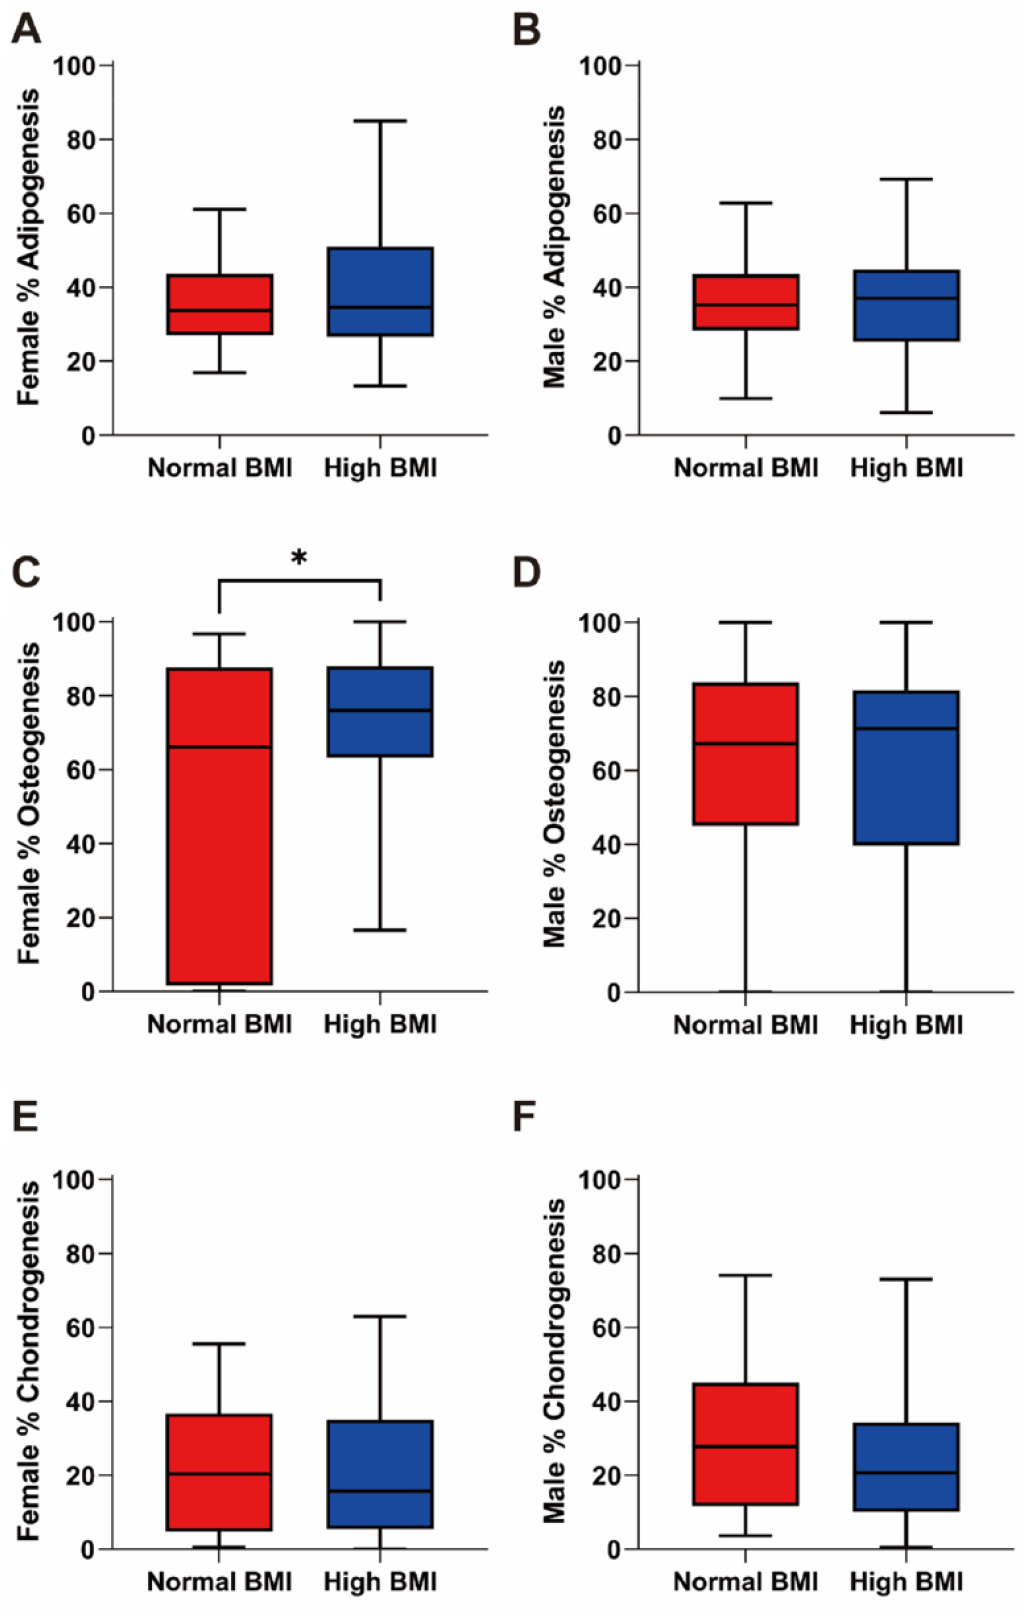
In vitro trilineage differentiation of hBMSCs at P4 after 28 days in relation to donor BMI. (A) The adipogenic potential of hBMSCs in the different BMI groups of females was not significantly different (n = 44 for normal BMI and n = 44 for high BMI). (B) High BMI also did not change the adipogenic potential of hBMSCs in males (n = 48 for normal BMI and n = 101 for high BMI). (C) The osteogenic ability of hBMSCs from the female high BMI group significantly increased compared with the female normal BMI group (n = 44 for normal BMI and n = 40 for high BMI). (D) The comparison of osteogenic differentiation between the normal BMI and the high BMI groups of males showed no difference (n = 49 for normal BMI and n = 102 for high BMI). (E) The amount of chondrogenesis was comparable between the normal and the high BMI groups in females (n = 45 for normal BMI and n = 44 for high BMI). (F) No significant difference was observed in the chondrogenic potential between the different BMI groups of males (n = 49 for normal BMI and n = 97 for high BMI). hBMSCs: human bone marrow–derived mesenchymal stromal cells; BMI: body mass index; P4: passage 4. Statistically significant differences are shown as follows: *P ≤ 0.05.
Surface Antigens
Thirty-two surface antigens of hBMSCs at P4 were tested by FC to analyze the differences between the normal and the high BMI groups for both female and male donors. For female hBMSCs, the expression of CD200 was significantly lower in the high BMI group (Mdn = 10.59%, IQR = 17.02%, Fig. 5A) than that in the normal BMI group (Mdn = 16.32%, IQR = 15.58%, P = 0.035, Fig. 5A). However, it was comparable between the different BMI groups of males (Mdn = 14.76%, IQR = 20.97% vs Mdn = 20.19%, IQR = 23.99%, P = 0.081, Fig. 5B). The expression of SSEA4 on female hBMSCs was not significantly different between the normal and the high BMI group (Mdn = 73.25%, IQR = 29.39% vs Mdn = 75.23%, IQR = 28.75%, P = 0.578, Fig. 5C), while it was significantly reduced in the high BMI group (Mdn = 81.38%, IQR = 24.36%, Fig. 5D) compared with that in the normal BMI group in males (Mdn = 88.40%, IQR = 13.50%, P = 0.010, Fig. 5D).
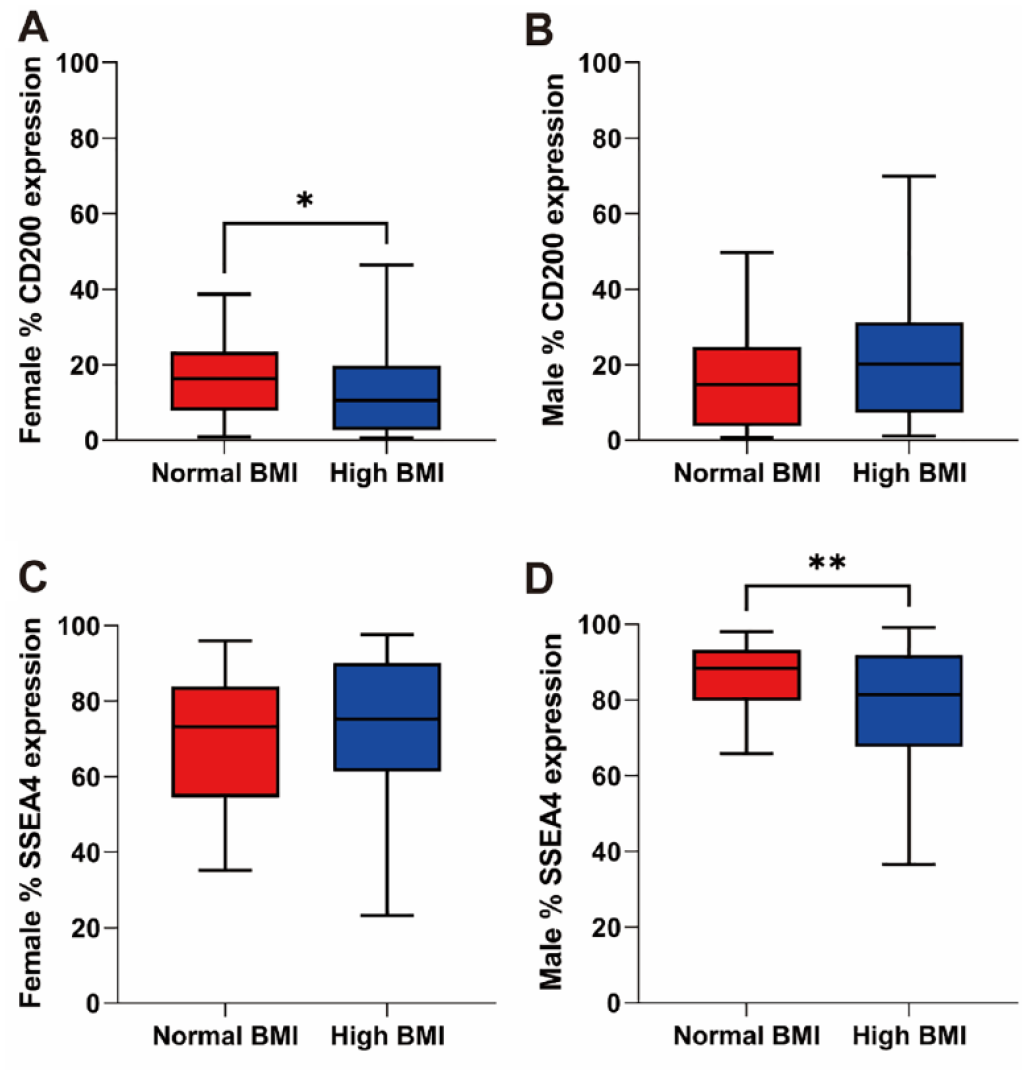
Expression levels of surface antigens in relation to donor BMI. (A) The expression of CD200 on hBMSCs significantly decreased in the female high BMI group (n = 42 for normal BMI and n = 40 for high BMI). (B) There was no difference in the expression of CD200 between the different BMI groups of males (n = 45 for normal BMI and n = 97 for high BMI). (C) The expression of SSEA4 was comparable between the normal and the high BMI groups of females (n = 37 for normal BMI and n = 39 for high BMI). (D) In males, SSEA4 expression of hBMSCs in the high BMI group was significantly downregulated (n = 33 for normal BMI and n = 87 for high BMI). BMI: body mass index; hBMSCs: human bone marrow–derived mesenchymal stromal cells. Statistically significant differences are shown as follows: *P ≤ 0.05; **P ≤ 0.01.
Discussion
The present study aimed to explore the influence of high BMI on the properties of female and male hBMSCs by assessing the colony formation ability, proliferation potential, differentiation capability, and the expression of common surface antigens. Separate analyses by gender and comparable age between the different BMI groups reduced the bias caused by gender and age.
In the present study, we found that the number of CFU-P1 was unaffected by high BMI in males and females, suggesting that high BMI has no significant effect on the clonogenic potential of hBMSCs at very early passage. Several experiments on obese male mice found similar results in the very early passage (P0 or P1) of BMSCs27,33,34. However, on the other hand, there is also one contradictory study that obesity can reduce the colony-forming ability of BMSCs at P0 in male mice 44 . In humans, after comparing obese and overweight males with lean males, Tencerova et al. 12 found dramatically reduced colonies at P0 in obese males compared with lean males. Yet, they did not find a significant difference in the number of colonies at P0 between overweight and lean males 12 . In our study, approximately three fourths of the participants in the male high BMI group were overweight 18 . Therefore, the finding on CFU-P1 might tend to approach the result of the comparison between lean and overweight subjects studied by Tencerova et al. 12 As few studies have explored the relationship between obesity or overweight and the clonogenic ability of female hBMSCs, our study first reported no effect of high BMI on hBMSCs at P1 in females. At P4, we found a significant reduction in the number of colonies in both the female and male high BMI groups, implying that the effects of high BMI on the colony-forming ability of hBMSCs might be passage dependent. Cellular senescence is a primary reason for the reduced colony-forming potential45–47, and multiple studies have reported that significant weight gain can lead to BMSCs senescence12,13,28,44. Therefore, we speculated that hBMSCs from the patients with high BMI might exhibit an accelerated senescence phenotype over passages, resulting in suppressed colony-forming ability at P4. By longitudinally comparing the number of colonies at P1 and P4 of the different BMI groups, we found a decreased clonogenic potential of hBMSCs over passages in both female and male populations. This phenomenon is consistent with other studies and seems to be related to the aging of MSCs during expansion and passage in vitro45–48. Notably, the number of colonies in the high BMI group decreased more than that in the normal BMI group, which might support our speculation and indicate a potential superposed and synergistic effect of passage combined with high BMI on hBMSCs aging.
In terms of proliferation, the results of the doubling time demonstrated a comparable proliferation rate between the normal and the high BMI groups in females. Chen et al. 49 found similar results using the cell counting kit-8 assay to compare BMSCs derived from obese and normal female Balb/c mice. However, our results contrasted with a finding of Bi et al. 28 , who demonstrated that BMSCs of female Sprague Dawley (SD) rats with significantly increased body weight have a longer doubling time along with G1/G0 arrest. This difference might be related to interspecies variations. Furthermore, no significant difference was found in the proliferative potential of hBMSCs from the different BMI groups of male donors. The finding differed from several studies on male humans and animals12,27,32. However, Wu et al. 39 showed that the expansion ability of BMSCs derived from obese and lean male mice is not significantly different. In addition, it has been reported that the expression of CD90 decreases in BMSCs derived from obese mice, and CD90-deficient BMSCs display increased proliferation and growth 33 . Regarding surface antigens, we did not detect a significant change in the expression of CD90 in the high BMI group, which might be a reason for our results. Di Bernardo et al. 14 observed a comparable proliferation rate in male hBMSCs incubated with serum from overweight (BMI >25 kg/m2) and healthy (BMI <25 kg/m2) adults, which might also support our current results.
In in vitro differentiation, we found that osteogenic and adipogenic differentiation of male hBMSCs under high BMI conditions remained unchanged, consistent with several experiments on obese male mice27,50. However, most male animal studies demonstrated enhanced or suppressed osteogenic or adipogenic properties of BMSCs induced by obesity32,34,36–40,51. In humans, Tencerova et al. 12 observed increased in vitro osteogenesis and adipogenesis of obese male hBMSCs but not for overweight male cells. Our result might agree with the results of the overweight subjects in their study as there is a high percentage of overweight donors in the male high BMI group of our study. Obesity has been reported to influence the differentiation of BMSCs through inflammatory effects 51 or metabolic state 12 . Thus, we speculated that the inflammatory state or cellular metabolism might be milder in overweight than in obesity, which would explain why the osteogenic and adipogenic abilities of hBMSCs are not severely changed. In female donors, high BMI increased the osteogenic differentiation ability of hBMSCs, similar to a recent study on obese female Balb/c mice 49 . The enhanced osteogenic ability is associated with the activation of the Wnt/β-catenin pathway 49 . Yet another study by Bi et al. 28 showed that BMSCs of female SD rats with excess weight exhibit suppressed osteogenic ability. However, our results might support some clinical findings that high BMI (obesity or overweight) is associated with high bone mineral density in both premenopausal and postmenopausal females 52 . Moreover, most female donors in the different BMI groups in our study were above the average age of menopause 53 . In postmenopausal females, extragonadal estrogen synthesis in adipose tissue is the major source of estrogens since the function of the ovary secreting estrogen is ceased during menopause 54 . The increased estrogen caused by high fat mass might be one of the reasons for the enhanced osteogenic ability since estrogen can promote the osteogenesis of hBMSCs 55 . Therefore, it seems reasonable that hBMSCs from females with high BMI exhibit increased osteogenic potential. However, we did not find a significant difference in adipogenesis between the different BMI groups, inconsistent with the phenotype of decreased adipogenic differentiation of female SD rats with significantly increased weight 28 . Due to the difference in species and limited studies on female humans and animals, the exact mechanisms underlying this discrepancy are difficult to interpret. In terms of the chondrogenic potential, no significant change was found in the high BMI group regardless of females and males. Similar studies have not been reported in humans, and only a few contradictory results are available from male animal experiments27,39. Alessio et al. 27 found undisturbed in vitro chondrogenic differentiation of BMSCs derived from obese male mice, consistent with our results. In contrast to that, Wu et al. 39 reported obesity-induced impaired in vitro chondrogenesis of male mouse–derived BMSCs. Moreover, downregulated CD105 was thought to contribute to the attenuated chondrogenic phenotype 39 . In our study, however, the expression of CD105 was similar between the different BMI groups of females and males, which might explain the unaltered chondrogenic differentiation we found here.
For antigens’ expression, we found that the expressions of CD200 and SSEA4 were significantly decreased in the high BMI group of females and males, respectively. CD200, also known as OX-2, is a highly glycosylated type-1 transmembrane protein expressed on the surface of cells from various tissues 56 . It was proposed as a potential marker of hBMSCs due to its high ability to enrich CFU-Fs 57 . Compared with mock-transfected BMSCs, CD200-transfected BMSCs have higher stemness as supported by more colonies and upregulation of Nanog homeobox and octamer-binding protein 4 58 . Thus, reduced CD200 in the female high BMI group might be associated with the impaired stemness of BMSCs, supported by the decreased number of CFU-P4 of female BMSCs in our research. In another study from our team, we did not find a significant effect of gender on the expression of CD200 11 . Therefore, the gender-specific difference of CD200 under high BMI conditions needs to be thoroughly investigated, which might provide a novel direction for improving bone quality in females. In addition, highly expressed CD200 has already been associated with increased chondrogenic and osteogenic differentiation58–60. However, CD200low BMSCs subpopulations have a higher adipogenic potential 59 . Herein, we did not find significant changes in adipogenic and chondrogenic differentiation but found enhanced osteogenic differentiation in the female high BMI group, which might be based on the co-regulation of multiple genes, not just because of decreased CD200 expression.
SSEA4, an early embryonic glycolipid antigen, is often used as a surface marker of embryonic stem cells (ESCs)61,62. In the bone marrow, SSEA4 can be used as a new marker in the prospective isolation of true MSCs 61 . In addition, SSEA4 (+) BMSCs maintain multilineage differentiation as well as an ability to enrich CFU-Fs61,63. SSEA4 (+) BMSCs cultured in knockout ESC/induced pluripotent stem cell medium have higher stemness 64 . Altogether, these results indicate that SSEA4 plays a vital role in maintaining BMSC stemness. Therefore, downregulation of SSEA4 might imply that high BMI also reduces the stemness of male hBMSCs, which is consistent with the reduction of CFU-P4 in the male high BMI group. Moreover, the expression of SSEA4 is found to be decreased in the elderly male hBMSCs 9 . A small SSEA4 (+) subpopulation from the elderly male hBMSCs exhibits a “youthful” phenotype, which is similar to that of young MSCs in proliferation and differentiation 9 . This finding also suggests that hBMSCs under high BMI conditions exhibit aging phenotypes, which reduces the clonogenic potential of the cells. Interestingly, several previous studies have suggested that SSEA4 is not detected in primary BMSCs65–68. However, we found that SSEA4 was expressed on adult BMSCs. This discrepancy might be related to the difference in cell culture, staining, or analysis protocols.
Except for the two surface antigens discussed above, high BMI had no significant effect on the expression of other antigens in males and females. Our findings on antigens such as CD44, CD90, CD105, and CD146 have been confirmed in overweight and obese patient–derived hBMSCs 12 . However, there are also some different reports in previous studies. For example, Ulum et al. 13 reported the downregulated expressions of CD73, CD90, CD105, CD29, CD44, and CD166, but the upregulated CD31 on hBMSCs derived from donors with high BMI (BMI >30 kg/m2). The reason for these conflicting results is unclear but might be mainly due to the different sample size. Overall, the differentially expressed antigens (ie, CD200 and SSEA4) of hBMSCs exhibited a gender-specific association. In contrast, the other surface antigens were normally expressed on hBMSCs of females and males with high BMI.
In this study, we investigated the effects of high BMI on the properties of hBMSCs based on large sample size. However, our study also has some limitations. For example, the high BMI group included overweight and obese donors. According to previous studies, the influence of overweight and obesity on BMSCs differs in certain aspects. Therefore, it would be interesting to study overweight and obese people separately in the future to identify their possible differential effects. In addition, the use of BMI has its limitations. For instance, it cannot distinguish fat mass and lean mass. However, BMI is currently the most used parameter in the literature to define adiposity. Moreover, most participants in this study were the elderly, and few athletes and fitness enthusiasts with high muscle mass were enrolled. Therefore, we can determine that high BMI in this study is associated with high fat mass instead of high lean mass. Yet, evaluating overweight and obesity by combining multiple indicators in more profound research remains necessary. On the other hand, our current experiments mainly relied on in vitro studies, which cannot fully simulate the complex internal environment of the body. Thus, its role in exploring the pathogenesis of certain diseases at the stem cell level is still limited. However, for the clinical application of autologous or allogeneic hBMSCs, the alteration in the functions of hBMSCs under in vitro culture conditions might be of more reference value since the number of BMSCs is small in the body, and these cells need to be cultured and expanded in vitro before application. Finally, we specifically did not examine the differentiation-related RNA expression in this study, as the protein level (proven by histology) is always of crucial importance.
Conclusions
In conclusion, we demonstrated that high BMI did not affect the proliferative capacity of hBMSCs at P1 of females and males but reduced their colony-forming potential at P4. Furthermore, high BMI enhanced the osteogenic potential of female hBMSCs and decreased the expressions of CD200 and SSEA4 on hBMSCs of females and males, respectively.
Supplemental Material
sj-docx-1-cll-10.1177_09636897241226546 – Supplemental material for Effect of High BMI on Human Bone Marrow–Derived Mesenchymal Stromal Cells
Supplemental material, sj-docx-1-cll-10.1177_09636897241226546 for Effect of High BMI on Human Bone Marrow–Derived Mesenchymal Stromal Cells by Qiang Zong, Katrin Bundkirchen, Claudia Neunaber and Sandra Noack in Cell Transplantation
Footnotes
Acknowledgements
The authors would like to thank the donors and surgeons of the Trauma Department at Hannover Medical School for providing bone marrow samples and also thank Claudia Pütz and Melanie Weiß for their valuable assistance. The Institute of Functional and Applied Anatomy at Hannover Medical School generously made it possible for them to use their flow cytometer for this study.
Author Contributions
Conceptualization: Claudia Neunaber and Sandra Noack; methodology: Sandra Noack; software: Qiang Zong and Sandra Noack; validation: Qiang Zong and Sandra Noack; formal analysis: Qiang Zong, Claudia Neunaber, and Sandra Noack; investigation: Qiang Zong and Sandra Noack; resources: Claudia Neunaber and Sandra Noack; data curation: Qiang Zong and Sandra Noack; writing—original draft preparation: Qiang Zong and Sandra Noack; writing—review and editing: Qiang Zong, Katrin Bundkirchen, Claudia Neunaber, and Sandra Noack; visualization: Qiang Zong, Claudia Neunaber, and Sandra Noack; supervision: Katrin Bundkirchen, Claudia Neunaber, and Sandra Noack; project administration: Claudia Neunaber and Sandra Noack; funding acquisition: Claudia Neunaber and Sandra Noack. All authors have read and agreed to the published version of the manuscript.
Data Availability
The data used to support the findings of this study are available from the corresponding author upon request.
Ethical Approval
The study was conducted in accordance with the Declaration of Helsinki and approved by the Ethics Committee of Hannover Medical School (Votum No. 2562).
Statement of Human and Animal Rights
This article does not contain any studies with human or animal subjects.
Statement of Informed Consent
Informed consent was obtained from all subjects involved in the study.
Declaration of Conflicting Interests
The author(s) declared no potential conflicts of interest with respect to the research, authorship, and/or publication of this article.
Funding
The author(s) disclosed receipt of the following financial support for the research, authorship, and/or publication of this article: This research was funded by Hannover Medical School and Else Kröner-Fresenius-Stiftung (Grant No. 2016-A188). The APC was funded by Hannover Medical School.
Supplemental Material
Supplemental material for this article is available online.
References
Supplementary Material
Please find the following supplemental material available below.
For Open Access articles published under a Creative Commons License, all supplemental material carries the same license as the article it is associated with.
For non-Open Access articles published, all supplemental material carries a non-exclusive license, and permission requests for re-use of supplemental material or any part of supplemental material shall be sent directly to the copyright owner as specified in the copyright notice associated with the article.