
Abstract
This study tested whether human umbilical cord–derived mesenchymal stem cells (HUCDMSCs) treatment effectively protected the rat lung against acute respiratory distress syndrome (ARDS) injury, and benefits of early and dose-dependent treatment. Rat pulmonary epithelial cell line L2 (PECL2) were categorized into G1 (PECL2), G2 (PECL2 + healthy rat lung-derived extraction/50 mg/ml co-cultured for 24 h), G3 (PECL2 + ARDS rat lung-derived extraction/50 mg/ml co-cultured for 24 h), and G4 (condition as G3 + HUCDMSCs/1 × 105/co-cultured for 24 h). The result showed that the protein expressions of inflammatory (HMGB-1/TLR-2/TLR-4/MAL/TRAM/MyD88/TRIF/TRAF6/IkB/NF-κB/IL-1β/TNF-α), oxidative-stress/mitochondrial-damaged (NOX-1/NOX-2/ASK1/p-MKK4/p-MKK7/JNKs/JUN/cytosolic-cytochrome-C/cyclophilin-D/DRP1), and cell-apoptotic/fibrotic (cleaved-caspase 3/cleaved-PARP/TGF-β/p-Smad3) biomarkers were significantly increased in G3 than in G1/G2 and were significantly reversed in G4 (all P < 0.001), but they were similar between G1/G2. Adult male rats (n = 42) were equally categorized into group 1 (normal control), group 2 (ARDS only), group 3 [ARDS + HUCDMSCs/1.2 × 106 cells intravenous administration at 3 h after 48 h ARDS induction (i.e., early treatment)], group 4 [ARDS + HUCDMSCs/1.2 × 106 cells intravenous administration at 24 h after 48 h ARDS induction (late treatment)], and group 5 [ARDS + HUCDMSCs/1.2 × 106 cells intravenous administration at 3 h/24 h after-48 h ARDS induction (dose-dependent treatment)]. By day 5 after ARDS induction, the SaO2%/immune regulatory T cells were highest in group 1, lowest in group 2, significantly lower in group 4 than in groups 3/5, and significantly lower in group 3 than in group 5, whereas the circulatory/bronchioalveolar lavage fluid inflammatory cells (CD11b-c+/LyG6+/MPO+)/circulatory immune cells (CD3-C4+/CD3-CD8+)/lung-leakage-albumin level/lung injury score/lung protein expressions of inflammatory (HMGB-1/TLR-2/TLR-4/MAL/TRAM/MyD88/TRIF/TRAF6/IκB-β/p-NF-κB/IL-1β/TNF-α)/fibrotic (p-SMad3/TGF-β), apoptosis (mitochondrial-Bax/cleaved-caspase-3)/oxidative-cell-stress (NOX-1/NOX-2/ASK1/p-MKK4/p-MKK7/p-JNKs/p-cJUN)/mitochondrial damaged (cyclophilin-D/DRP1/cytosolic-cytochrome-C) biomarkers displayed an opposite pattern of SaO2% among the groups (all P < 0.0001). Early administration was superior to and two-dose counterpart was even more superior to late HUCDMSCs treatment for protecting the lung against ARDS injury.
Keywords
Introduction
Acute respiratory distress syndrome (ARDS) ranks the top one of total number of deaths in acute respiratory failure worldwide1–6, especially in those of moderate to severe ARDS, with an estimated in-hospital death up to 25% to 77%1–10, particularly in those of the elderly ARDS who always have the poorest prognostic outcomes 7 . Of distinctive importance is that for those moderate-severe patients, even utilization of currently therapeutic standard method, such as extracorporeal membrane oxygenation, the in-hospital motility rate remains unacceptably high8,10–13, suggesting that standard conventional therapy for ARDS is an unmet need12,14. Accordingly, to find a new modality with safety and efficacy for those of moderate-severe ARDS patients is urgent and utmost important.
Abundant data have demonstrated that the causal etiologies of ARDS are various and multifactorial, such as sepsis syndrome, viral infection (e.g., COVID-19), any causal etiologies of hemodynamic shock, traumatic organ damage, aspiration lung injury, severe pneumonia, blood transfusion–related pulmonary edema, and miscellaneous factors15–20. These different disease entities always cause lung parenchymal damage, resulting in increasing lung capillary permeability and subsequently damaging the vascular endothelial cells and alveolar epithelium, finally leading to diffuse alveolar and lung parenchyma edema and severe hypoxia 19 . Additionally, ARDS commonly induces a series of inflammatory reaction, neutrophil infiltration, proinflammatory cytokine releases, and generation of reactive oxygen species (ROS)/oxidative stress, immune cell dysregulation, and rigorous immune reaction as well as coagulation disorder and microcirculatory dysfunction21–26. Moreover, overwhelming immune reaction will, in turn, often attack multiple organs27–30, and ultimately patients frequently succumb to multiple organ failures and death31–33. Even the patients could survive from ARDS, they are usually unable to escape from permanent sequelae of destructive lung parenchymal disease, severe lung and neuro-muscular functional impairments, as well as severe cognitive impairment34–36.
Plentiful data have revealed that mesenchymal stem cells (MSCs) have multiple functional capacities such as anti-inflammation, immunomodulation and tissue/organ regeneration, exosome/paracrine production, and angiogenesis37–41. Our recent experimental study has further identified that MSCs have strong capacity of immune modulation, resulting in effectively suppressing the post-heart transplant rejection 42 . More recently, our phase I clinical trial 33 demonstrated that a single-dose IV infusion of human umbilical cord–derived mesenchymal stem cells (HUCDMSCs) was safe with favorable outcomes in moderate-severe ARDS patients. The attractive result from our study 33 encourages us to carry on a double-blinded, randomized placebo-controlled phase II clinical trial with two doses of HUCDMSCs therapy for moderate-severe ARDS patients. This phase II clinical trial has been authorized by Taiwan Food and Drug Administration (i.e., TFDA) (number: 202000098A0) and will be performed soon. However, the TFDA has also strongly recommended us to perform a rodent ARDS model (i.e., preclinical study) to mimic the clinical setting of human ARDS treated with HUCDMSCs for elucidating the safety and efficacy of this treatment. Here, we reported the results of our animal model (i.e., preclinical study) for supporting rationale of therapeutic dosing in our ARDS study.
Materials and Methods
Ethics
All procedures and protocols were approved by the Institute of Animal Care and Use Committee at Kaohsiung Chang Gung Memorial Hospital (Affidavit of Approval of Animal Use Protocol No. 2020121609) and performed in accordance with the Guide for the Care and Use of Laboratory Animals. Animals were housed in an Association for Assessment and Accreditation of Laboratory Animal Care International (AAALAC; Frederick, MD, USA)-approved animal facility in our hospital with controlled temperature and light cycles (24°C and 12/12 light cycle).
Creating ARDS Animal Model and Animal Grouping
Pathogen-free, adult-male Sprague-Dawley (SD) rats (n = 42) weighing 300–325 g (Charles River Technology, BioLASCO Taiwan Co. Ltd., Taiwan) were used for the present study. The procedure and protocol have been described in detail in our previous report 43 , wherein pure oxygen (i.e., 100% O2) was continuously administered to the rat for 48 h. The results 43 demonstrated that the animals usually had an arterial oxygen saturation (SaO2) <89% and severe pulmonary parenchymal damage through pathological findings. Accordingly, the inhalation of 100% O2 for 48 h was utilized in the present study to create the ARDS animal model.
In detail, a closed system of square glass box (i.e., for monitoring the safety of each animal) was created. Inside the closed system, adequate food and water were provided for the animals. At least five animals were accommodated each time in the glass box. Oxygen cannulation was firmly connected to the glass box with an oxygen meter to make sure each animal in the box achieves 100% oxygen exposure for 48 h.
Animals (n = 42) were acquired and categorized into group 1 [normal control (NC), n = 8], group 2 [ARDS + saline (3.0 cc) intra-peritoneal injection at 3 h after 48 h ARDS induction), n = 10], group 3 [ARDS + HUCDMSCs (1.2 × 10⁶ cells) intravenous administration at 3 h after 48 h ARDS induction (i.e., defined as early treatment), n = 8], group 4 [ARDS + HUCDMSCs (1.2 × 10⁶ cells) intravenous administration at 24 h after 48 h ARDS induction (i.e., defined as late treatment), n = 8], and group 5 [ARDS + HUCDMSCs (1.2 × 10⁶ cells) intravenous administration at 3 h and 24 h, respectively, after 48 h ARDS induction (defined as two doses of cell therapy), n = 8].
Flow Cytometric Quantification of Immune and Inflammatory Cells in Circulation and Bronchioalveolar Lavage (BAL) of ARDS Rodent
The flow cytometric procedure for identification and quantification of circulating inflammatory and immune cells was based on our previous report 38 . At baseline and days 3 and 5, peripheral blood mononuclear cells (PBMCs) were obtained and triple-stained with FITC-anti-CD3, PE-anti-CD8a, and PE-Cy™5 anti-CD4. According to the manufacturer’s protocol for the Foxp3 Fix/Perm buffer set, PBMCs were triple-stained with Alexa FluorR 488-anti-CD25, PEanti-Foxp3, and PE-y™5 anti-CD4 for identifying CD4+CD25+Foxp3+ regulatory T cells (Tregs). All sub-populations were analyzed using flow cytometry (FC500, Beckman Coulter, Brea, CA, USA). Additionally, the number of inflammatory cells in circulation [i.e., CD11b/c+, LyG6+ and myeloperoxidase (MPO)+ cells] and in BAL fluid (CD11b/c+, LyG6+ cells) was also assessed using the flow cytometric method.
Histological Assessment of Lung Injury
The procedure and protocol of histological evaluation of lung injury have been described in our previous reports 43 . In detail, the lung specimens were sectioned at 5 µm for light microscopy. H&E staining was performed to estimate the number of alveolar sacs in a blinded fashion. Three lung sections from each rat were analyzed and three randomly selected high-power fields (HPFs; 100×) were examined in each section. The mean number per HPF for each animal was determined by summation of all numbers divided by 9. The extent of crowded area, which was defined as region of thickened septa in lung parenchyma associated with partial or complete collapse of alveoli on H&E-stained sections, was also performed in a blinded fashion. The following scoring system (15) was adopted: 0 = no detectable crowded area; 1= <15% of crowded area; 2 = 15%–25% of crowded area; 3 = 26%–50% of crowded area; 4 = 51%–75% of crowded area; 5 = >75%–100% of crowded area/HPF.
Preparation of Lung Tissue Extraction for Co-Culturing With Rat Lung Epithelial Cells
The procedure and protocol were based on our previous report 44 . Lung tissue of ARDS rats (100 mg) was extracted by 48 h after acute lung injury induction and then homogenized in 1.0 ml of PBS containing protease inhibitor (539134, Millipore). The solution was then mixed by vortex. The crude extract was made into pellets after centrifugation (1380 rcf. for 5 min at 4°C), and the supernatants were stored at −80°C in a refrigerator for individual experiments. The protein assay dye (Bio-Rad, Hercules, California, USA) was used to quantify the concentration of brain extraction. For the purpose of comparison, the healthy rat lung tissue was also extracted and co-cultured with the rat lung epithelial cells.
Procedure and Protocol for Cells Co-Cultured With Lung Tissue Extraction
Adult rat of pulmonary epithelial cell line L2 (PECL2) was purchased from the Food Industry Research and Development Institute (Hsinchu 300, Taiwan, ROC). The cells were cultured in DMEM (Gibco/BRL, Grand Island, NY, USA) containing 10% fetal bovine serum (Hyclone, New Zealand) and 1% Pen Strep (Gibco, USA). These cells were treated by ARDS lung tissue extraction (i.e., by 48 h after acute ARDS induction) and by normal rat lung tissue extraction at a concentration of 1.0 μg/ml for 24 h in the bottom of Transwell, whereas the HUCDMSCs were incubated in the upper compartment of the Transwell, respectively. The total cell lysates were harvested for individual western blot study.
Cell Grouping for In Vitro Study
To evaluate the impact of lung extraction derived from either ARDS or healthy rats on the inflammatory reaction, PECL2 were co-cultured with these lung extractions, and the PECL2 were categorized into: G1 (PECL2 only), G2 [PECL2 + normal rat lung-derived extraction (50 mg/ml) co-cultured for 24 h], G3 [PECL2 + ARDS rat lung-derived extraction (50 mg/ml) co-cultured for 24 h], and G4 [PECL2 + ARDS rat lung-derived extraction (50 mg/ml) + HUCDMSCs (1 × 10⁵ cells) co-cultured for 24 h], respectively.
Western Blot Analysis
Western blot analysis has been described in our previous studies37,38,40–42. In detail, equal amounts (50 µg) of protein extracts were loaded and separated by SDS-PAGE. Separated proteins were transferred to PVDF membranes, and nonspecific sites were blocked by incubation in a blocking buffer [5% nonfat dry milk in T-TBS (TBS containing 0.05% Tween 20)] overnight. The membranes were incubated with the indicated primary antibodies [tumor necrosis factor (TNF)-α (1:1000, Cell Signaling), interleukin (IL)-1β (1:1000, Cell Signaling), NADPH oxidase (NOX)-1 (1:1500, Sigma), NOX-2 (1:500, Sigma), mitochondrial Bax (1:1000, Abcam), cleaved poly (ADP-ribose) polymerase (PARP) (1:1000, Cell Signaling), caspase 3 (1:1000, Cell Signaling), phosphorylated (p)-Smad3 (1:1000, Cell Signaling), transforming growth factor (TGF)-β (1:1000, Abcam), cytosolic-cytochrome-C (1:5000, BD), high-mobility group box 1 (HMGB-1) (1:1000, Cell Signaling), toll-like receptor (TLR)-2 (1:1000, Abcam), TLR-4 (1:1000, Novus), myelin and lymphocyte (MAL) (1:1000, Abcam), translocating chain-associated membrane (TRAM) (1:1000, Invitrogen), myeloid differentiation primary response 88 (MYD88) (1:1000, Abcam), TIR-domain-containing adapter-inducing interferon-β (TRIF) (1: 1000, Abcam), TNF receptor associated factor 6 (TRAF6) (1:1000, Abcam), IkB-β (1:1000, Abcam), p-nuclear factor (NF)-κB (1:1000, Abcam), apoptosis signal-regulating kinase 1 (ASK1) (1:1000, Abcam), phosphorylated (p)-mitogen-activated protein kinase kinase 4 (MKK4) (1:1000, Cell Signaling), p-MMK7 (1:1000, Invitrogen), c-Jun N-terminal kinase (JNK) (1: 1000, Abcam), p-JUN (1:1000, Abcam), cyclophilin D (1:1000, Abcam), dynamin-related protein 1 (Drp1) (1:1000, Cell Signaling)] for 1 h at room temperature. Horseradish peroxidase–conjugated anti-rabbit IgG (1:2000, Cell Signaling) was used as a secondary antibody. Immuno-reactive bands were visualized by enhanced chemiluminescence (ECL; Amersham Biosciences) and digitized using Labwork software (UVP).
Immunofluorescent Staining
Immunofluorescent (IF) staining proceeded as our previously reported37,38,40–42. Rehydrated paraffin sections were first treated with 3% H2O2 for 30 min and incubated with Immuno-Block reagent (BioSB, Santa Barbara, CA, USA) for 30 min at room temperature. Sections were then incubated with primary antibodies specifically against γ-H2AX (1: 200, Abcam, Cambridge, UK) and CD68 (1:100, Abcam, Cambridge, UK). Sections incubated with irrelevant antibodies served as controls. Three sections of lung specimens were analyzed in each rat. For quantification, three randomly selected high-power fields (HPFs) were analyzed per section. The mean number of positively stained cells per HPF for each animal was determined across all nine HPFs.
Histological Quantification of Lung Fibrosis
Masson’s trichrome staining (ScyTek Lab) was utilized for analyzing the fibrosis of lung parenchyma. Three serial sections of lung organ in each animal at the same levels were prepared at 4 µm thickness by Cryostat (Leica CM3050S). The integrated area (µm2) of fibrosis on each section was calculated using the Image Tool 3 (IT3) image analysis software (University of Texas, Health Science Center, San Antonio, UTHSCSA; Image Tool for Windows, Version 3.0, USA). Three randomly selected HPFs (100×) were analyzed in each section. After assessment of the number of pixels in each fibrotic area per HPF, the number of pixels obtained from three HPFs was summed. The procedure was repeated in two other sections for each animal. The mean pixel number per HPF for each animal was then calculated by summing up all pixel numbers and divided by 9. The mean integrated area (µm2) of fibrosis in lung parenchyma per HPF was obtained using a conversion factor of 19.24 (1 µm2 corresponded to 19.24 pixels).
β-Galactosidase Histochemistry Stain
PECL2 was first rinsed twice in PBS at 4°C for 10 min, followed by immersing in the β-galactosidase staining solution (at pH 6.0 for senescence-associated β-galactosidase at room temperature). After the appropriate staining period, the cells were washed twice in PBS for 10 min at room temperature and then were counterstained in Nuclear Fast Red (Vector Laboratories) for 30 min, rinsed twice again in PBS, and then mounted in a slide for observation.
Statistical Analyses
Quantitative data were expressed as mean ± standard deviation. Statistical analysis was performed by analysis of variance (ANOVA) followed by Bonferroni multiple-comparison post hoc test. All analyses were conducted using SAS statistical software for Windows version 8.2 (SAS Institute, Cary, NC, USA). A probability value <0.05 was considered statistically significant.
Results
Impact of HUCDMSCs on Downregulating Upstream and Downstream Inflammatory Signaling in Rat PECL2 Underwent Lung Extraction Treatment
To elucidate whether HUCDMSCs treatment would downregulate inflammatory reaction induced by lung extraction of ARDS rat, the Western blot was utilized in the present in vitro study (Fig. 1). The result demonstrated that the protein expressions of HMGB-1, TLR-2, TLR-4, MAL, TRAM, MYD88, TRIF, TRAF6, IkB-β, p-NF-κB, IL-1β, and TNF-α, 12 biomarkers of upstream and downstream inflammatory signaling, were significantly increased in G3 than in G1 and G2 but they were significantly reversed in G4 except TRAF6 that was notably higher in G2 than G1. However, these parameters did not differ between G1 and G2, suggesting that healthy lung extraction did not elicit the inflammatory reaction.

Impact of HUCDMSCs on downregulating upstream and downstream inflammatory signaling in rat PECL2 underwent lung extraction treatment. (A) Protein expression of high-mobility group box 1 (HMGB-1)* versus other groups with different symbols (†, ‡), P < 0.001. (B) Protein expression of toll-like receptor (TLR)-2* versus other groups with different symbols (†, ‡), P < 0.001. (C) Protein expression of TLR-4* versus other groups with different symbols (†, ‡), P < 0.001. (D) Protein expression of myelin and lymphocyte protein (MAL)* versus other groups with different symbols (†, ‡), P < 0.001. (E) Protein expression of translocation associated membrane protein (TRAM)* versus other groups with different symbols (†, ‡), P < 0.001. (F) Protein expression of myeloid differentiation primary response 88 (MYD88)* versus other groups with different symbols (†, ‡), P < 0.001. (G) Protein expression of TIR-domain-containing adapter-inducing interferon-β (TRIF)* versus other groups with different symbols (†, ‡), P < 0.001. (H) Protein expression of TNF receptor-associated factor 6 (TRAF6)* versus other groups with different symbols (†, ‡, §), P < 0.0001. (I) Protein expression of nuclear factor of kappa light polypeptide gene enhancer in B-cell inhibitor, β (IκB-β)* versus other groups with different symbols (†, ‡), P < 0.001. (J) Protein expression of phosphorylated nuclear factor (p-NF)-κB* versus other groups with different symbols (†, ‡), P < 0.001. (K) Protein expression of interleukin (IL)-1β* versus other groups with different symbols (†, ‡), P < 0.001. (L) Protein expression of tumor necrosis factor a (TNF-α)* versus other groups with different symbols (†, ‡), P < 0.001. All statistical analyses were performed by one-way ANOVA, followed by Bonferroni multiple comparison post hoc test (n = 3). Symbols (*, †, ‡, §) indicate significance (at 0.05 level). ANOVA: analysis of variance; ARDS: acute respiratory distress syndrome; HUCDMSCs: human umbilical cord–derived mesenchymal stem cells; PECL2: pulmonary epithelial cell line L2.
Impact of HUCDMSCs on Downregulating Oxidative-Stress Signaling in Rat PECL2 Underwent Lung Extraction Treatment
To elucidate whether HUCDMSCs treatment could suppress oxidative stress signaling augmented by the ARDS rat lung extraction, the Western blot analysis was used in the present in vitro study (Fig. 2). The result showed that the protein expressions of NOX-1, NOX-2, ASK1, p-MKK4, p-MKK7, p-JNK, and p-JUN, seven indicators of upstream and downstream oxidative-stress/cell-stress signaling, were significantly upregulated in G3 than in G1 and G2 but they were significantly reversed in G4. However, these biomarkers were similar between G1 and G2, suggesting the only ARDS lung extraction treatment rather than the healthy lung extraction counterpart could upregulate the oxidative-stress/cell-stress signaling.

Impact of HUCDMSCs on downregulating oxidative signaling in rat PECL2 underwent lung extraction treatment. (A) Protein expression of NOX-1* versus other groups with different symbols (†, ‡), P < 0.001. (B) Protein expression of NOX-2* versus other groups with different symbols (†, ‡), P < 0.001. (C) Protein expression of apoptosis signal-regulating kinase 1 (ASK1)* versus other groups with different symbols (†, ‡), P < 0.001. (D) Protein expression of mitogen-activated protein kinase kinase 4 (p-MKK4)* versus other groups with different symbols (†, ‡), P < 0.001. (E) Protein expression of p-MKK7* versus other groups with different symbols (†, ‡), P < 0.001. (F) Protein expression of phosphorylated c-Jun N-terminal kinases 1/2 (p-JNK1/2)* versus other groups with different symbols (†, ‡), P < 0.001. (G) Protein expression of phosphorylated cellular Jun (p-c-JUN)* versus other groups with different symbols (†, ‡), P < 0.001. All statistical analyses were performed by one-way ANOVA, followed by Bonferroni multiple comparison post hoc test (n = 3). Symbols (*, †, ‡) indicate significance (at 0.05 level). ANOVA: analysis of variance; ARDS: acute respiratory distress syndrome; HUCDMSCs: human umbilical cord–derived mesenchymal stem cells; PECL2: pulmonary epithelial cell line L2.
Impact of HUCDMSCs on Downregulating Mitochondrial Damaged, Apoptotic, and Fibrotic Biomarkers in Rat PECL2 Underwent Lung Extraction Treatment
Again, we utilized the Western blot analysis to clarify whether HUCDMSCs treatment would attenuate mitochondrial damage, fibrosis, and apoptosis induced by the ARDS rat lung extraction in rat lung epithelial cells (Fig. 3). As we expected, the protein expressions of cytosolic cytochrome C, cyclophilin D, and DRP1, three indicators of mitochondrial damage, were significantly higher in G3 than in G1, G2, and G4 and significantly higher in G4 than in G1 and G2, whereas these parameters did not differ between G1 and G2. Additionally, the protein expressions of TGF-β and Smad3, two biomarkers of fibrosis, and the protein expressions of cleaved caspase 3 and cleaved PARP, two indicators of apoptosis, exhibited an identical pattern of mitochondrial damaged markers among the groups except c-PARP that was notably increased in G2 than G1, suggesting that the healthy lung extraction treatment also did not upregulate the above-mentioned molecular perturbations.

Impact of HUCDMSCs on downregulating mitochondrial damaged, apoptotic, and fibrotic biomarkers in rat PECL2 underwent lung extraction treatment. (A) Protein expression of cyclophilin D (cyc-D)* versus other groups with different symbols (†, ‡), P < 0.001. (B) Protein expression of dynamin-related protein 1 (DRP1)* versus other groups with different symbols (†, ‡), P < 0.001. (C) Protein expression of cleaved caspase 3 (c-Casp3)* versus other groups with different symbols (†, ‡), P < 0.001. (D) Protein expression of cleaved poly (ADP-ribose) polymerase (c-PARP)* versus other groups with different symbols (†, ‡, §), P < 0.001. (E) Protein expression of transforming growth factor (TGF)-β* versus other groups with different symbols (†, ‡), P < 0.001. (F) Protein expression of phosphorylated (p)-Smad3* versus other groups with different symbols (†, ‡), P < 0.001. All statistical analyses were performed by one-way ANOVA, followed by Bonferroni multiple comparison post hoc test (n = 3). Symbols (*, †, ‡, §) indicate significance (at 0.05 level). ANOVA: analysis of variance; ARDS: acute respiratory distress syndrome; HUCDMSCs: human umbilical cord–derived mesenchymal stem cells; PECL2: pulmonary epithelial cell line L2.
Impact of HUCDMSCs on Downregulating Total Intracellular and Mitochondrial Levels of ROS, DNA Damage, and Senescence in Rat PECL2 Underwent Lung Extraction Treatment
To assess the total intracellular and mitochondrial levels of ROS, the flow cytometric analysis was utilized in the present in vitro study (Figs. 4 and 5). The result demonstrated that both total intracellular and mitochondrial levels of ROS were significantly increased in G3 than in G1, G2, and G4 and significantly increased in G4 than in G1 and G2, but they showed no difference between G1 and G2 (Fig. 4). Additionally, IF and IHC microscopic findings revealed that the number of γ-H2AX+ cells, an indicator of DNA-damaged marker, and the number of β-Galactosidase+ cells, an indicator of cellular senescence, displayed an identical pattern of ROS among the four groups (Fig. 5).

Impact of HUCDMSCs on downregulating total intracellular and mitochondrial levels of reactive oxygen species (ROS) in rat PECL2 underwent lung extraction treatment. (A–D) The result of flow cytometric analysis for identification of total intracellular ROS. (E) Analytical result of mean fluorescent intensity of intracellular ROS (i.e., H2DCFDA stain)* versus other groups with different symbols (†, ‡), P < 0.0001. (F–I) The result of flow cytometric analysis for mitochondrial ROS. (J) Analytical result of mean fluorescent intensity of mitochondrial ROS (i.e., DHR123 stain)* versus other groups with different symbols (†, ‡), P < 0.0001. All statistical analyses were performed by one-way ANOVA, followed by Bonferroni multiple comparison post hoc test (n = 3). Symbols (*, †, ‡) indicate significance (at 0.05 level). ANOVA: analysis of variance; ARDS: acute respiratory distress syndrome; HUCDMSCs: human umbilical cord–derived mesenchymal stem cells; PECL2: pulmonary epithelial cell line L2.

Impact of HUCDMSCs on attenuating the DNA damage and senescence in rat PECL2 underwent lung extraction treatment. (A–D) The immunofluorescent (IF) microscopic finding (400×) for identification of γ-H2AX+ cells (pink color). (E) Analytical result of number of γ-H2AX+ cells* versus other groups with different symbols (†, ‡), P < 0.0001. (F–I) The microscopic finding (400×) of immunohistochemical (IHC) stain for identification of β-Galactosidase+ cells (green color). (J) Analytical result of number of β-Galactosidase+ cells* versus other groups with different symbols (†, ‡), P < 0.0001. Scale bars in right lower corner represent 20 µm. All statistical analyses were performed by one-way ANOVA, followed by Bonferroni multiple comparison post hoc test (n = 3). Symbols (*, †, ‡) indicate significance (at 0.05 level). ANOVA: analysis of variance; ARDS: acute respiratory distress syndrome; HUCDMSCs: human umbilical cord–derived mesenchymal stem cells; PECL2: pulmonary epithelial cell line L2.
Arterial Oxygen Saturation (SaO2 %) and BAL Findings by Day 5 After ARDS Induction
The SaO2% was highest in group 1 (SC), lowest in group 2 (ARDS + normal saline only), significantly higher in group 5 (ARDS + HUCDMSCs intravenous administration at 3 h and 24 h after 48 h ARDS induction, respectively) than in group 3 (ARDS + HUCDMSCs intravenous administration at 3 h after 48 h ARDS induction) and group 4 (ARDS + HUCDMSCs intravenous administration at 24 h after 48 h ARDS induction), but it showed no difference between groups 3 and 4 (Fig. 6). Additionally, the flow cytometric analysis of BAL fluid demonstrated that the numbers of CD11b/c+ and Ly6G+ cells, two indicators of inflammatory cells, were highest in group 2, lowest in group 1, significantly higher in group 4 than in groups 3 and 5, and significantly higher in group 3 than in group 5. Furthermore, the albumin level of BAL fluid, an indicator of lung damage and exudate leakage from lung parenchyma, exhibited an identical pattern of inflammatory cells among the groups. Moreover, the mortality rate did not differ among groups 1 to 5 [i.e., groups 1 (0/8, 0%), 2 (2/10, 20%), 3 (0/8, 0%), 4 (0/8, 0%), and 5 (0/8, 0%), respectively, P > 0.1]. Of importance was that there was no side effect of immune rejection observed after HUCDMSCs therapy.

Arterial oxygen saturation (SaO2%) and BAL findings at day 5 after ARDS induction. (A) Analytical results of the SaO2%* versus other groups with different symbols (†, ‡, §), P < 0.0001. n = 8 for each group. (B) Flow cytometric analysis of number of CD11b/c+ cells in bronchioalveolar lavage (BAL) fluid* versus other groups with different symbols (†, ‡, §, ¶), P < 0.0001. (C) Flow cytometric analysis of number of Ly6G+ cells in BAL fluid* versus other groups with different symbols (†, ‡, §, ¶), P < 0.0001. (D) Blue stain for identification of albumin in BAL fluid. (E) Analytical result of albumin level of BAL fluid* versus other groups with different symbols (†, ‡, §, ¶), P < 0.0001. All statistical analyses were performed by one-way ANOVA, followed by Bonferroni multiple comparison post hoc test (n = 4). Symbols (*, †, ‡, §, ¶) indicate significance (at 0.05 level). ANOVA: analysis of variance; ARDS: acute respiratory distress syndrome; HUCDMSCs: human umbilical cord–derived mesenchymal stem cells; HUCDMSC3h: HUCDMSCs administration at 3 h after 48 h ARDS induction; HUCDMSC24h: HUCDMSCs administration at 24 h after 48 h ARDS induction; HUCDMSC3h/24h: HUCDMSCs administration at 3 h and 24 h after 48 h ARDS induction; SC: sham control.
Time Courses of Circulatory Level of Immune Cells in Each Group of the Animals
To investigate whether HUCDMSCs treatment would regulate ARDS-induced circulatory level of immune cells, the flow cytometric analysis was utilized for the investigation (Fig. 7). The result showed that the baseline levels of circulatory immune cells and regulatory T cells did not differ among the groups. However, by days 3 and 5 after HUCDMSCs transfusion, the circulatory levels of CD3/CD4+ cells and CD3/CD8+ cells, two indicators of immune cells, were highest in group 2, lowest in group 1, significantly higher in group 4 than in groups 3 and 5, and significantly higher in group 3 than in group 5. On the other hand, the circulatory level of CD4+CD25+Foxp3+ regulatory T cells (i.e., Treg+ cells), a specialized subpopulation of T cells that acts to suppress immune response, exhibited an opposite pattern of immune cells among the five groups, implicating two doses of HUCDMSCs treatment offered the strongest effect on inhibiting the immune reaction in setting of ARDS.
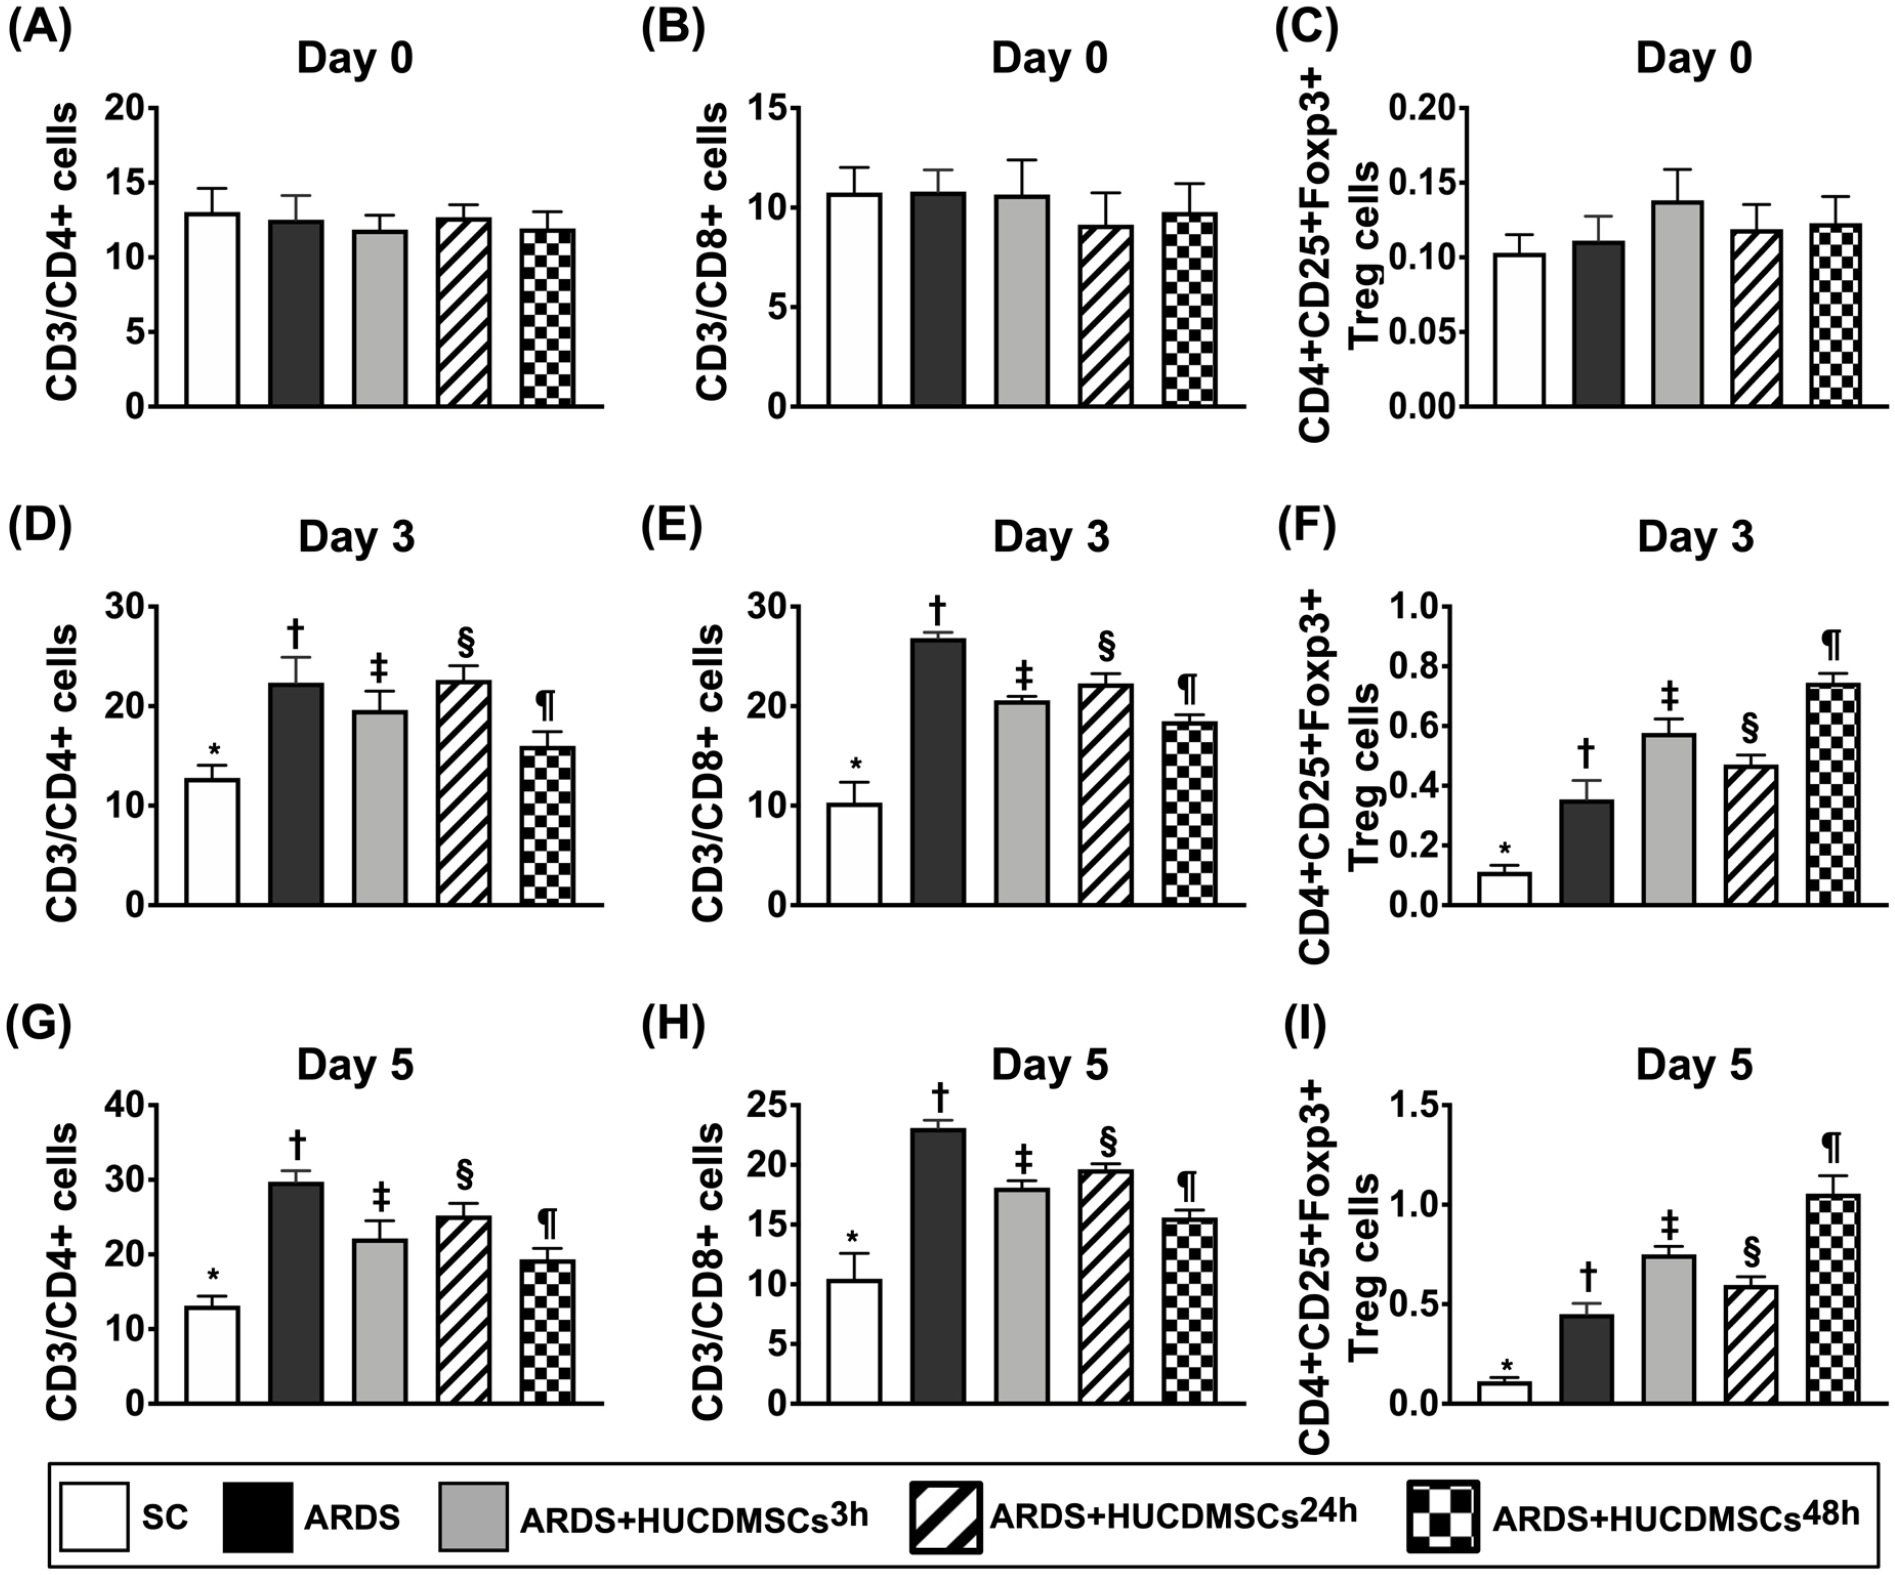
Time courses of circulatory levels of immune cells prior to and after ARDS induction. (A) Circulatory number of CD3/CD4+ cells at day 0, P > 0.5. (B) Circulatory number of CD3/CD8+ cells, P > 0.5. (C) Circulatory number of CD4+CD25+Foxp3+ regulatory T cells (i.e., Treg+ cells), P > 0.5. (D) Circulatory number of CD3/CD4+ cells at day 3* versus other groups with different symbols (†, ‡, §, ¶), P < 0.0001. (E) Circulatory number of CD3/CD8+ cells at day 3* versus other groups with different symbols (†, ‡, §, ¶), P < 0.0001. (F) Circulatory number of CD4+CD25+Foxp3+ regulatory T cells (i.e., Treg+ cells) at day 3* versus other groups with different symbols (†, ‡, §, ¶), P < 0.0001. (G) Circulatory number of CD3/CD4+ cells at day 5* versus other groups with different symbols (†, ‡, §, ¶), P < 0.0001. (H) Circulatory number of CD3/CD8+ cells at day 5* versus other groups with different symbols (†, ‡, §, ¶), P < 0.0001. (I) Circulatory number of CD4+CD25+Foxp3+ regulatory T cells (i.e., Treg+ cells) at day 5* versus other groups with different symbols (†, ‡, §, ¶), P < 0.0001. Symbols (*, †, ‡, §, ¶) indicate significance (at 0.05 level). All statistical analyses were performed by one-way ANOVA, followed by Bonferroni multiple comparison post hoc test (n = 7). Symbols (*, †, ‡, §, ¶) indicate significance (at 0.05 level). ANOVA: analysis of variance; ARDS: acute respiratory distress syndrome; HUCDMSCs: human umbilical cord–derived mesenchymal stem cells; HUCDMSC3h: HUCDMSCs administration at 3 h after 48 h ARDS induction; HUCDMSC24h: HUCDMSCs administration at 24 h after 48 h ARDS induction; HUCDMSC3h/24h: HUCDMSCs administration at 3 h and 24 h after 48 h ARDS induction; SC: sham control.
Time Courses of Circulatory Inflammatory Cells and Inflammatory Cell Infiltration in Lung Parenchyma by Day 5 After ARDS Induction
To delineate whether ARDS induced inflammation in lung would overflow into the circulation, serial blood samplings were collected in each group of the animals (Fig. 8). The result of flow cytometric analysis revealed that prior to ARDS induction, the circulatory numbers of CD11b/c+, Ly6G+, and MPO+ cells, three indicators of inflammatory-cell surface markers, did not differ among the groups. However, by days 3 and 5 after ARDS induction, these parameters were highest in group 2, lowest in group 1, significantly higher in group 4 than in groups 3 and 5, and significantly higher in group 3 than in group 5. Additionally, the number of CD68+ cell infiltration in lung parenchyma, an indicator of cellular level of inflammation, exhibited an identical pattern of circulatory inflammatory cells at the time interval of days 3 and 5 among the groups. Our findings indicated that two doses of HUCDMSCs treatment provided the best effect on suppressing the inflammatory reaction in ARDS rodents.

Time courses of circulatory inflammatory cells and inflammatory cell infiltration in lung parenchyma by day 5 after ARDS induction. (A) Circulatory number of Ly6G+ cells at day 0, P > 0.5. (B) Circulatory number of CD11b/c+ cells at day 0, P > 0.5. (C) Circulatory number of myeloperoxidase (MPO)+ cells at day 0, P > 0.5. (D) Circulatory number of Ly6G+ cells at day 3* versus other groups with different symbols (†, ‡, §, ¶), P < 0.0001. (E) Circulatory number of CD11b/c+ cells at day 3* versus other groups with different symbols (†, ‡, §, ¶), P < 0.0001. (F) Circulatory number of myeloperoxidase (MPO)+ cells at day 3* versus other groups with different symbols (†, ‡, §, ¶), P < 0.0001. (G) Circulatory number of Ly6G+ cells at day 5* versus other groups with different symbols (†, ‡, §, ¶), P < 0.0001. (H) Circulatory number of CD11b/c+ cells at day 5* versus other groups with different symbols (†, ‡, §, ¶), P < 0.0001. (I) Circulatory number of myeloperoxidase (MPO)+ cells at day 5* versus other groups with different symbols (†, ‡, §, ¶), P < 0.0001. (J–N) The immunofluorescent (IF) microscopic finding (400×) for identification of CD68+ cell infiltration (green color). (O) Analytical result of number of CD68+ cells* versus other groups with different symbols (†, ‡, §, ¶), P < 0.0001. All statistical analyses were performed by one-way ANOVA, followed by Bonferroni multiple comparison post hoc test (n = 7). Symbols (*, †, ‡, §, ¶) indicate significance (at 0.05 level). ANOVA: analysis of variance; ARDS: acute respiratory distress syndrome; HUCDMSCs: human umbilical cord–derived mesenchymal stem cells; HUCDMSC3h: HUCDMSCs administration at 3 h after 48 h ARDS induction; HUCDMSC24h: HUCDMSCs administration at 24 h after 48 h ARDS induction; HUCDMSC3h/24h: HUCDMSCs administration at 3 h and 24 h after 48 h ARDS induction; SC: sham control.
Lung Injury Score and Fibrosis of Lung Parenchyma by Day 5 After ARDS Induction
To further clarify whether HUCDMSCs therapy would attenuate the lung parenchymal damage, the microscopic finding of H&E stain was utilized for the histopathological finding (Fig. 9). The result demonstrated that the lung injury score was highest in group 2, lowest in group 1, significantly higher in group 4 than in groups 3 and 5, and significantly higher in group 3 than in group 5. Additionally, the IHC microscopic finding demonstrated that the fibrotic area of the lung parenchyma displayed an identical pattern of lung injury score among the groups. Our finding implicated that even xenogeneic MSCs (i.e., HUCDMSCs therapy to rat ARDS) still effectively protected the lung parenchyma against ARDS damage.

Lung injury score and fibrosis of lung parenchyma by day 5 after ARDS induction. (A–E) Histopathological findings (i.e., H&E stain) of lung parenchyma under microscopic finding (200×) for assessment of lung injury scores among the five groups. (F) The number of alveolar sacs among five groups* versus other groups with different symbols (†, ‡, §, ¶), P < 0.0001. (G) Crowded scores of lung parenchyma* versus other groups with different symbols (†, ‡, §, ¶), P < 0.0001. The scale bars in the right lower corner represent 50 µm. (H–L) The microscopic finding (100×) of Masson’s trichome stain for identification of fibrosis in lung fibrosis (blue color). (M) Analytical result of fibrotic area* versus other groups with different symbols (†, ‡, §, ¶), P < 0.0001. The scale bars in the right lower corner represent 100 µm. All statistical analyses were performed by one-way ANOVA, followed by Bonferroni multiple comparison post hoc test (n = 6). Symbols (*, †, ‡, §, ¶) indicate significance (at 0.05 level). ANOVA: analysis of variance; ARDS: acute respiratory distress syndrome; HUCDMSCs: human umbilical cord–derived mesenchymal stem cells; HUCDMSC3h: HUCDMSCs administration at 3 h after 48 h ARDS induction; HUCDMSC24h: HUCDMSCs administration at 24 h after 48 h ARDS induction; HUCDMSC3h/24h: HUCDMSCs administration at 3 h and 24 h after 48 h ARDS induction; SC: sham control.
Protein Expressions of Inflammatory Biomarkers in Lung Parenchyma by Day 5 After ARDS Induction
Lung tissue was collected for clarifying the impact of HUCDMSCs treatment on ameliorating the molecular levels of inflammation (Fig. 10). The Western blot analysis was utilized. The result showed that the protein expressions of HMGB-1, TLR-2, TLR-4, MAL, TRAM, MyD88, TRIF, TRAF6, p-NF-κB, IL-1β, and TNF-α, 11 inflammatory biomarkers, were highest in group 2, lowest in group 1, significantly higher in group 4 than in groups 3 and 5, and significantly higher in group 3 than in group 5. Additionally, it is well known that the protein expression of IKB-β is specifically involved in MyD88-mediated p-NF-κB-dependent signaling. In the present study, we identified that the protein expression of p-IKB-β exhibited an opposite pattern of MyD88 among five groups, suggesting an intrinsic consumption for active involvement in the inflammatory signaling transduction.
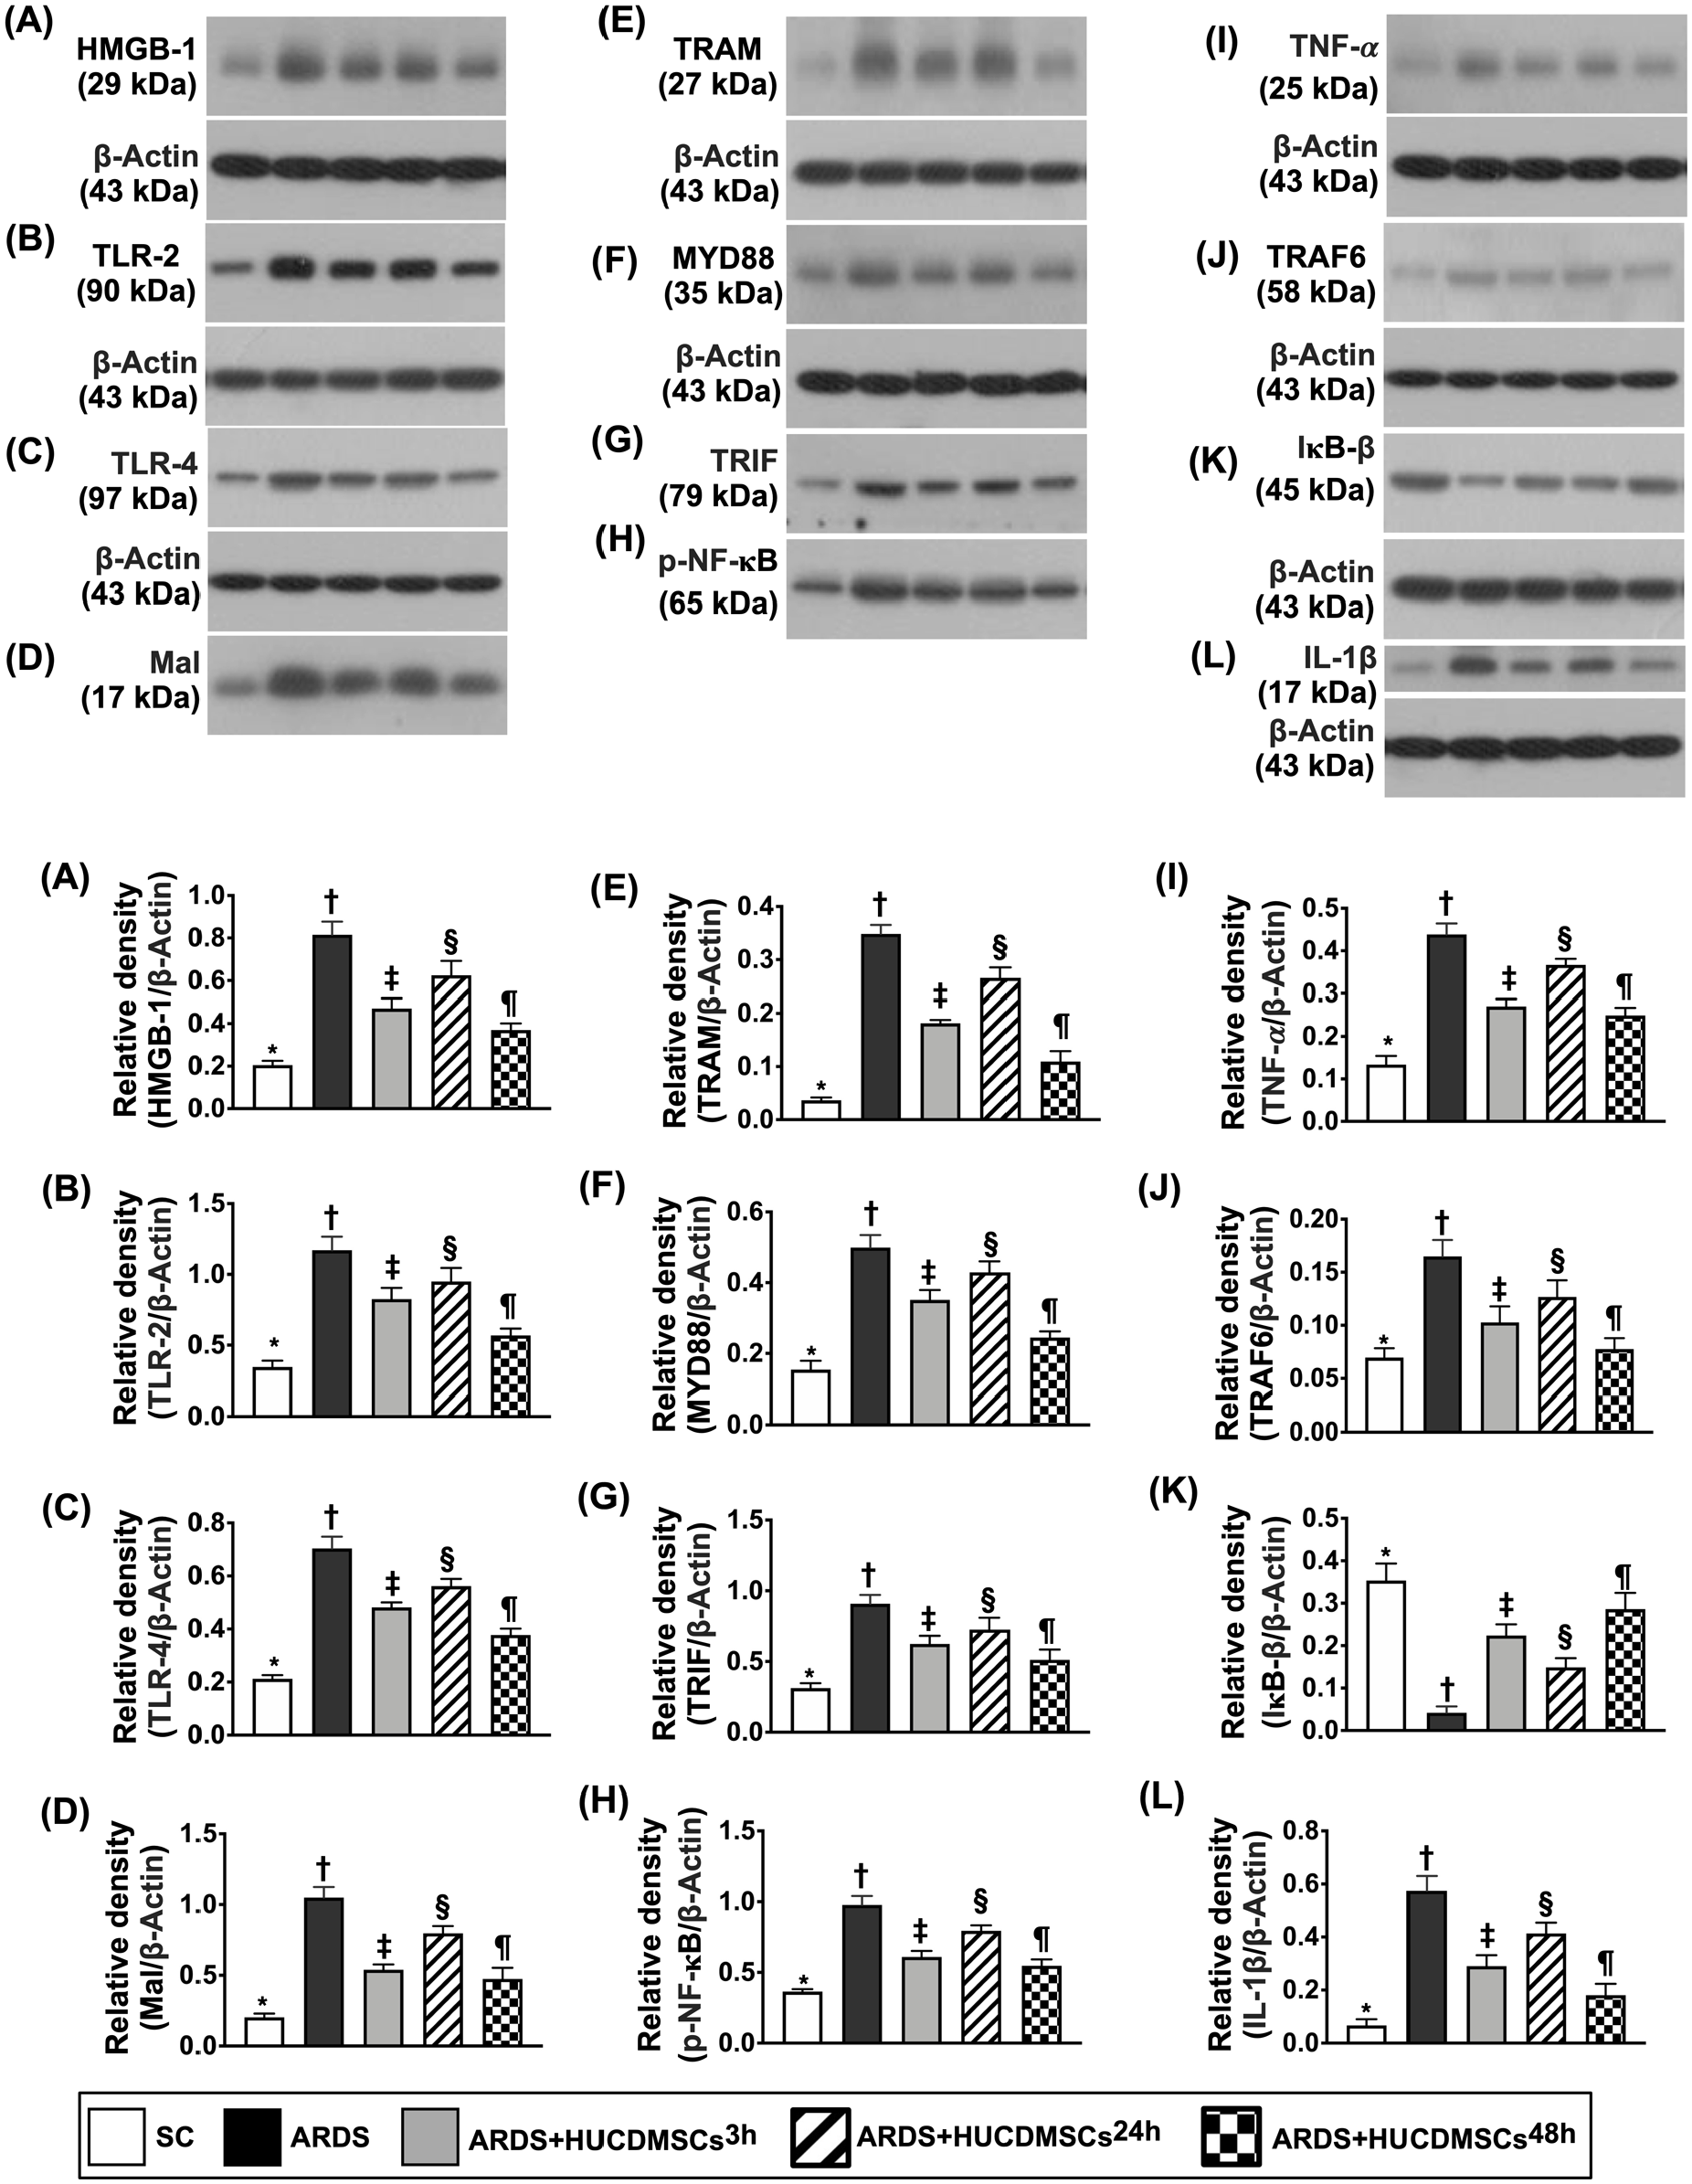
Protein expression of inflammatory biomarkers in lung parenchyma by day 5 after ARDS induction. (A) Protein expression of high-mobility group box 1 (HMGB-1)* versus other groups with different symbols (†, ‡, §, ¶), P < 0.0001. (B) Protein expression of toll-like receptor (TLR)-2* versus other groups with different symbols (†, ‡, §, ¶), P < 0.0001. (C) Protein expression of TLR-4* versus other groups with different symbols (†, ‡, §, ¶), P < 0.0001. (D) Protein expression of myelin and lymphocyte protein (MAL)* versus other groups with different symbols (†, ‡, §, ¶), P < 0.0001. (E) Protein expression of translocation associated membrane protein (TRAM)* versus other groups with different symbols (†, ‡, §, ¶), P < 0.0001. (F) Protein expression of myeloid differentiation primary response 88 (MyD88)* versus other groups with different symbols (†, ‡, §, ¶), P < 0.0001. (G) Protein expression of TIR-domain-containing adapter-inducing interferon-β (TRIF)* versus other groups with different symbols (†, ‡, §, ¶), P < 0.0001. (H) Protein expression of phosphorylated nuclear factor (p-NF)-κB* versus other groups with different symbols (†, ‡, §, ¶), P < 0.0001. (I) Protein expression of tumor necrosis factor α (TNF-α)* versus other groups with different symbols (†, ‡, §, ¶), P < 0.0001. (J) Protein expression of TNF receptor-associated factor 6 (TRAF6)* versus other groups with different symbols (†, ‡, §, ¶), P < 0.0001. (K) Protein expression of nuclear factor of kappa light polypeptide gene enhancer in B-cell inhibitor, b (IκB-β)* versus other groups with different symbols (†, ‡, §, ¶), P < 0.0001. (L) Protein expression of interleukin (IL)-1β* versus other groups with different symbols (†, ‡, §, ¶), P < 0.0001. All statistical analyses were performed by one-way ANOVA, followed by Bonferroni multiple comparison post hoc test (n = 6). Symbols (*, †, ‡, §, ¶) indicate significance (at 0.05 level). ANOVA: analysis of variance; ARDS: acute respiratory distress syndrome; HUCDMSCs: human umbilical cord–derived mesenchymal stem cells; HUCDMSC3h: HUCDMSCs administration at 3 h after 48 h ARDS induction; HUCDMSC24h: HUCDMSCs administration at 24 h after 48 h ARDS induction; HUCDMSC3h/24h: HUCDMSCs administration at 3 h and 24 h after 48 h ARDS induction; SC: sham control.
Protein Expressions of Mitochondrial Damaged, Apoptotic, and Fibrotic Biomarkers in Lung Parenchyma by Day 5 After ARDS Induction
Protein expressions of cytosolic cytochrome C, cyclophilin D, and DRP1, three indicators of mitochondrial damage, were highest in group 2, lowest in group 1, significantly higher in group 4 than in groups 3 and 5, and significantly higher in group 3 than in group 5 (Fig. 11). Additionally, the protein expressions of cleaved caspase 3 and cleaved PARP, two indicators of apoptosis, and the protein expressions of TGF-β and Smad3, two biomarkers of fibrosis, exhibited an identical pattern of mitochondrial damaged markers among the groups.

Protein expression of mitochondrial damaged, apoptotic, and fibrotic biomarkers in lung parenchyma by day 5 after ARDS induction. (A) Protein expression of cytosolic cytochrome C (cyt-CytoC)* versus other groups with different symbols (†, ‡, §, ¶), P < 0.0001. (B) Protein expression of cyclophilin D (cyc-D)* versus other groups with different symbols (†, ‡, §, ¶), P < 0.0001. (C) Protein expression of dynamin-related protein 1 (DRP1)* versus other groups with different symbols (†, ‡, §, ¶), P < 0.0001. (D) Protein expression of cleaved caspase 3 (c-Casp)* versus other groups with different symbols (†, ‡, §, ¶), P < 0.0001. (E) Protein expression of cleaved poly (ADP-ribose) polymerase (PARP) (c-PARP)* versus other groups with different symbols (†, ‡, §, ¶), P < 0.0001. (F) Protein expression of transforming growth factor (TGF)-β* versus other groups with different symbols (†, ‡, §, ¶), P < 0.0001. (G) Protein expression of phosphorylated (p)-Smad3* versus other groups with different symbols (†, ‡, §, ¶), P < 0.0001. All statistical analyses were performed by one-way ANOVA, followed by Bonferroni multiple comparison post hoc test (n = 6). Symbols (*, †, ‡, §, ¶) indicate significance (at 0.05 level). ANOVA: analysis of variance; ARDS: acute respiratory distress syndrome; HUCDMSCs: human umbilical cord–derived mesenchymal stem cells; HUCDMSC3h: HUCDMSCs administration at 3 h after 48 h ARDS induction; HUCDMSC24h: HUCDMSCs administration at 24 h after 48 h ARDS induction; HUCDMSC3h/24h: HUCDMSCs administration at 3 h and 24 h after 48 h ARDS induction; SC: sham control.
Protein Expressions of Oxidative-Cell Stress Signaling in Lung Parenchyma by Day 5 After ARDS Induction
The protein expressions of NOX-1, NOX-2, ASK1, p-MKK4, p-MKK7, p-JNK, and p-JUN, seven indicators of oxidative-cell-stress signaling, were highest in group 2, lowest in group 1, significantly higher in group 4 than in groups 3 and 5, and significantly higher in group 3 than in group 5 (Fig. 12).

Protein expression of oxidative cell stress signaling in lung parenchyma by day 5 after ARDS induction. (A) Protein expression of NOX-1* versus other groups with different symbols (†, ‡, §, ¶), P < 0.0001. (B) Protein expression of apoptosis signal-regulating kinase 1 (ASK1)* versus other groups with different symbols (†, ‡, §, ¶), P < 0.0001. (C) Protein expression of NOX-2* versus other groups with different symbols (†, ‡, §, ¶), P < 0.0001. (D) Protein expression of mitogen-activated protein kinase kinase 4 (p-MKK4)* versus other groups with different symbols (†, ‡, §, ¶), P < 0.0001. (E) Protein expression of p-MKK7* versus other groups with different symbols (†, ‡, §, ¶), P < 0.0001. (F) Protein expression of phosphorylated c-Jun N-terminal kinases 1/2 (p-JNK1/2)* versus other groups with different symbols (†, ‡, §, ¶), P < 0.0001. (G) Protein expression of phosphorylated cellular Jun (p-cJUN)* versus other groups with different symbols (†, ‡, §, ¶), P < 0.0001. All statistical analyses were performed by one-way ANOVA, followed by Bonferroni multiple comparison post hoc test (n = 6). Symbols (*, †, ‡, §, ¶) indicate significance (at 0.05 level). ANOVA: analysis of variance; ARDS: acute respiratory distress syndrome; HUCDMSCs: human umbilical cord–derived mesenchymal stem cells; HUCDMSC3h: HUCDMSCs administration at 3 h after 48 h ARDS induction; HUCDMSC24h: HUCDMSCs administration at 24 h after 48 h ARDS induction; HUCDMSC3h/24h: HUCDMSCs administration at 3 h and 24 h after 48 h ARDS induction; SC: sham control.
Schematically Illustrated the Time Courses of ARDS Induction and HUCDMSCs Treatment and the Final Destination of HUCDMSCs
The Supplemental Fig. 1 clearly illustrated the time courses of ADRS induction, HUCDMSCs transfusion, blood samplings, and the end of study period. Additionally, the IF microscopic findings demonstrated that abundant HUCDMSCs were still identifiable to engage into alveolar septum and lung parenchyma by day 5 after cells transfusion. On the other hand, no HUCDMSC was identified in the major organs of brain, heart, liver, and kidney.
Discussion
This preclinical study which investigated xenogeneic MSCs (i.e., HUCDMSCs) treatment on protecting the rat lung against ARDS-induced injury brought about several striking implications. First, we had successfully created a reliable and reproducible ARDS model in rodents and the utmost important finding was that there was not any immune rejection–related side effect identified in xenogeneic HUCDMSCs treatment. Second, early (i.e., cell therapy at 3 h after successful ARDS induction) was better than later administration (i.e., cell therapy at 24 h after successful ARDS induction) of HUCDMSCs treatment for preserving the integrity of lung parenchyma and lung function after ARDS induction, suggesting that early cell therapy is a cardinal time for saving the life in critical patients. Of particular importance was that double-dose administration of HUCDMSCs treatment (i.e., cell therapy at the early and late time points) was superior to early treatment for protecting the lung organ against ARDS damage, suggesting a dose-dependent benefit of HUCDMSCs therapy. Third, the results of this study clearly elucidated the inflammation and oxidative stress were two fundamental signaling pathways for ARDS-induced lung damage and impairment of the lung functional integrity.
Our previous phase I clinical trial has demonstrated that HUCDMSCs therapy was safe with potentially favorable outcome on moderate-severe ARDS patients 33 . An essential finding in the present study was that xenogeneic HUCDMSCs therapy not only was safe without any immune injection but also effectively protected the rat lung from ARDS injury. In this way, our results, in addition to supporting the finding of our phase I clinical study 33 , proved that even xenogeneic MSCs therapy still was safe and efficacious as well as ensured immune privilege.
Interestingly, when we looked at the results of our phase I clinical trial, several distinctive features were identified. First, the systemic inflammatory reaction was downregulated soon after HUCDMSCs transfusion and upregulated again at 72 h after these cell therapies. Second, in expired patients (i.e., 3 of 9 deaths), the chest x-ray identified that the consolidations of lung parenchyma were quickly resolved after HUCDMSCs transfusion, but these consolidations soon reappeared at about days 3 to 5 after HUCDMSCs transfusion. Third, these patients always succumbed to ARDS after day 5 of HUCDMSCs transfusion. Fourth, we also found that a notably increased circulatory number of intrinsic MSCs mobilization into circulation was commonly identified up to 7–10 days after HUCDMSCs transfusion. These findings encouraged us that a second dosage of HUCDMSCs transfusion that would offer an additional benefit should be seriously considered for further improving the clinical outcome in ARDS patients. With this in mind, we will carry out a phase II clinical trial (TFDA number: 202000098A0) in the near future with a designed protocol that a second dosage of HUCDMSCs transfusion will be given to the ARDS patients at the time point of 72 h after the first HUCDMSCs administration. Prior to conducting this phase II clinical trial, we were requested to perform a preclinical study of rat ARDS treated by xenogeneic MSCs (i.e., HUCDMSCs) that mimicked the phase II clinical trial.
Our previous study has shown that one HUCDMSCs therapy notably improved the outcome in ARDS rodent 17 . The most important finding in the present study was that two doses of HUCDMSCs therapy were superior to merely one dose counterpart (i.e., either 3 h early or 24 h late treatment) for attenuating the lung injury score (i.e., preservation of anatomical/architectural integrity) and upregulating the SaO2 % (i.e., preserved the lung functional integrity). Our findings of the present study, in addition to extending the finding of our previous study 17 , strongly support the hypothesis and feasibility of our phase II clinical trial.
Although the result of our previous study of ARDS rodents treated by HUCDMSCs was attractive and promising 17 , the limitation of this study 17 was that the underlying mechanism for the efficacy of this strategic management has not been fully clarified. A principal finding in the present study was that not only the in vitro but also the in vivo studies demonstrated that the upstream and downstream inflammatory signaling (refer to Fig. 13) played a fundamental role in lung epithelial cells and lung ultrastructural/architectural damages, resulting in the setting of ARDS. Additionally, we further identified that the oxidative-cell stress signaling pathway (refer to Fig. 13) also played a crucial role of lung epithelial cell damage and lung organ damage in the ARDS setting. Furthermore, we also found that the circulatory inflammatory cells (i.e., innate inflammatory response) and immune cells (i.e., adapt immune response) were substantially increased, whereas the Treg+ cells in circulation were notably downregulated in ARDS animals. Of distinctive finding was that all of these above-mentioned molecular-cellular perturbations, that is, both of upstream and downstream inflammatory signaling (refer Fig. 13), were remarkably reversed in ARDS animals after receiving HUCDMSCs therapy. In this way, our findings, in addition to strengthening the findings of our previous study 17 , could explain why HUMSCs therapy had promising beneficial effects on protecting the lung parenchymal integrity against ARDS damage, met the demand of TFDA, as well as paved a way for carrying on our phase II clinical trial in the near future.
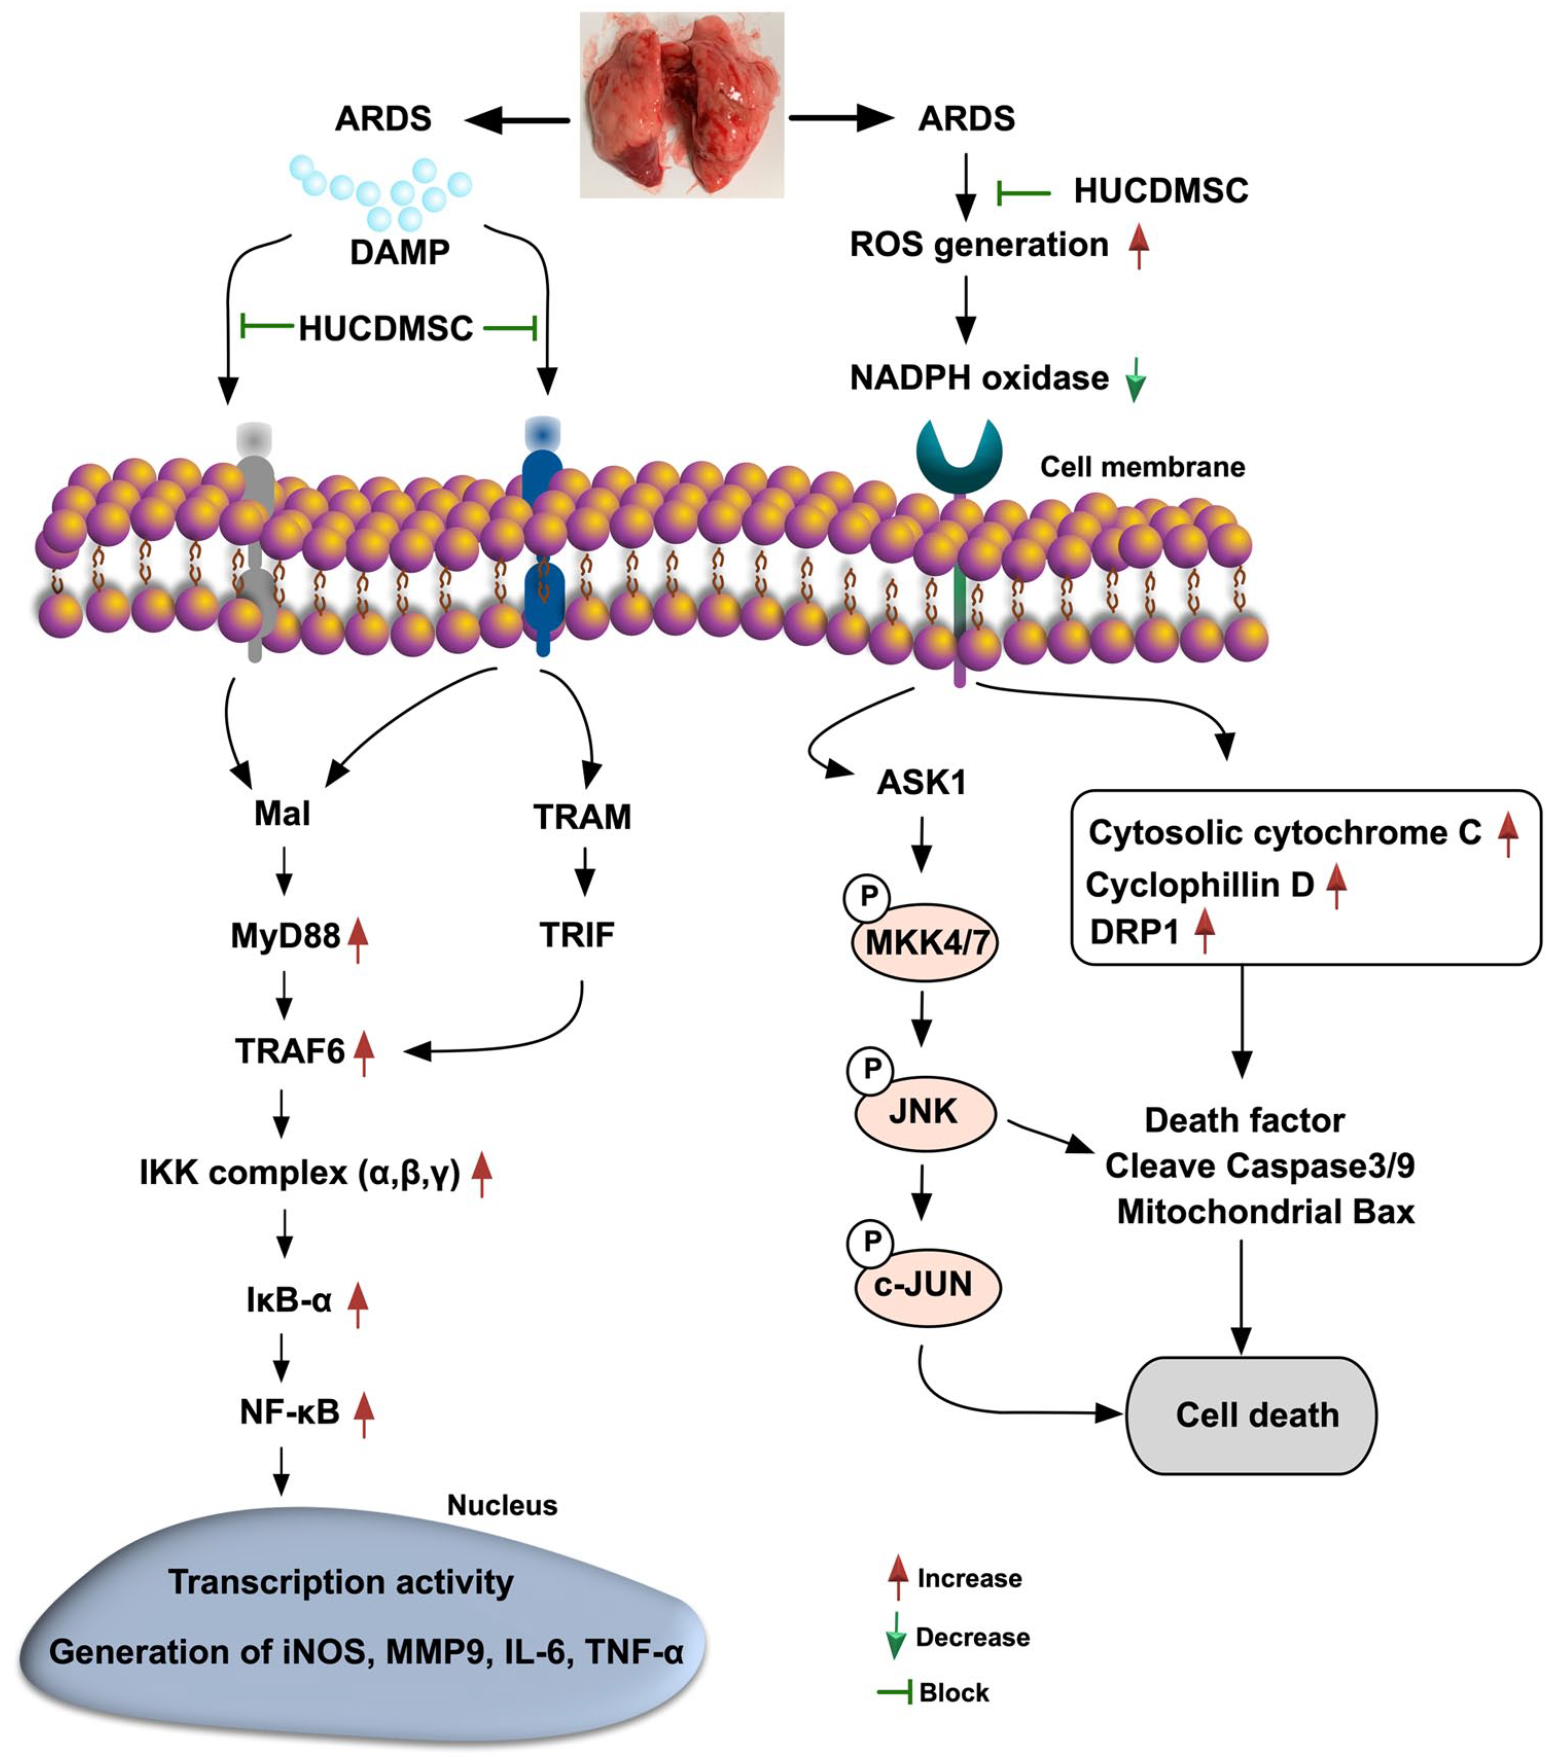
Schematically illustrated the inflammatory, cell-stress and oxidative-stress signaling pathways that participated in the ARDS-induced lung damage. ARDS: acute respiratory distress syndrome; DAMP: damage-associated molecular pattern; HUCDMSC: human umbilical cord–derived mesenchymal stem cells; ROS: reactive oxygen species; TRAF: TNF receptor-associated factor 6; TRAM: translocation-associated membrane protein; TRIF: TIR-domain-containing adapter-inducing interferon-β.
An interesting question raised in the present study was: What was the final (i.e., by day 5 after cell therapy) fate of HUCDMSCs after transfusion? For answering this question, we collected specimens from several major organs, including the lung, brain, liver, heart, and kidney, by the end of the study period. The histopathological findings demonstrated that there was no tumorigenesis in these organs. Additionally, a plenty of HUCDMSCs were identified in the lung parenchyma and some of these cells engaged and integrated into the alveolar walls and alveoli. On the other hand, no HUCDMSC was observed in liver, kidney, heart, and brain. Perhaps, at least two reasons could explain these phenomena. First, a situation of acute inflammation could actively attract the MSCs into the inflammatory region, that is, in ARDS lung parenchyma. Second, the distinctive anatomical feature of the lung organ would prefer to trap a large amount of the HUCDMSCs in lung parenchyma. Finally, the distinctively important finding was that there had not any immune rejection to be observed even in the histopathological microscopic examination of the lung tissues. This could be explained because the MSCs, including HUCDMSCs, have property of immune privilege.
Study Limitations
Although the results of the present study were attractive and promising, our present study has limitations. First, the study period was relatively short (i.e., 7 days, including 48 h for ARDS induction and 5 days after cell therapy). Although the short-term outcomes were favorable, the long-term ones remain uncertain. Second, permanent lung fibrosis and functional impairment are always the two critical issues to be paid close attention to in the setting of ARDS. This study also did not provide any information to address these critical issues because the study period was relatively short.
In conclusion, the results of the present study clearly delineated that there were early and dose-dependent benefits of HUCDMSCs therapy on ARDS animals. Signaling of inflammation and oxidative stress in the damaged lungs of ARDS could be effectively suppressed with xenogeneic HUCDMSCs therapy.
Supplemental Material
sj-jpg-1-cll-10.1177_09636897231190178 – Supplemental material for Early and Dose-Dependent Xenogeneic Mesenchymal Stem Cell Therapy Improved Outcomes in Acute Respiratory Distress Syndrome Rodent Through Ameliorating Inflammation, Oxidative Stress, and Immune Reaction
Supplemental material, sj-jpg-1-cll-10.1177_09636897231190178 for Early and Dose-Dependent Xenogeneic Mesenchymal Stem Cell Therapy Improved Outcomes in Acute Respiratory Distress Syndrome Rodent Through Ameliorating Inflammation, Oxidative Stress, and Immune Reaction by Kun-Chen Lin, Wen-Feng Fang, Pei-Hsun Sung, Kuo-Tung Huang, John Y. Chiang, Yi-Ling Chen, Chi-Ruei Huang, Yi-Chen Li, Mel S. Lee and Hon-Kan Yip in Cell Transplantation
Footnotes
Acknowledgements
We would like to give special thanks to BIONET Corp. Company support in GTP production of HUCDMSCs.
Author Contributions
Kun-Chen Lin, Wen-Feng Fang, Pei-Hsun Sung, Kuo-Tung Huang, Mel S. Lee, and Hon-Kan Yip designed the study. Kun-Chen Lin, Wen-Feng Fang, Pei-Hsun Sung, and Kuo-Tung Huang curated data. Kun-Chen Lin, Pei-Hsun Sung, and Yi-Chen Li did formal analysis. Hon-Kan Yip was responsible for funding acquisition. Kun-Chen Lin, Wen-Feng Fang, Pei-Hsun Sung, Kuo-Tung Huang, Yi-Ling Chen, and Chi-Ruei Huang investigated experiments. Mel S. Lee and Hon-Kan Yip administered and supervised the project. John Y. Chiang, Mel S. Lee, and Hon-Kan Yip wrote the first draft of the manuscript and all named authors contributed in revising the manuscript.
Availability of Data and Materials
The data that support the findings of this study are available from the corresponding authors upon reasonable request.
Ethical Approval
All animal experimental procedures were approved by the Institutional Animal Care and Use Committee at Kaohsiung Chang Gung Memorial Hospital (Affidavit of Approval of Animal Use Protocol No. 2020121609) and performed in accordance with the Guide for the Care and Use of Laboratory Animals, 8th edition (NIH publication No. 85-23, National Academy Press, Washington, DC, USA, revised 2011).
Statement of Human and Animal Rights
This article does not contain any studies with human or animal subjects.
Statement of Informed Consent
There are no human subjects in this article and informed consent is not applicable.
Declaration of Conflicting Interests
The author(s) declared no potential conflicts of interest with respect to the research, authorship, and/or publication of this article.
Funding
The author(s) disclosed receipt of the following financial support for the research, authorship, and/or publication of this article: This study was funded by research grants from the Ministry of Science and Technology, Taiwan, Republic of China (NMRPG8L6151 (1/3), NMRPG8L6152 (2/3), NMRPG8L6153 (3/3); 110-2314-B-182A-112-MY3).
Supplemental Material
Supplemental material for this article is available online.
References
Supplementary Material
Please find the following supplemental material available below.
For Open Access articles published under a Creative Commons License, all supplemental material carries the same license as the article it is associated with.
For non-Open Access articles published, all supplemental material carries a non-exclusive license, and permission requests for re-use of supplemental material or any part of supplemental material shall be sent directly to the copyright owner as specified in the copyright notice associated with the article.