
Abstract
The contribution of lymphocyte subset composition of the graft on the outcomes following haploidentical peripheral blood stem cell transplantation (haploPBSCT) is not fully elucidated. We retrospectively analyzed 314 patients with hematological malignancies who underwent haploPBSCT from 2016 to 2020 in our center. We obtained a cutoff value of CD3+ T cell dose (2.96 × 10⁸/kg) that separated the risk of II–IV acute graft-versus-host disease (aGvHD) and divided patients into the low CD3+ T cell dose group (CD3+ low) and the high CD3+ T cell dose (CD3+ high) group. Significantly higher incidences of I-IV aGvHD, II–IV aGvHD, and III–IV aGvHD were identified in the CD3+ high group (50.8%, 19.8%, and 8.1% in the high group, 23.1%, 6.0%, and 0.9% in the low group, P < 0.0001, P = 0.002, and P = 0.02, respectively). We found that CD4+ T cell and its naïve and memory subpopulations of grafts had a significant impact on aGvHD (P = 0.005, P = 0.018, and P = 0.044). Besides, we found an inferior reconstitution of natural killer (NK) cells in the CD3+ high group than in the low group within the first-year posttransplant (239 cells/μL vs 338 cells/μL, P = 0.0003). No differences in engraftment, chronic GvHD (cGvHD), relapse rate, transplant-related mortality (TRM), and overall survival (OS) were identified between the two groups. In conclusion, our study found that a high CD3+ T cell dose led to a high risk of aGvHD and inferior reconstitution of NK cells in the haploPBSCT setting. In the future, carefully manipulating the composition of lymphocyte subsets of grafts might reduce the risk of aGvHD and improve the transplant outcome.
Keywords
Introduction
Allogeneic hematopoietic stem cell transplantation (HSCT) is a curative modality for most hematological malignancies. Recently, haploidentical HSCT has been widely used and given more chances to patients without matched donors.1,2 However, recipients of haploidentical HSCT have higher risks of primary graft failure and severe GvHD than matched HSCT, which will cause high transplant-related mortality (TRM).1,3
Studies have shown that the T cells in the grafts facilitated the engraftment of donor stem cells, played an important role in the graft-versus-leukemia effect but led to aGvHD and cGVHD at the same time,4–7 which indicated appropriate T cell dose and subset composition in the grafts could help balance the engraftment and GvHD.
To address these issues, we retrospectively analyzed data from a single-center, and studied the impact of CD3+ T cells and lymphocyte subsets of donor grafts on the engraftment, GvHD, and survival of patients.
Methods
Patients and Donors
Three hundred and fourteen patients with hematological malignancies who underwent haploPBSCT from January 2016 to December 2020 in our center were included. They received allografts from their HLA haploidentical-related donors. This study had ethical approval from the local ethical committees and was conducted in accordance with the Declaration of Helsinki. All patients included in the trial signed informed consent.
Conditioning Regimen
Myeloablative conditioning regimen for patients with acute myeloid leukemia (AML) and myelodysplasia syndrome (MDS) consisted of intravenous fludarabine (150 mg/m2) or cladribine (25 mg/m2), cytarabine (5 g/m2–10g/m2), and busulfan (12.8 mg/kg). For patients with acute lymphoblastic leukemia (ALL) and non-Hodgkin lymphoma (NHL), conditioning regimen consisted of intravenous etoposide (20–30 mg/kg), cyclophosphamide (100 mg/kg), and total body irradiation (TBI, 10 Gy). 8
GvHD Prophylaxis
GvHD prophylaxis consisted of intravenous ATG 10 mg/kg before transplantation, cyclosporine (2 mg/kg from day –5), methotrexate (15 mg/m2 on day +1, 10 mg/m2 intravenous on days +3 and +6), and mycophenolate sodium enteric–coated tablets (MPA, 720 mg bid oral from day +1 to +30) in 122 patients. 9 Low-dose ATG 5 mg/kg, low-dose posttransplant cyclophosphamide (50 mg/kg on day +3), cyclosporine (2 mg/kg from day +4), and MPA (720 mg tid from day +4 to +34) were administered in 154 patients, 10 and 38 patients received posttransplant cyclophosphamide (50 mg/kg on day +3 and +4), cyclosporine (2 mg/kg from day +5), and MPA (720 mg tid from day +5) for GvHD prophylaxis.
Definition of Engraftment and Grading of GvHD
Neutrophil engraftment was defined as the first of three consecutive days of achieving a sustained peripheral blood neutrophil count of > 0.5 × 10⁹/L. Platelet engraftment is defined as independence from platelet transfusion for at least 7 days with a platelet count of more than >20 × 109/L. 11 aGvHD and cGvHD were graded according to the modified Glucksberg grading of aGvHD 12 and 2014 National Institutes of Health consensus criteria respectively. 13
Monitoring of CMV and EBV Reactivation
Quantitative real-time polymerase chain reaction (PCR) assays for cytomegalovirus (CMV)-DNA and Epstein-bar virus (EBV)-DNA in peripheral blood were performed once or twice per week. Reactivation of CMV or EBV was defined as the DNA copy number >1× 10³ copies/mL for two consecutive times, or the DNA copy number >5 × 10³ copies/mL in a single test.
Statistical Analysis
The data were analyzed by SPSS version 26.0 (SPSS, Chicago, IL, USA) and R 4.2.2 software program (R Foundation for Statistical Computing, Vienna, Austria). Continuous variables were analyzed by independent t-test and U Mann–Whitney test. The cutoff value of CD3+ T cell dose relating to II-IV aGvHD was obtained by the receiver operating characteristic curve (ROC) analysis, and we adopted II-IV aGvHD within 100 days as the endpoint for this cut-off determination. Cumulative incidences of aGvHD were compared by Cox regression to adjust covariates of patient age and gender, donor age and gender, diagnosis, GvHD prophylaxis, and CD34+ cell dose. Platelet engraftment was calculated with competing risk method, and death before hematopoietic engraftment was a competing event. Lymphocyte subsets counts on different time points (day +30, +60, +120, +180, +270 and +365 posttransplant) were analyzed by multiple linear regression, adjusted covariates of patient age and gender, donor age and gender, GvHD prophylaxis, disease status, CD34+ cell dose, aGvHD, diagnosis, and virus reactivation. A generalized linear mixed model (GLMM) was applied to analyze the overall differences in the immune reconstitution between the two groups within the first year post-HSCT, and data of immune reconstitution on day +30, +60, +120, +180, +270, and +365 posttransplant were collected and analyzed. All the covariates used in multiple linear regression were adjusted in GLMM as well.
Relapse rate, overall survival (OS) and TRM were analyzed with the Kaplan–Meier method, compared with the log-rank test and adjusted by multivariate Cox regression. Covariates of patient’s age and gender, donor’s age, and gender, aGvHD, GvHD prophylaxis, disease status, diagnosis, CD34+ cell dose, hematopoietic cell transplantation comorbidity index (HCT-CI), and virus reactivation were adjusted in Cox regression. All risk factors with P values <0.2 in univariate analysis were included in multivariate analysis. All P values were two-sided and were defined as statistically significant if <0.05.
Results
Patient Characteristics
A total of 314 patients were included. Among them, 127 patients (40.4%, 95%CI: 35.0%–45.9%) developed I-IV aGVHD, and 46 of them (14.6%, 95% CI: 10.7%–18.6%) developed II-IV aGvHD. By using ROC analysis, we obtained a cutoff value of CD3+ T cell dose of grafts 2.96 ×10⁸/kg for II-IV aGVHD. Then we divided all patients into 2 groups: CD3+ low group (<2.96 ×10⁸/kg) and CD3+ high group (≥ 2.96 ×10⁸/kg).
Baseline characteristics of the two groups were shown in Table 1.
Patients’ Baseline Characteristics.

GvHD: graft-versus-host disease; CSA: cyclosporine; MTX: methotrexate; MPA: mycophenolate; ATG: rabbit-anti-human thymocyte globulin; CTX: cyclophosphamide; AML: acute myeloid leukemia; ALL: acute lymphoblastic leukemia; MDS: myelodysplasia syndrome; NHL: non-Hodgkin lymphoma; CR: complete remission; NR: non-complete remission; ECOG: Eastern cooperative oncology group; HCT-CI: hematopoietic cell transplantation comorbidity index.
Correlation of CD3+ T Cells in Grafts and GvHD
A significant difference in the incidence of I-IV aGvHD within 100 days posttransplant was found between the two groups, with 23.1% (95% CI: 15.3%–30.8%, n = 27) in the CD3+ low group vs 50.8% (95% CI: 43.7%–57.8%, n = 100) in the high group (Fig. 1A, P < 0.0001, hazard ratio [HR] = 2.65, 95% CI: 1.73–4.08). Moreover, there were significant differences in incidences of II-IV aGvHD (6.0% vs 19.8%, 95% CI: 1.6%–10.3% vs 14.2%–25.4%) and III-IV aGvHD (0.9% vs 8.1%) between CD3+ low vs high groups (Fig. 1B, P = 0.002, HR = 3.50, 95% CI: 1.56–7.87, Fig. 1C, P = 0.02, HR = 11.1, 95% CI: 1.47–83.3).
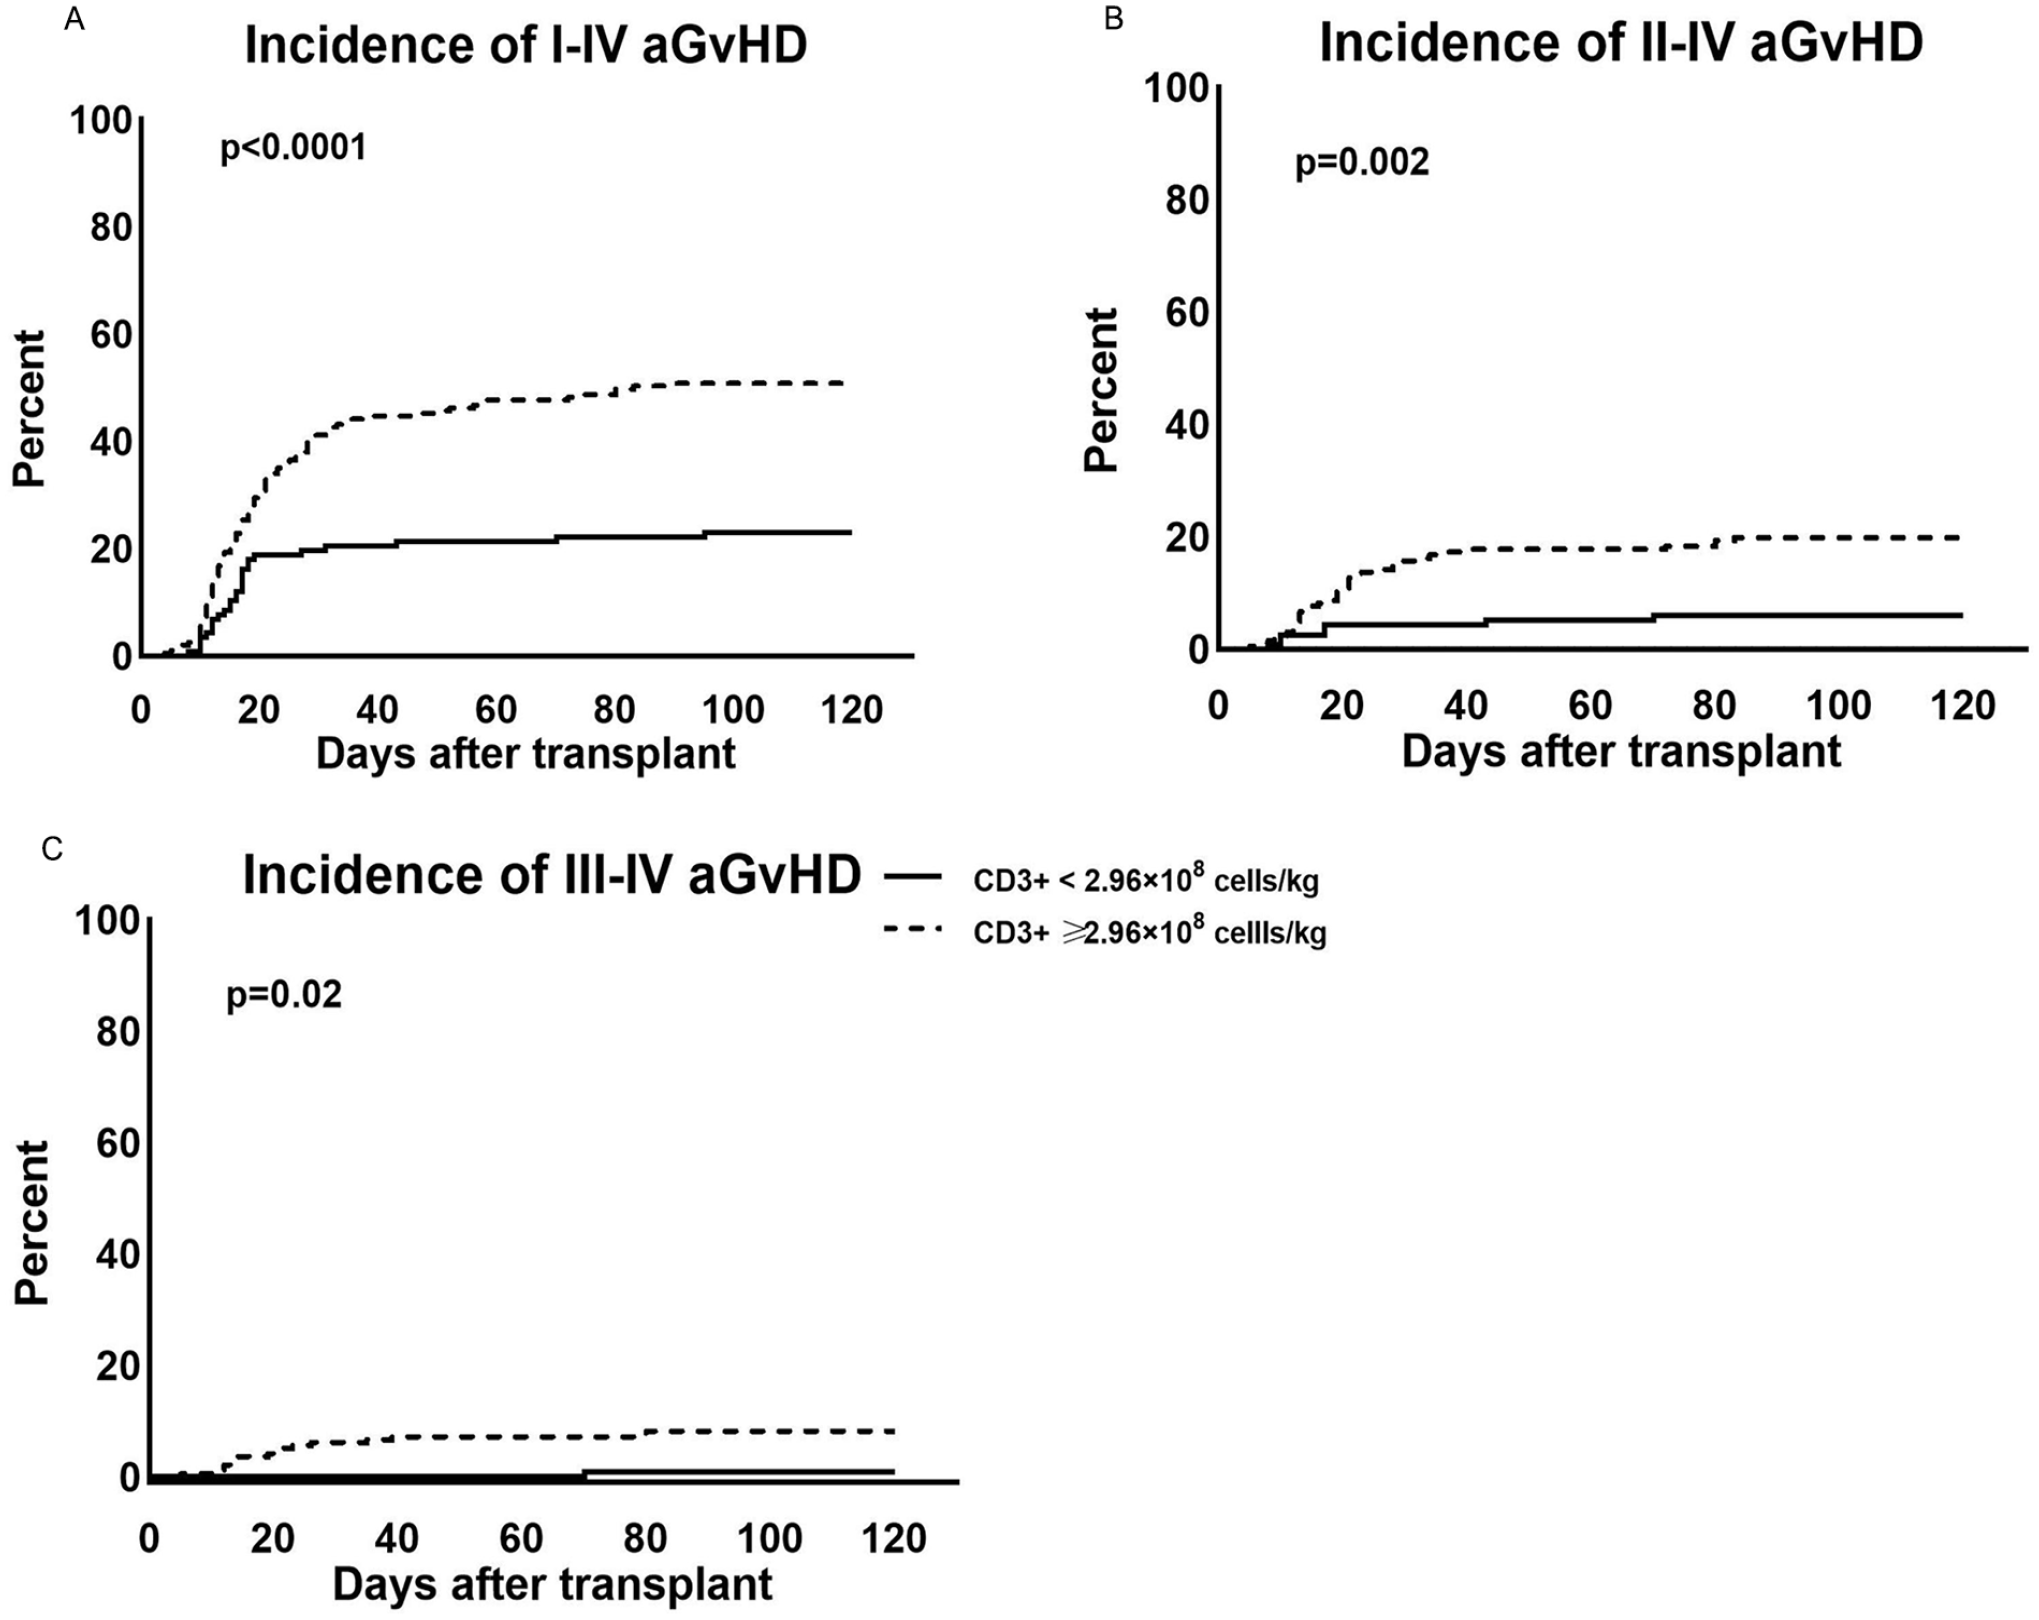
Incidence of aGvHD of the low and high CD3+ T cell dose groups. (A) Incidence of I-IV aGvHD, (B) incidence of II-IV aGvHD, and (C) incidence of III-IV aGvHD.
As for 1-year cGvHD, the incidence was 38.2% (95% CI: 27.9%–48.5%, n = 34) in the CD3+ low group vs 45.0% (95% CI: 36.9%–53.0%, n = 67) in the high group, no difference was identified (P = 0.307).
Then we analyzed the impact of CD3+ T cell dose on aGvHD by each GvHD prophylaxis subgroup. Significant influences of CD3+ T cell dose on aGvHD were found in patients of ATG+CTX prophylaxis group. Incidences of I-IV aGvHD (50.5% vs 18.0%, P = 0.0008) and II-IV aGvHD (22.6% vs 4.9%, P = 0.018) were significantly higher in the CD3+ high group than in the low group. As for patients with ATG+CSA+MTX+MPA prophylaxis, the difference in the incidence of I-IV aGvHD was evident between CD3+ low vs high groups (30.3% vs 53.7%, P = 0.017). However, no significant difference was found in the incidence of II-IV aGvHD (7.5% vs 15.9%, P = 0.189) between them. Additionally, no significant differences in incidences of I-IV aGvHD (25.0% vs 40.9%, respectively, P = 0.076) and II-IV aGvHD (6.3% vs 22.7%, P = 0.307) were identified between CD3+ low vs high groups in patients with CTX+CSA+MPA prophylaxis.
We then compared incidences in aGvHD among the three GvHD prophylaxis groups in patients with CD3+ T cell dose ≥ 2.96 × 10⁸/kg and did not find any significant differences in incidences of I-IV (P = 0.568) and II-IV (P = 0.503) aGvHD among them.
Correlation of Lymphocyte Subsets of Grafts and aGvHD
We investigated the correlation between lymphocyte subsets of grafts and aGvHD. In univariate analysis, the counts of CD3+CD4+ T cells, CD3+CD8+ T cells, and CD19+ B cells (P = 0.002, 0.003, and 0.006, respectively) were all risk factors of aGvHD. In addition, the counts of CD4+CD45RA+ naïve T cells, CD4+CD45RO+ memory T cells, and CD8+CD45RO+ memory T cells were all associated with aGVHD as well (P = 0.035, 0.014, and 0.005 respectively). However, there were no associations between CD4+CD127-CD25+ regulatory T cells, CD16+CD56+ NK cells, and aGvHD (P = 0.615 and 0.619, respectively). The correlations between lymphocyte subsets of grafts and aGvHD were shown in Table 2.
Univariate and Multivariate Analysis of Lymphocyte Subsets of Donor Grafts on aGvHD.

We then did a multivariate analysis of lymphocyte subsets of grafts on aGvHD. The risk factors with P values <0.2 in univariate analysis were included. The counts of CD3+CD4+ T cells were correlated with aGvHD (P = 0.006); however, the counts of CD3+CD8+ T cells and CD19+ B cells were not associated with aGvHD (P = 0.583 and 0.442, respectively). In addition, we found both naïve and memory CD4+ T cells were associated with aGvHD (P = 0.018 and 0.044). However, no impact of naïve and memory CD8+ T cells on aGvHD was found in our study (P = 0.382 and 0.319, Table 2).
Impact of CD3+ T Cell Dose on Engraftment
For neutrophil engraftment, all but 3 patients engrafted successfully within 28 days post-HSCT. There was no difference in CD34+ cells/kg between the two groups (11.14 × 10⁶ cells/kg in the CD3+ low group vs 11.45 × 10⁶ cells/kg in the high group, P = 0.737). The median days to the engraftment of neutrophil was same in the two groups (12 days vs 12 days, P = 0.655). For platelet engraftment, 10 patients failed to engraft within 100 days post-HSCT, and 6 patients died before platelet engraftment. The cumulative incidence of platelet engraftment was 94.0% (n = 110) in the CD3+ low group vs 95.4% (n = 188) in the high group, no difference was identified between the two groups (P = 0.292). Besides, the median days to platelet engraftment was 12 days in the CD3+ low group vs 13 days in the high group.
Impact of CD3+ T Cell Dose on Immune Reconstitution
To investigate immune reconstitution after transplant, we compared the counts of peripheral lymphocyte subsets between patients of the two T cell dose groups by multiple linear regression. The counts of CD3+CD4+ T cell was higher in patients of the CD3+ high group compared with the low group on day +270 (266.7 cells/μL 211.5 vs cells/μL, P = 0.024) and day +365 (Fig. 2A, 329.9 cells/μL vs 272.2 cells/μL, P = 0.040) posttransplant. In addition, there were significant reductions of CD16+CD56+ NK cell counts in patients of the CD3+ high group on day +90 (222.7 cells/μL vs 272.8 cells/μL, P = 0.006) and day +365 (Fig. 2B, 193 cells/μL vs 337 cells/μL, P = 0.042) post-HSCT. However, no differences in the reconstitution of CD3+CD8+ T cells and CD19+ B cells were found at all posttransplant time points (Fig. 2C and D).

Comparison of immune reconstitution of patients between the low CD3+ T cell dose group and high CD3+ T cell dose group within the first year post-PBSCT. Median lymphocyte subset counts on day +30, +60, +90, +120, +180, +270, and +365 post-PBSCT were shown. (A) CD3+CD4+ T cells of patients, (B) NK cells of patients (C) CD3+CD8+ T cells of patients, and (D) CD19+ B cells of patients.
To further clarify the overall impact of the CD3+ T cell dose of grafts on immune reconstitution, we conducted a GLMM analysis and found there were no significant differences in the reconstitution of CD3+CD4+ T cells (Fig. 2A, P = 0.468), CD3+CD8+ T cells (Fig 2C, P = 0.131), and CD19+ B cells (Fig 2D, P = 0.524) between the two groups. However, we still found a significant reduction in the reconstitution of NK cells (Table 3 and Fig. 2B, 239 cells/μL vs 338 cells/μL, P = 0.001) in patients of the CD3+ high group. In addition, we found no aGvHD, GvHD prophylaxis with ATG+CSA+MTX+MPA and male donor were all benefits to the reconstitution of NK by multivariate analysis (Table 3). Besides, we analyzed the counts of NK in donor grafts, and we found the median counts of NK were higher in the CD3+ high group than in the low group (647 cells/μL vs 476 cells/μL, P = 0.034).
Multivariate Analysis of the Factors Relating to NK Cell Reconstitution Within the First Year Post-HSCT.

GvHD: graft-versus-host disease; CSA: cyclosporine; MTX: methotrexate; MPA: mycophenolate; ATG: rabbit-anti-human thymocyte globulin; CTX: cyclophosphamide.
We then conducted the GLMM analysis to illustrate the impact of CD3+ T cell dose on the 1-year immune reconstitution in patients of each GvHD prophylaxis subgroup. For patients with ATG+CTX prophylaxis, no differences were found in the reconstitution of CD3+CD4+ T cells (P = 0.139), CD3+CD8+ T cells (P = 0.110), CD19+ B cells (P = 0.156), and CD56+ NK cells (P = 0.073) between CD3+ low vs high groups. For patients with ATG+CSA+MTX+MPA prophylaxis, no impact of CD3+ T cell dose was found on the reconstitution of CD3+CD4+ T cells (P = 0.410), CD3+CD8+ T cells (P = 0.144), and CD19+ B cells (P = 0.668). However, a significant difference was observed in the reconstitution of NK cells between CD3+ low vs high groups (475 cells/μL vs 274 cells/μL, P = 0.012). For patients with CTX+CSA+MPA prophylaxis, no impact of CD3+ T cell dose was found on the reconstitution of CD3+CD4+ T cells (P = 0.422), CD19+ B cells (P = 0.607), and NK cells (P = 0.452). However, the reconstitution of CD3+CD8+ T cells in the CD3+ low group was significantly higher than in the high group (915 cells/μL vs 825 cells/μL, P = 0.001).
By conducting GLMM analysis, we found significantly lower counts of CD3+CD4+ T cells posttransplant in patients with ATG+CSA+MTX+MPA prophylaxis than that in patients with ATG+CTX prophylaxis (161 cells/μL vs 180 cells/μL, P = 0.008) or CTX+CSA+MPA prophylaxis (161 cells/μL vs 227 cells/μL, P = 0.004). In addition, the reconstitution of CD3+CD8+ T cells was found significantly higher in patients with ATG+CTX prophylaxis than in patients with CTX+CSA+MPA prophylaxis (869 cells/μL vs 669 cells/μL, P = 0.025). Besides, the reconstitution of CD4+ T cells was significantly higher in patients with myeloid diseases than in patients with lymphoid diseases (197 cells/μL vs 161 cells/μL, P = 0.011).
CMV and EBV Reactivation
The EBV and CMV reactivation rate within 100 days post-HSCT were 47.4% (95% CI: 41.7%–53.0%, n = 143) and 50.3% (95% CI: 44.7%–56.0%, n = 153), respectively. No differences in EBV and CMV reactivation rates were found between the two groups. The incidence of EBV reactivation was 46.4% (95% CI: 37.0%–55.8%, n = 52) vs 47.9% (95% CI: 40.7%–55.1%, n = 91) in the CD3+ low group vs high group (P = 0.805). For CMV reactivation, the incidence was 47.3% (95% CI: 37.9%–56.7%, n = 53) in the CD3+ low group and 52.1% (95% CI: 45.0%–59.2%, n = 100) in the high group (P = 0.423).
Relapse
After a median follow-up of 17 months (1–68 months), a total of 48 patients had disease relapse. The 3-year relapse rate was 25.6% (95% CI: 16.4%–34.7%, n = 23) in the CD3+ low vs 16.5% (95% CI: 10.5%–22.4%, n = 25) in the high group, with no statistical significance (Fig. 3A, P = 0.170, HR = 1.49, 95% CI: 0.84–2.64). Besides, a significant difference in the 3-year relapse rate was identified between patients of CR and NR groups (15.5% vs 30.3, P = 0.008).

Outcomes of patients of low CD3+ T cell dose group and high CD3+ T cell dose group. (A) relapse rate, (B) transplant-related mortality, and (C) overall survival.
TRM and OS
At the end of the follow-up, 90 patients died, and 52 of them died of TRM. The 3-year TRM was 20.9% (95% CI: 13.2%–28.6%, n = 23) in the CD3+ low group and 17.1% (95% CI: 11.3%–22.8%, n = 29) in the high group, and there was no difference between the two groups (Fig. 3B, P = 0.283).
The estimated 3-year OS of CD3+ low group vs high group was 64.8% (95% CI: 56.0%–73.4%, n = 77) and 70.4% (95% CI: 64.1%–76.9%, n = 141), and there was no difference between the two groups (Fig. 3C, P = 0.324). In addition, a significant difference in 3-year OS was found between patients of CR and NR groups (71.8% vs 58.9%, P = 0.024).
Discussion
Our study analyzed the impact of lymphocyte subsets of donor grafts on the outcome of 314 recipients who underwent haploPBSCT with a megadose of CD34+ stem cells. We found significantly higher incidences of aGvHD and inferior reconstitution of NK cells in patients of the CD3+ T cell dose ≥2.96 × 10⁸/kg group than in the CD3+ T cell dose <2.96×10⁸/kg group. In addition, the counts of CD3+CD4+ T cells, CD4+CD45RA+ naïve T cells, and CD4+CD45RO+ memory T cells in donor grafts were all correlated with aGvHD. However, there were no significant differences in the incidence of engraftment, cGvHD, relapse rate, TRM, and OS between the two CD3+ T cell dose groups.
The donor T cell is the major effector cell in aGvHD.14,15 Previous studies on the influence of donor CD3+ T cells on aGvHD were controversial. A study by European Society for Blood and Marrow Transplantation (EBMT) showed that in a matched unrelated donor PBSCT setting, CD3+ T cell dose > 3.5×10⁸/kg led to an increased risk of severe aGvHD. 16 In contrast, Farhan et al 17 showed no impact of CD3+ T cell dose on aGvHD, but an inferior OS with higher CD3+ T cell dose in the setting of HLA-matched peripheral blood or bone marrow HSCT. A retrospective study by The Center for International Blood and Marrow Transplant Research based on 2736 HLA-matched PBSCT failed to show a correlation between CD3+ T cell dose and aGvHD in multivariate analysis, though univariate analysis showed an impact of CD3+ T cell dose on aGvHD. 18 Besides, Cao et al 19 failed to show an impact of CD3+ T cell dose on aGvHD in a matched related PBSCT setting as well. In contrast, in a study based on the haploPBSCT setting, Dong et al 20 showed a higher CD3+ T cell dose was not correlated with higher incidences in II-IV and III-IV aGvHD. However, our study showed that CD3+ T cell dose ≥ 2.96×10⁸/kg was correlated with an increased risk of aGvHD, but not cGvHD. The difference between our study and Dong et al’s may be attributed to the discrepancy between the median CD3+ T cell dose (3.37×10⁸ /kg vs 1.77×10⁸ /kg), and the impact of CD3+T cell dose on GvHD in the haploPBSCT setting needs further study.
We found only CD4+ T cell and its naïve and memory subpopulations were correlated to aGvHD by multivariate analysis. The role of CD4+ and CD8+ T cells in aGvHD has been elucidated before.14,21 In haploHSCT, CD4+ and CD8+ T cells in donor grafts interact with the antigen-presenting cells that express host HLA and lead to aGvHD in different manners. However, the role of naïve and memory T cells in aGvHD remains unclear. 14 Analysis by Reshef et al 22 in an HLA-matched PBSCT setting identified a weak association between higher CD4+ T cell dose and aGvHD, but no impact of CD8+ T cell dose on aGvHD. A Study by Cao et al 19 found that CD4+ and CD8+ T cells were not associated with aGvHD in an HLA-matched PBSCT setting. In contrast, in the study by Mohty et al 23 based on 57 patients of reduced-intensity conditioning HLA-matched PBSCT, a higher CD8+T cell dose was found to be the only predictor of severe aGvHD. In addition, Shen et al 24 found that higher CD8+ T cell dose and CD3+/CD14+ cells ratio were both predictors of III-IV aGvHD in the haploHSCT setting. Our study showed that naïve and memory CD4+ T cells were the major T cell subsets related to aGvHD.
As for engraftment, our study showed no differences in neutrophil and platelet engraftment between the two CD3+ dose groups. A study by EBMT showed no relationship between CD3+ cell dose and engraftment, 16 However, Farhan et al 17 found that less CD3+ cell dose was associated with faster platelet engraftment but slower neutrophil engraftment, and the mechanism needs further investigation.
Immune reconstitution plays an important role in the outcome of HSCT, since post-transplantation infection leads to high morbidity and mortality.25,26 NK cells are the first to recover in lymphocyte subsets, it usually reaches a normal level within 1–4 months.25–28 In the present study, we found significantly lower counts of NK cells in patients of the CD3+ high group, which might be attributed to the higher incidence of aGvHD. Indeed, our study showed the counts of NK cells were significantly lower after transplant in patients with I-IV aGvHD by multivariate analysis, and this result was similar to the studies of Ullrich et al 29 and Jang et al. 30
There were no significant differences in relapse rate, TRM and OS between the two groups in our study. The study by Farhan et al 17 showed higher CD3+ dose was related to inferior OS in the HLA-matched transplantation. However, in the study conducted by Dong et al, 20 higher CD3+ cell dose was related to lower TRM, better leukemia-free survival and better OS in the haploPBSCT setting. In our study, we found a slightly higher relapse rate in the CD3+ low group, but there was no statistical significance. We speculated that the limited sample of our study might be the reason. As for TRM, though a significantly higher incidence of overall aGvHD was observed in the CD3+ high group, the incidences of II-IV aGvHD and III-IV aGvHD were low, and only 5 patients died of III-IV aGvHD in our study. Therefore, it was reasonable that the TRM between the two groups was similar.
In conclusion, our study showed in the haploidentical PBSCT setting, CD3+ T cell ≥ 2.96 × 10⁸/kg in grafts led to an increased risk of aGvHD and inferior reconstitution of NK cells but a similar incidence of engraftment, cGvHD, relapse rate, TRM, and OS. In the future, carefully manipulating the composition of lymphocyte subsets of grafts might reduce the risk of severe aGvHD and improve the OS after haploidentical stem cell transplantation.
Footnotes
Ethical Approval
This study was approved by Clinical Research Ethics Committee of Shanghai, China.
Statement of Human and Animal Rights
All procedures in this study were conducted in accordance with the Shanghai Municipal Clinical Research Ethics Committee approved protocols.
Statement of Informed Consent
Written informed consent was obtained from the patients for their anonymized information to be published in this article.
Declaration of Conflicting Interests
The author(s) declared no potential conflicts of interest with respect to the research, authorship, and/or publication of this article.
Funding
The author(s) disclosed receipt of the following financial support for the research, authorship, and/or publication of this article: This work was supported by the Clinical Research Plan of Shanghai Shen Kang Hospital Development Center (grant no. SHDC2020CR3028B, SHDC2020CR1012B, 16CR1009A, 16CR1010A, and SHDC12018X09), Clinical Research Innovation Plan of Shanghai General Hospital (grant no. CTCCR2018B02, CTCCR2018BP03, CTCCR2019B03 and CTCCR2019D02), Shanghai Municipal Health and Family Planning Commission (grant no. 201840043), and National Clinical Research Center for Hematologic Disease (grant no. 2020ZKPC02).