
Abstract
Acute lung injury (ALI) is a serious complication in clinical settings. This study aimed to elucidate the immune molecular mechanisms underlying ALI by bioinformatics analysis. Human ALI and six ALI mouse model datasets were collected. Immune cell infiltration between the ALI samples and non-ALI controls was estimated using the ssGSEA algorithm. Least absolute shrinkage and selection operator (LASSO) regression analysis and Wilcoxon test were performed to obtain the significantly different immune cell infiltration types. Immune feature genes were screened by differential analysis and the weighted correlation network analysis (WGCNA) algorithm. Functional enrichment was then performed and candidate hub biomarkers were identified. Finally, the receiver operator characteristic curve (ROC) analysis was used to predict their diagnostic performances. Three significantly different immune cell types (B cells, CD4 T cells, and CD8 T cells) were identified between the ALI samples and controls. A total of 13 immune feature genes were obtained by WGCNA and differential analysis and found to be significantly associated with immune functions and lung diseases. Four hub genes, including CD180, CD4, CD74, and MCL1 were identified using cytoHubba and were shown to have good specificity and sensitivity for the diagnosis of ALI. Correlation analysis suggested that CD4 was positively associated with T cells, whereas MCL1 was negatively correlated with B and T cells. We found that CD180, CD4, CD74, and MCL1 can serve as specific immune biomarkers for ALI. MCL1–B cell, MCL1–T cell, and CD4–T cell axes may be involved in the progression of ALI.
Introduction
Acute lung injury (ALI) is a serious complication in clinical settings, characterized by increased pulmonary vascular permeability, progressing further to acute respiratory distress syndrome (ARDS)1,2. Among critically ill patients, ALI is a frequent cause of respiratory failure and most often occurs in the clinical backdrop of sepsis, pneumonia, gastric content aspiration, or severe trauma 1 . Despite some clinical improvement, ALI is associated with high morbidity and mortality 3 . In the last 2 years, morbidity and mortality due to ARDS have been on the rise due to the COVID-19 epidemic. Mortality among patients with ARDS accompanied by COVID-19 infection in the intensive care unit (ICU) ranges from 26% to 61.5%; in particular, mortality in patients receiving mechanical ventilation ranges from 65.7% to 94% 4 . The complex pathophysiological profile of ALI/ARDS provides a wide range of targets, and thus, many therapeutic options are available 5 . However, despite extensive research on the pathophysiology and treatment of ALI/ARDS, no effective drug therapy is known 6 . The currently employed treatment strategy includes mechanical ventilation and conservative fluid management. Thus, it is crucial to study the pathogenesis of ARDS and identify specific biomarkers.
ALI is now considered an acute inflammatory disease leading to disruption of the lung endothelial and epithelial barriers. Severe lung infections lead to the recognition of proinflammatory immune response pathogens by the immune system, resulting in ALI7,8. Although lung leukocytes are the typical inflammatory cell types, they are not the only cells with defense and immune functions. The combined action of multiple immune cells regulates the immune microenvironment of the lung9,10. Evidence suggests that cell communication in the lungs plays important functions in the onset and progression of ALI, whereby the interactions between inflammatory cells are actively involved in the immune response regulation in the lungs11,12, including neutrophils 13 , macrophages 14 , and B cells 15 . However, the immune mechanisms underlying ALI have not yet been thoroughly assessed. Thus, there is a need for systematic assessment of the role of immune cells and investigations on their associated hub genes.
Advances and widespread use of high-throughput sequencing technologies and microarrays have allowed the use of bioinformatics to comprehend complex changes in disease and to obtain novel biomarkers for many disorders 16 . Immune cell infiltration exerts crucial effects in the pathogenesis of several disorders, including nontumor and tumor diseases17,18. Cell type identification is used for various diseases, and mature cell markers can be utilized to estimate the relative infiltration abundances of different immune cell types by transcriptome analysis 19 . Based on previously published mature cell markers, a systematic examination of immune cell infiltration in ALI samples was performed.
We analyzed the immune cell infiltration in human ALI dataset. Subsequently, least absolute shrinkage and selection operator (LASSO) regression and Wilcoxon test were performed to obtain the significantly different infiltrating immune cell types between ALI samples and non-ALI tissues. In addition, immune feature genes were identified by differential analysis and weighted correlation network analysis (WGCNA), and gene functions were determined by Kyoto Encyclopedia of Genes and Genomes (KEGG) enrichment, Disease Ontology (DO), and Gene Ontology (GO) annotation analyses. Furthermore, a protein–protein interaction (PPI) network of immune feature genes was constructed and hub genes were identified using the cytoHubba plugin. Moreover, the diagnostic performances of hub genes were analyzed using receiver operator characteristic (ROC) curves and validated in two external independent datasets. The correlations between biomarkers and significantly different immune cell infiltrate were analyzed using the Spearman rank correlation package in R software. We systematically analyzed the infiltration of immune cells in injured lung tissues. In addition, we identified new and valid diagnostic biomarkers for ALI. The findings of this study are expected to provide a novel approach for the precise diagnosis and targeted therapy of ALI.
Materials and Methods
Dataset Acquisition From the Gene Expression Omnibus Database
The human ALI dataset was extracted from GSE10474 based on the GPL571 platform, which included 13 ALI tissues with sepsis and 21 non-ALI lung tissues with sepsis (controls). Due to the lack of a large-scale validated ALI sequencing dataset in humans, we selected the ALI mouse model data as the external validation dataset. Subsequently, we used lipopolysaccharide (LPS) in the airways of mice to construct the ALI model. A total of six eligible mouse ALI microarray datasets were obtained, including GSE102016, GSE2411, GSE16409, GSE104214, GSE17355, and GSE18341. Details of these datasets (GEO ID, platform information, and the number of samples) are summarized in Table 1.
Six Eligible Mouse ALI Microarray Dataset.

ALI: acute lung injury; LPS: lipopolysaccharide.
Data Processing
The raw data from all microarray datasets were first processed using the R package “affy.” The extracted probe expression data were subjected to robust multiarray normalization. Next, the probe expression data were transformed into gene expression matrices using the probe annotation files from the corresponding platforms. We then merged the external validation datasets using the R package “sva” and excluded the possibility of batch effects. GSE102016, GSE18341, and GSE2411 from the affy platform were merged to form external validation dataset 1, containing a total of 18 LPS samples and 17 normal controls. GSE104214, GSE16409, and GSE17355 from other different platforms were merged into external validation dataset 2, comprising 29 LPS samples and 12 normal controls. Box plots and principal component analysis (PCA) suggested a reduced batch effect between samples after correction (Suppl. Fig. S1). Finally, log2 transformation was performed for all data for subsequent analyses.
Assessment of Immune Cell Infiltration
We collected the gene markers for 21 immune cells from Bindea et al. 19 Subsequently, in each sample, the enrichment scores of 21 immune cell types were assessed using the ssGSEA algorithm using the R package “gsva.” To assess the correlations between immune cell subpopulations, Spearman’s correlation was used. In addition, the LASSO regression algorithm and Wilcoxon rank-sum test were used to obtain the subpopulations of immune cell infiltrates that differed significantly between ALI samples and controls. Furthermore, the immune, stromal, and ESTIMATE scores for all the samples were computed using the Estimate algorithm for quantifying their immune activities. Finally, the results of immune infiltration were analyzed and visualized using “corplot,” “ggplot2,” and “glmnet” packages in R.
Screening the Immune Feature Genes
First, the R package “limma” was used to obtain differentially expressed genes (DEGs) between ALI samples and healthy controls. To prevent omission, a threshold of P < 0.05 was used to identify the significant DEGs. To identify the immune-related genes (IRGs) associated with immune infiltration, we used the R package “WGCNA” to construct a scale-free coexpression network based on gene expression profiles and Estimate algorithm results. A suitable soft threshold of β = 14 was chosen to ensure that the network showed a scale-free topology. A total of 17 nongray modules with deep split = 2, min module size = 30, and height = 0.25 were obtained by a dynamic shear tree using the hierarchical clustering method. Genes from the modules that most positively correlated with the immune and ESTIMATE scores and negatively correlated with stromal scores were identified as the candidate IRGs. KEGG enrichment, DO, and GO annotation analyses were performed for DEGs and IRGs, using the R package “clusterProfiler.” Finally, we obtained the final immune feature genes from the intersection of significant DEGs and candidate IRGs.
Screening Hub Genes
The STRING database (http://string-db.org) was used to predict the interactions of proteins encoded by immune feature genes and construct a PPI network. Specifically, this PPI network was generated by setting the confidence score to 0.4. After downloading the network data from the STRING database, the PPI network was visualized and analyzed using the Cytoscape software (version: 3.7.1). Finally, the top five most important hub genes were identified using the cytoHubba plugin of Cytoscape.
Diagnostic and Correlational Analyses of Hub Genes
We first assessed the expression of hub genes in the ALI and non-ALI samples. Subsequently, ROC analysis was performed using the R package “pROC” to determine the predictive accuracy of the hub genes for ALI. The diagnostic performances of hub genes were validated in two external validation datasets. Finally, the associations between identified immune feature markers and infiltrating immune cells were assessed by computing Spearman’s correlation coefficient.
Identification of Transcription Factors and miRNAs Regulating Hub Genes
The Enrichr database (https://maayanlab.cloud/Enrichr/) was used to predict transcription factors (TFs) and microRNAs (miRNAs) that could regulate the hub genes. TF and hub gene interactions were predicted using two algorithms, TRANSFAC and JASPAR. The miRNA–mRNA interactions were predicted using mirTarBase in Enrichr. TFs and miRNAs with P <0.05 were selected as target molecules for the regulation of hub genes. Finally, based on the integrated prediction results, a TF/mRNA/miRNA regulatory network of hub genes was constructed using Cytoscape.
Relationship Between Hub Genes and Lung Diseases
The comparative toxicogenomics database (CTD) (http://ctdbase.org/) was used to identify gene–disease interactions. The relationships between hub genes and common lung diseases and pathological alterations in lung injury were analyzed using the CTD database.
Results
Immune Cell Infiltration in ALI Samples and Normal Controls
The ssGSEA was performed using the human ALI dataset to assess the infiltration abundances of immune cells. The heat map shows the patterns of immune cell infiltration in this dataset, and the immune cells in each sample represent the normalized absolute abundance (Fig. 1A). Subsequently, we evaluated the correlation between 21 immune cells (Fig. 1B). B cells were positively correlated to Th1 cells; T cells to immature dendritic cells (iDCs) and natural killer (NK) cells, and macrophages to Th2 cells. Furthermore, using two different algorithms, Wilcoxon test, and LASSO regression, we identified the significantly different immune cell infiltrates between ALI samples and controls. The LASSO results are shown in Fig. 1C. A total of 12 immune cells were selected based on the best lambda value. The box plot shows the results of the Wilcoxon test (Fig. 1D), which suggested that three immune cells showed a significantly different infiltration (P < 0.05). Moreover, we extracted commonly intersected three cell types between the two methods (Fig. 1E). The infiltration levels of B cells, T cells, and macrophages were significantly higher in ALI samples compared with those in normal controls.

Immune cell infiltration in ALI samples and healthy controls. (A) Heat map showing the relative abundances of 21 immune cells in each sample; (B) heat map showing the correlations between 21 immune cells in patients with ALI; (C) 12 differentially expressed immune cells identified by LASSO regression; (D) three differentially expressed immune cells identified by Wilcoxon test. *P < 0.05, **P < 0.01; (E) Venn diagram showing three common differentially expressed immune cells identified using LASSO regression and Wilcoxon algorithms. aDC: activated DC; ALI: acute lung injury; DC: dendritic cells; iDC: immature DC; LASSO: least absolute shrinkage and selection operator; pDC: plasmacytoid DC; Tcm: central memory T cells; Tem: effector memory T cells; TFH: T follicular helper cells; Tgd: gamma delta T cells.
Identification of IRGs and DEGs
The immune activities of the samples were first assessed using the Estimate algorithm. Both ESTIMATE and immune scores were significantly higher in ALI samples compared with those in controls (Fig. 2A). To identify the genes potentially associated with immune cell infiltration, a coexpression network was constructed based on the Estimate results and gene expression profiles. Hierarchical clustering showed no outlier samples (Suppl. Fig. S2A). Subsequently, a robust coexpression network was constructed using β = 14 as the suitable soft threshold (R2 = 0.94) (Suppl. Fig. S2B). A total of 17 nongray modules were obtained based on a dynamic shear tree using the threshold of 0.25 (Fig. 2B). Among them, the lightcyan module was significantly positively correlated with immune and ESTIMATE scores (R = 0.81, P < 0.001; R = 0.42, P = 0.01) and negatively correlated with the stromal score (R = −0.5, P = 0.003) (Fig. 2C). Genes in the lightcyan module were identified as IRGs. Subsequently, we identified 162 DEGs between ALI samples and controls using the limma package. Among them, 106 were found to be upregulated, while 56 were downregulated in ALI samples (Fig. 2D). Based on the expression profiles of DEGs, PCA could distinguish accurately between ALI samples and controls (Fig. 2E). The heat map shows the expression profile of DEGs (Fig. 2F).

Identification of DEGs and IRGs. (A) Box plots showing the differences in ESTIMATE scores between ALI samples and controls. *P < 0.05, **P < 0.01, ***P < 0.001; (B) 17 merged nongray modules identified by WGCNA test; (C) heat map of the correlation between gene modules and ESTIMATE scores, wherein the most significantly correlated module is marked with red boxes; (D) 162 DEGs identified by differential analysis; (E) PCA based on DEGs to distinguish ALI samples from non-ALI controls; (F) heat map showing the transcriptional profiles of DEGs. ALI: acute lung injury; DEG: differentially expressed genes; IRG: immune-related genes; PCA: principal component analysis; WGCNA: weighted correlation network analysis.
Functional Enrichment Analysis
GO, KEGG, and DO analyses were performed for DEGs and IRGs. The results of the GO analysis suggested that DEGs were associated with oxidative stress, cytoskeleton, and protein transport (Fig. 3A). In addition, IRGs were associated with T-cell activation and proliferation, lymphocyte activation and proliferation, and immune-related signaling pathways (Fig. 3B). Findings from the KEGG analysis suggested that both DEGs and IRGs were associated with immune cell–related pathways such as antigen presentation and Th1, Th2, and Th17 cell differentiation (Fig. 3C, D). The DO analysis showed that both DEGs and IRGs were associated with lung and bronchial diseases. In addition, DEGs were more significantly associated with endocrine, infection, and neoplastic diseases, while IRGs were related to immune diseases (Fig. 3E, F).

Functional enrichment of DEGs and IRGs. (A) GO analysis for DEGs and (B) IRGs; (C) KEGG enrichment analysis for DEGs and (D) IRGs; (E) DO analysis for DEGs and (F) IRGs. DEG: differentially expressed genes; DO: Disease Ontology; GO: Gene Ontology; IRG: immune-related genes; KEGG: Kyoto Encyclopedia of Genes and Genomes.
PPI Network Construction and Identification of Hub Genes
Through the intersection of DEGs and IRGs, 13 immune feature genes (Fig. 4A) were obtained. Next, we submitted these 13 genes to the STRING database, which generated a PPI network of immune feature genes (Fig. 4B). CD4 and CD74 genes formed the core of the PPI network. We then assessed the correlation among the 13 immune feature genes. Myeloid cell leukemia-1 (MCL1) was negatively correlated with 12 other genes, while the other 12 genes were positively correlated to each other (Fig. 4C). In addition, MCL1 showed a low expression, whereas the other 12 genes were highly expressed in ALI samples (Fig. 4D). We then calculated the gene connectivity of the PPI network using the cytoHubba plugin and identified the hub genes of the network. Four genes with the highest connectivity, including CD180, CD4, CD74, and MCL1, were selected as the hub genes that could regulate ALI immunity (Fig. 4E). PCA results suggested that the hub gene–based expression profiles could accurately distinguish the ALI samples from controls (Fig. 4F). Furthermore, the ROC analysis showed that all four hub genes possessed a good diagnostic efficacy [area under the curve (AUC) >0.65] (Fig. 4G).

Identification of hub genes. (A) Venn diagram shows the intersection of DEGs and IRGs, and 13 genes in the intersection are candidate hub genes; (B) construction of the PPI network of 13 hub genes using STRING database; (C) the correlation network of 13 hub genes—red represents positive correlation and blue represents negative correlation; (D) heat map showing the transcriptional profiles of 13 hub genes; (E) the interaction network of four hub gene identified by maximal clique centrality; (F) PCA based on four hub genes to distinguish ALI samples from non-ALI controls; (G) ROC curves for four hub genes. ALI: acute lung injury; AUC: area under the curve; DEG: differentially expressed genes; IRG: immune-related genes; MCL1: myeloid cell leukemia-1; PCA: principal component analysis; PPI: protein–protein interaction; ROC: receiver operator characteristic.
External Validation of Hub Genes
We validated the expression and diagnostic efficiency of hub genes in two external mouse datasets. In validation sets 1 and 2, Cd4 and Cd74 were found to be highly expressed, whereas the levels of MCL1 were low upon LPS induction. However, Cd180 expression was not significantly elevated in the LPS mice (Fig. 5A, B). The heatmap shows the expression patterns of hub genes in the two external validation datasets (Fig. 5C, D). Furthermore, the ROC curves suggested that except for Cd180, other hub genes possessed good diagnostic efficiency (AUC >0.7) in the validation set (Fig. 5E, F).

External validation of hub genes. Box plots showing the expression of hub genes in (A) validation set 1 and (B) validation set 2, *P < 0.05, **P < 0.01, ***P < 0.001; heat map showing the transcriptional profiles of hub genes in (C) validation set 1 and (D) validation set 2; ROC curves for hub genes in (E) validation set 1 and (F) validation set 2. AUC: area under the curve; LPS: lipopolysaccharide; MCL1: myeloid cell leukemia-1; ROC: receiver operator characteristic.
Correlation of Hub Genes With Differentially Expressed Immune Cells in ALI
The correlations of four hub genes (CD180, CD4, CD74, and MCL1) with three differentially expressed immune cells, including B cells, T cells, and macrophages, were evaluated. Fig. 6 shows that MCL1 is negatively correlated with B cells (R = −0.44, P = 0.010) and T cells (R = −0.36, P = 0.035), while the expression of CD4 is positively correlated with T cells (R = 0.42, P = 0.014).
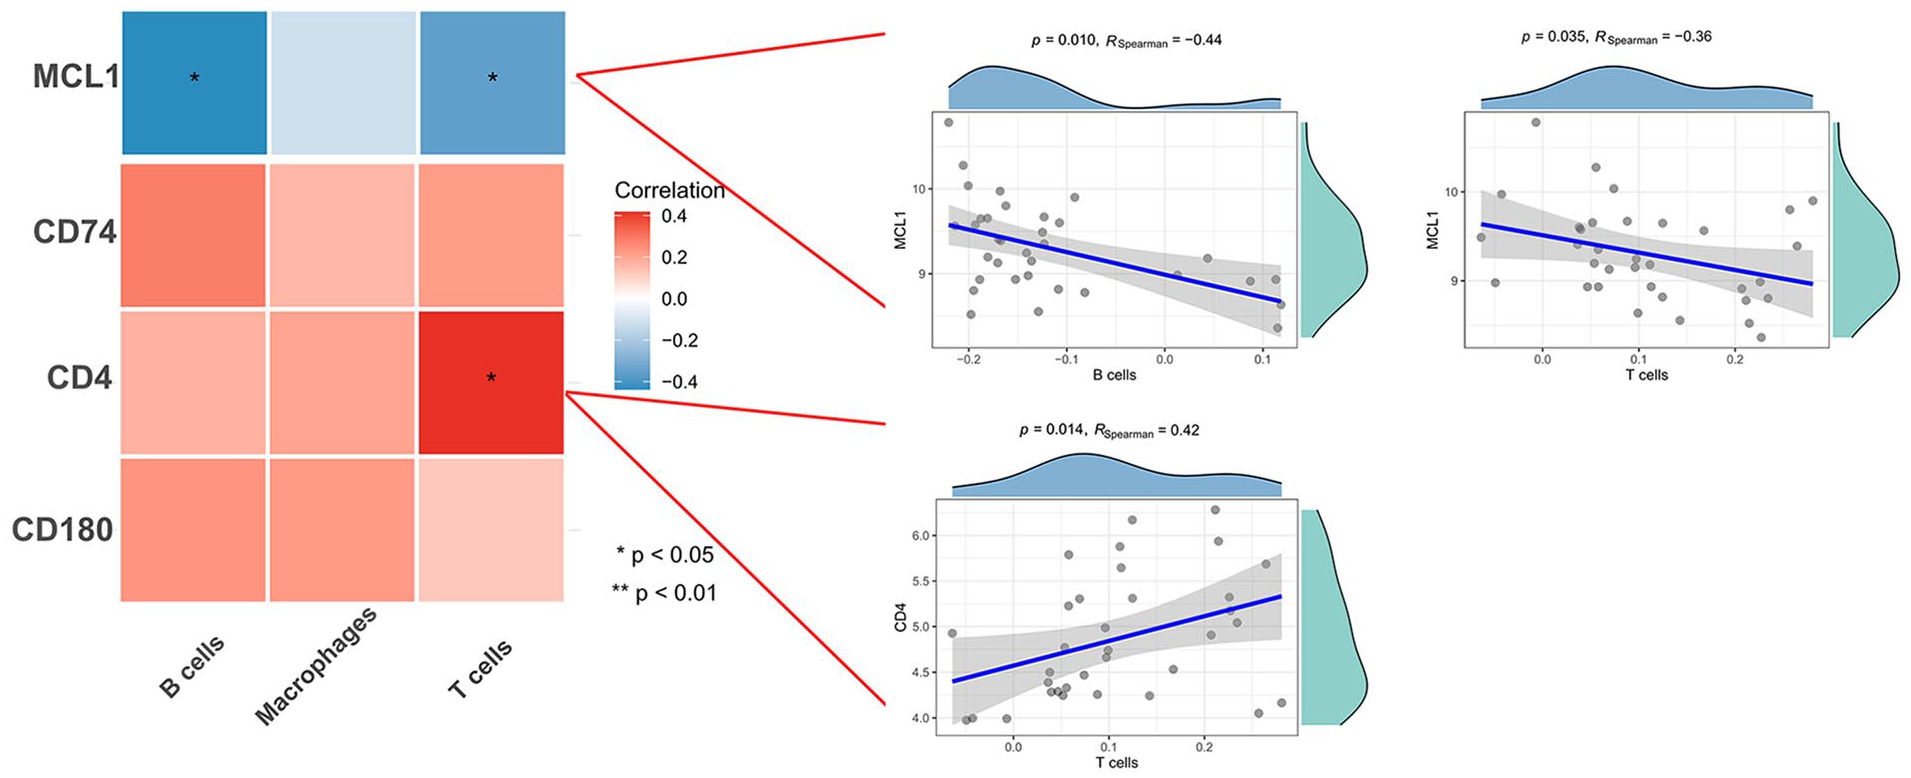
Correlation between hub genes and differentially expressed immune cells. Left panel: correlational heat map. Right panel: significantly correlated hub genes and immune cells. MCL1: myeloid cell leukemia-1.
Construction of a Regulatory Network of Hub Genes in ALI
After constructing the TF/mRNA/miRNA network, the regulatory mechanism underlying the role of the four hub genes in ALI was investigated. The interactions of miRNAs and TFs with hub genes were evaluated based on the Enrichr database. The regulatory network consisted of 4 TFs, 55 miRNAs, and 4 target mRNAs (Fig. 7). Among them, MCL1 was mainly regulated by miRNAs; CD180 and CD4 were regulated by both TFs and miRNAs, and CD74 was mainly under the regulation of TFs.

TF/mRNA/miRNA regulatory network of hub genes, wherein TFs, mRNAs, and miRNAs are represented as v-boxes, ellipses, and diamonds, respectively. mRNA: messenger RNA; miRNA: microRNA; TF: transcription factors.
Correlation Between Hub Genes and Lung Diseases
The interactions between hub genes and common lung diseases and pathological changes in lungs were investigated in the CTD database. As shown in Fig. 8, CD4 was most significantly correlated with pneumonia and pulmonary fibrosis; CD74 was most significantly correlated with ALI and pulmonary fibrosis; MCL1 was correlated with ALI, pulmonary fibrosis, and pulmonary edema; and CD180 showed the highest correlation with pneumonia and pulmonary edema; however, the association was not strong.
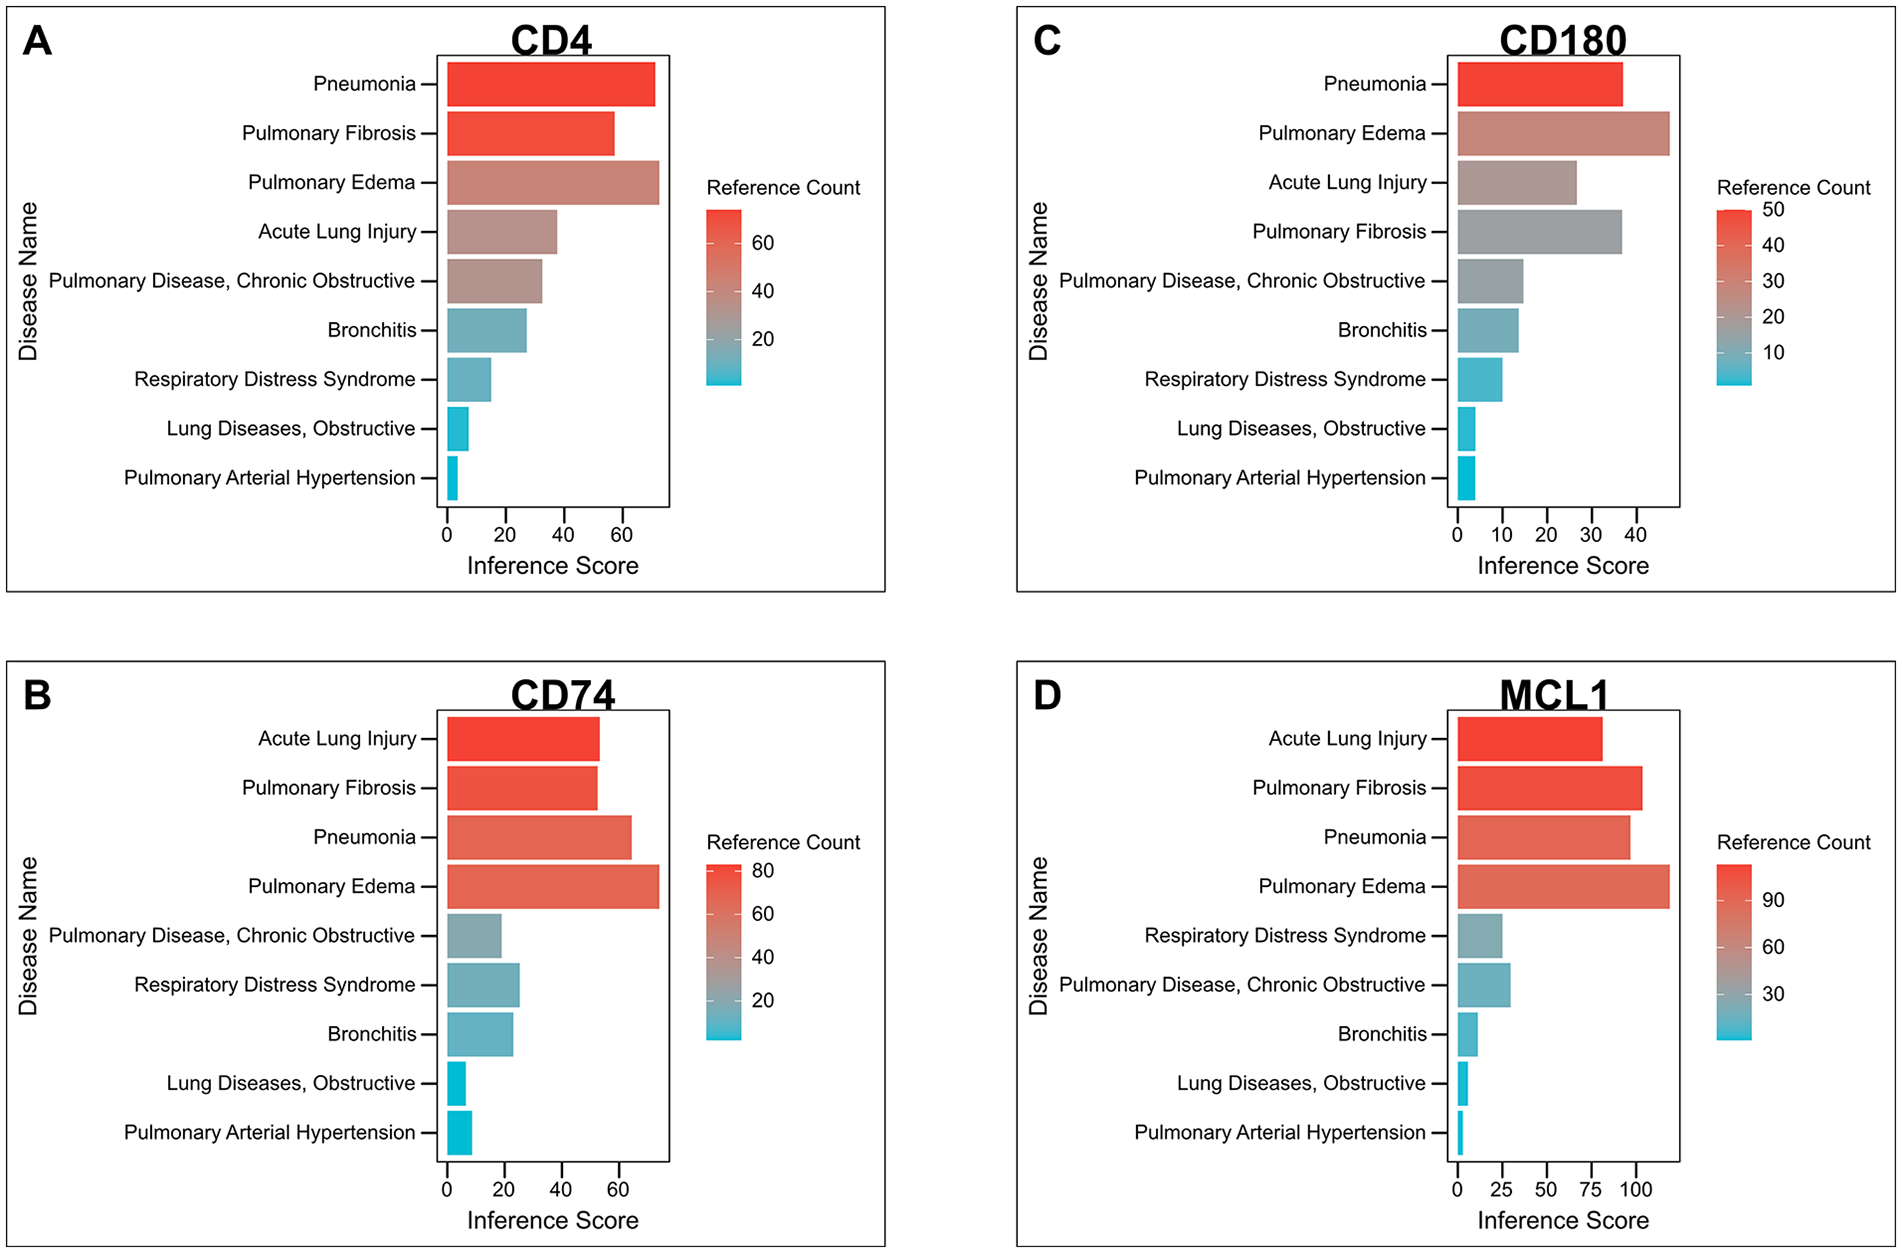
Correlation between hub genes and common lung diseases. (A) CD4, (B) CD74, (C) CD180, and (D) MCL1. MCL1: myeloid cell leukemia-1.
Discussion
ALI is an acute inflammatory disease causing damage to lung endothelial and epithelial barriers. Recognition of proinflammatory pathogens by the innate and adaptive immune system leads to the incidence and progression of ALI7,8. Accumulating evidence suggests that cellular communication among the lung-infiltrating immune cells plays a crucial role in the progression of ALI11,12. Currently, the treatment strategy for ALI predominantly includes mechanical ventilation and conservative fluid management and lacks effective novel agents. Therefore, there is a need to systematically study the immune mechanisms underlying ALI and identify novel and effective biological markers. In this study, we integrated multiple ALI datasets from different platforms. Moreover, a systematic and comprehensive bioinformatic approach was used to evaluate the role of infiltrating immune cells in ALI progression and obtain feasible immune biomarkers for ALI.
Using two algorithms, we observed high infiltration levels of B cells, T cells, and macrophages in ALI. Active innate immunity in the lung causes excessive inflammation, thereby damaging the lung tissues 20 . Recognition by the innate immune system promotes the involvement of B cells 21 . B-cell products, including the autoantibodies against lung cells, cellular components, and extracellular matrix proteins, are also present in the lung. These autoantibodies can form immune complexes leading to lung inflammation and injury in patients with ALI 22 . However, specific subtypes of B cells play regulatory roles 23 and are highly expressed and exert protective effects against ALI 20 . T lymphocytes are essential for maintaining the adaptive immune responses and are involved in the recognition of pathogens and allergens. Although T lymphocytes coordinate and maintain immune memory and self-tolerance, they are also associated with inflammation and autoimmune diseases24,25. In the lung and alveolar space, inflammation is closely associated with macrophages 26 . Several studies confirm that macrophages, including resident alveolar macrophages (AMs) and macrophages recruited from the blood, are key factors in the pathogenesis of ALI/ARDS27,28. Typically, these exert proinflammatory effects in the early stages and exhibit anti-inflammatory properties in the late stages 29 . Thus, our findings are consistent with previously reported results as we confirmed the involvement of B cells, T cells, and macrophages in ALI.
In this study, immune feature genes in ALI were identified by differential analysis and a coexpression network. Four hub genes, including CD180, CD4, CD74, and MCL1, were identified based on the PPI network and validated in two integrated external datasets. CD180, CD4, and CD74 were highly expressed in ALI samples relative to healthy controls, whereas MCL1 was highly expressed in healthy controls. The ROC analysis further showed that except for CD180, all three, namely CD4, CD74, and MCL1, had good diagnostic specificity and sensitivity for ALI. CD4 encodes the CD4 membrane glycoprotein of T lymphocytes 30 . In addition, the expression of CD4 defines a subtype of T cells, helper T cells, which have an important function in immune protection 31 . They help B cells produce antibodies, induce microbicidal activity in macrophages, and modulate the immune response of other lymphocytes 32 . CD4 T cells play an important role in the host defense of the lung and are abundantly recruited upon lung infection, thus enhancing the inflammatory responses 33 . Our results suggested that CD4 was highly expressed in ALI tissues and may be involved in the inflammatory processes in ALI. CD74 is an integral membrane protein and functions as a major histocompatibility complex (MHC) class II chaperone. Recently, its role as a co-signaling molecule associated with B-cell proliferation and survival has been reported 34 . In addition, CD74 plays a crucial role in several inflammatory diseases such as type I diabetes, liver fibrosis, Alzheimer’s disease, and systemic lupus erythematosus 35 . The present findings demonstrated that CD74 was highly expressed in ALI tissues. CD180 is a Toll-like receptor (TLR) expressed on both B cells and dendritic cells and plays a key regulatory role in the responses of these cell types to TLR ligands. In addition, it helps the B cells and dendritic cells to process antibodies and promotes B-cell activation and proliferation36,37. TLRs play an important role in the pathophysiology of infection and inflammatory diseases 38 . Although CD180 is a nonclassical member of the TLR family, it is the most common TLR on cell surfaces 39 . We found that CD180 was highly expressed in ALI tissues; however, the difference was not significant in the validation set. MCL1, which belongs to the Bcl-2 family, is a diverse regulatory cellular protein that exerts antiapoptotic effects 40 . MCL1 primarily regulates the cell cycle and maintains cellular survival and differentiation41,42. At present, MCL1 is a promising therapeutic target in cancer, with a few reported results in immune diseases as well 43 . Our results suggested that MCL1 was expressed at low levels in ALI and showed a negative correlation with immune feature genes. Thus, it may have little relevance to the inflammatory processes and is mainly involved in maintaining normal mitosis in alveolar cells.
Both immune cell infiltration and hub genes play a crucial role in ALI progression. Therefore, the associations between differentially expressed immune cells and hub genes were further evaluated. MCL1 was negatively correlated with B cells and T cells, consistent with previous results. Thus, the progression of inflammation led to a decrease in MCL1 expression, triggering an abnormal alveolar cell survival state. CD4 cells were positively correlated with T cells, which suggested that humoral immunity played a major role in the progression of ALI. During ALI progression, T cells express more CD4 surface antigen, assist in the secretion of antibodies, and regulate immune activities, thereby playing an important role in host defense of the lung and enhancing the inflammatory responses. We also identified a possible regulatory network for the four hub genes, wherein MCL1 was primarily regulated by miRNAs. Finally, the correlations between the four hub genes and lung diseases were assessed. CD4, CD74, and MCL1 were significantly correlated with most lung diseases. However, CD180 was not strongly correlated with any lung disease, which could account for its poor performance in the external validation dataset.
However, there are several limitations to this study. First, some relevant clinical information, including disease activity and specific clinical treatments, was lacking. Second, the mouse model data were selected due to the lack of external validation samples, and more human data are required for verification of our findings. Finally, only bioinformatic methods were used for the analysis. Therefore, further in vivo and in vitro experiments are needed to validate these findings and elucidate the possible mechanisms of action.
Conclusion
In conclusion, the findings provided new insights into immune cell infiltration in the progression of ALI, and we identified four immune biomarkers of ALI, including CD180, CD4, CD74, and MCL1. MCL1–B cell, MCL1–T cell, and CD4–T cell axes may be involved in the progression of ALI. Overall, this study may provide a novel direction for designing precise diagnostic strategies and evaluating the molecular mechanisms underlying immune cell functions in ALI.
Supplemental Material
sj-docx-1-cll-10.1177_09636897221124485 – Supplemental material for Identification of Immune Infiltration and Effective Immune Biomarkers in Acute Lung Injury by Bioinformatics Analysis
Supplemental material, sj-docx-1-cll-10.1177_09636897221124485 for Identification of Immune Infiltration and Effective Immune Biomarkers in Acute Lung Injury by Bioinformatics Analysis by Dandan Ling, Xiang Zhang, Jiamin Wu, Qianyun Xu, Zhiyong He and Jun Zhang in Cell Transplantation
Footnotes
Ethical Approval
Ethical Approval is not applicable for this article.
Statement of Human and Animal Rights
This article does not contain any studies with human or animal subjects.
Statement of Informed Consent
There are no human subjects in this article and informed consent is not applicable.
Declaration of Conflicting Interests
The author(s) declared no potential conflicts of interest with respect to the research, authorship, and/or publication of this article.
Funding
The author(s) received no financial support for the research, authorship, and/or publication of this article.
Supplemental Material
Supplemental material for this article is available online.
References
Supplementary Material
Please find the following supplemental material available below.
For Open Access articles published under a Creative Commons License, all supplemental material carries the same license as the article it is associated with.
For non-Open Access articles published, all supplemental material carries a non-exclusive license, and permission requests for re-use of supplemental material or any part of supplemental material shall be sent directly to the copyright owner as specified in the copyright notice associated with the article.