
Abstract
Mesio temporal lobe epilepsy (MTLE) syndrome is the most common form of intractable epilepsies. Meanwhile, seizures are common in patients with cancer as a consequence of brain tumors, including brain low-grade gliomas (LGG). However, the underlying molecular mechanisms of MTLE remain poorly understood. Also, the relationship between MTLE and LGG needs our attention. In this study, we aimed to investigate the hub genes and potential mechanism in MTLE, and the relationship between MTLE and LGG, the gene expression profiles (GSE88992) were downloaded from the Gene Expression Omnibus (GEO) database. Difference analysis for MTLE versus control groups under the three time points was conducted to select the differentially expressed genes (DEGs). Time series clustering analysis was used to select the trend genes. Then a series of bioinformatics analyses including functional enrichment analysis, protein–protein interaction (PPI) network and module analyses, and transcription factor (TF) and miRNA prediction were performed. Also, the overall survival analysis and expression of hub genes in LGG were performed using UALCAN from TCGA database. At 6 h, there were 351 upregulated and 80 downregulated DEGs. At 12 h, there were 499 upregulated and 231 downregulated DEGs. Additionally, 532 upregulated and 402 downregulated DEGs were obtained at 24 h. After time series clustering analysis of the DEGs, we obtained 323 uptrend and 248 downtrend genes. We identified 10 key genes with higher degrees, including C3, TIMP1, PENK, CKAP4, etc. Five PPI modules were identified by MCODE. TF analysis predicted four TFs: JUN, STAT3, NR4A2, and Myc. A total of 26,834 miRNA–mRNA pairs were predicted. Moreover, survival analysis of UALCAN suggested that C3, TIMP1, PENK, GNG2, CKAP4, TNC, JUN, STAT3, NR4A2, and Myc can be potential biomarkers for the prognosis of LGG. In summary, DEGs and hub genes were identified in the present study, which provides novel insight into the development of MTLE.
Keywords
Introduction
Epilepsy is a serious neurological disorder, which is characterized by spontaneous recurrent seizures and a high incidence of comorbid health conditions 1 . Mesio temporal lobe epilepsy (MTLE) is one of the most common forms of intractable epilepsies. It has been reported that all patients with MTLE have experienced one or more triggering disorders, such as head trauma, intracerebral infections, complex febrile seizures, or ischemic episodes in early childhood 2,3 . Currently, significant signs of progress have been made in understanding the disease processes in the epilepsies. Many genetic variants related to common and rare epilepsies have been reported 4 -6 . However, there is still no accurate biomarker or effective therapeutic target for epileptogenesis.
To search for biomarkers for MTLE, RNA-seq and microarray methods have been used to study representative animal models of MTLE 7- 9 . Nevertheless, some of these studies induce a status epilepticus for several hours in the rat through systemic injections of kainite 10 , which leads to bilateral lesions of different brain structures, and systemic convulsions. The two features may be confused with those observed in MTLE patients 11 . Additionally, in some studies, the brain samples were collected from animals that were experiencing seizures, either during the status epilepticus or later 12 , which raised the concern that the observed changes may be a consequence of seizures.
To avoid the concerns above, Kalozoumi et al. 13 recently established an MTLE mouse model by intra-hippocampal microinjection of kainate. They then conducted whole-genome expression analyses of the hippocampus at 6, 12, and 24 h of injection to depict the molecular changes in the early stages of epileptogenesis. Although some key regulators of MTLE, such as vimentin, cytochrome B-245 alpha chain, and cytochrome B-245 beta chain have been identified, the understanding of molecular mechanisms underlying MTLE is still limited using the integrated bioinformatics methods, and multidimensional evaluation of the complex pathogenesis in MTLE is still required.
Seizures are the presenting symptom in approximately one-third of patients with brain tumors, including both primary and metastatic tumors. During their illness, many patients who have cancer experience seizures, with the incidence varying according to the type of tumor. Low-grade gliomas (LGG) ranked third among them 14 . Although LGG (astrocytomas, oligodendrogliomas, and oligoastrocytomas) are considered relatively benign, well-differentiated tumors and have 5-year survival rates of 59.9%, approximately 70% of LGG patients develop GBM within 5–10 years 15 . Therefore, it is necessary to further understand the relationship between epilepsy and LGG by understanding the molecular basis of epilepsy, which is an important step in defining new biomarkers and therapeutic strategies of MTLE and LGG.
Thus, the present study aimed to explore possible molecular mechanisms and biomarkers of MTLE and the relationship between the MTLE and LGG. We first selected the candidate genes from the Gene Expression Omnibus (GEO) dataset (accession number: GSE88992) deposited by Kalozoumi et al. 13 through time series clustering analysis. Then a series of bioinformatics analyses including functional enrichment analysis, protein–protein interaction (PPI) network and module analyses, and transcription factor (TF) and miRNA prediction were performed. We further performed the expression of the key genes and survival analysis by using UALCAN data.
Materials and Methods
Microarray Data
Dataset GSE88992 (species: Mus musculus) were downloaded from the NCBI GEO 16 database. The dataset contains 17 samples obtained from three time points: 6, 12, and 24 h. For each time point, intrahippocampal microinjection of kainate (1 nmol/50 nl) and saline (control) was performed. All samples were detected using the [Mouse430_2] Affymetrix Mouse Genome 430 2.0 Array platform.
Differentially Expressed Genes Screening
The probe expression matrix file GSE88992 series matrix.txt was downloaded from the GEO database. The probes were annotated with the annotation file to remove the probe that did not map the gene symbol. If different probes mapped to the same gene, the mean value of different probes was taken as the final expression value of this gene.
Using the classical Bayes method provided by the limma package 17 (version 3.10.3), difference analysis for kainate versus control groups under the three time points was conducted to select the differentially expressed genes (DEGs). The P-value and log fold change (FC) value of all genes were obtained. Then Benjamini and Hochberg method was used for multiple test correction, obtaining the adjusted P-value (adj.p.value). The thresholds for DEGs screening were set as follows: adj.p.value < 0.05 and |logFC| > 1.
Time Series Clustering Analysis
The union sets of differentially expressed up- or downregulated genes at all time points were clustered by using Short Time-series Expression Miner (STEM) 18 v1.3.11. In detail, the average expression value of each gene under every time point was calculated as input, and the control group considered as 0 h. Then based on the software default parameters, the DEGs set that presented an upward or downward trend over time was searched (P-value < 0.001 was defaulted to significant in STEM). These genes were considered to be gene clusters that varied significantly with kainate treatment time.
Functional and Pathway Enrichment Analysis of Trend Genes
The DEGs set that presented an up- or downtrend over time were subjected to Gene Ontology (GO) 19 function and KEGG 20 pathway enrichment analyses using the DAVID database (version 6.8). Significance thresholds were set as P < 0.05 and enrichment number (count) ≥ 5.
PPI Network Analysis
The interaction of these DEGs was analyzed using STRING (https://string-db.org/) 21 (version: 10.0) database. The input gene set was the trend gene obtained above, and the species was M. musculus. PPI score was set to 0.9 (highest confidence), and the protein nodes should be included in the up- and downregulated DEGs. Furthermore, Cytoscape software 22 (version 3.4.0) was used for network construction. The network node connectivity degree was analyzed using CytoNCA plugin 23 (version 2.1.6) (parameter: without weight). The hub genes (Degree > 10) involved in the PPI network were selected through degree ranking.
PPI Module Analysis
In the PPI network, the functional modules were identified by clustering analysis. MCODE plugin 24 was used to analyze PPI network module, and MCODE score ≥ 5 (parameters: Node Score Cutoff = 0.2, Degree Cutoff = 2, k-core = 2, max. depth = 100). Then, the obtained modules were subjected to KEGG pathway analysis using clusterProfiler 25 (version 3.8.1). The pathways with BH adjusted adj.p.value < 0.05 were considered as significant enrichment results, which were displayed in bubble charts.
TF Regulatory Network Analysis
TRRUST (version 2) contains 8444 regulatory interactions for 800 TFs in humans as well as 6552 TF–target interactions for 828 mouse TFs 26 . In this study, the TFs for up- or downtrend genes were predicted using TRRUST database (species: M. musculus). Following that, the TFs that differentially expressed in at least one point time and the TF-target regulatory relations with P-value < 0.05 were selected to build the TF-target regulatory network.
Upstream miRNA Prediction
miRWalk2.0 27 is a comprehensive database, which provides the largest available set of predicted and experimentally validated miRNA-target interactions. Additionally, it not only records miRNA binding sites in the complete sequence of genes but also compared this information with the binding sites of 12 existing miRNA-target prediction programs: miRMap, miRWalk, miRNAMap, MicroT4, TargetScan, RNAhybrid, PICTAR2, miRBridge, PITA, miRanda, miRDB, and RNA22. Now we used the predicted Target Module in miRWalk 2.0 to predict the miRNAs for the trend genes (species: M. musculus). The miRNAs that simultaneously appeared in miRWalk, Microt4, miRanda, RNA22, and Targetscan databases were selected as the upstream regulatory molecules of the corresponding genes. After obtaining miRNA–mRNA relation pairs, miRNAs with the number of target genes in the TOP20 were selected for miRNA-target network construction.
Functional Pathway Enrichment Analysis of miRNAs
The KEGG pathway enrichment analysis of the corresponding target genes of the miRNA was carried out using clusterProfiler, and the pathways with adj.p.value < 0.05 were selected as the pathway of miRNAs. The results were displayed in bubble charts.
Expression and Survival Analysis of DEGs in LGG Between the Grade 2 and Grade 3
Kaplan–Meier curve was used to evaluate the effects of DEGs on the overall survival of LGG patients. According to the median gene expression levels between the LGG-Grade 2 (moderately differentiated) and LGG-Grade 3 (poorly differentiated), LGG patients were classified into high and low expression groups. The difference between high or low expression group was assessed by P-value. P < 0.05 was regarded as significant. The correlation between gene expression and clinical relevance was analyzed using UALCAN (https://ualcan.path.uab.edu/index.html) online dataset (Chandrashekar et al., 2017), which is a user-friendly, interactive web resource for the analysis of cancer transcriptome data.
Quantitative Real-time Polymerase Chain Reaction Analysis
To confirm the microarray results, some DEGs were confirmed by quantitative real-time polymerase chain reaction (qRT-PCR) analysis. According to the previously described methods 13 , 10 C57Bl/ 6 J mice (KA group: n = 5 and control group: n = 5) were selected randomly from each group and made the epileptic mouse model. After KA induction, hippocampus isolation, and RNA extraction, cDNA was prepared using the RevertAid™ First Strand cDNA Synthesis Kit (Thermo Fisher, Agawam, MA, USA). By employing the Real Master mix (SYBR Green) Kit (Tiangen, Beijing, China) and a LightCycler (Roche Diagnostics, Bremen, Germany), qRT-PCR was performed following the manufacturer’s protocols. Single PCR products were further verified by melting curve analysis. Note that mice β-actin was always amplified in parallel with the representative genes. The relative expression ratio was determined by the formula 2–△△ct method.
Statistics
Statistical significance of differences between groups was assessed using Student’s t tests. Throughout the text, summary data were presented as mean ± standard error of the mean.
Results
Differential Expression Analysis
Principal component analysis (PCA) showed that all eight samples under the different time points of the kainite (case) group were categorized into three main distinct clusters. Meanwhile, all nine samples of the control group were clustered together (Fig. 1A). The PCA result is consistent with our expectations.

Differentially expressed genes analysis. (A) Principal component analysis for samples. (B) Venn plots of up- and downregulated gene at each time point.
The DEGs between kainate and control groups at each time point were identified by using the limma package. At 6 h, there were 351 upregulated and 80 downregulated DEGs. At 12 h, there were 499 upregulated and 231 downregulated DEGs. Additionally, 532 upregulated and 402 downregulated DEGs were obtained at 24 h. Interestingly, we found that the number of DEGs increases with the increase of treatment time, and upregulated and downregulated DEGs appear to follow the same pattern. Finally, a total of 773 upregulated and 537 downregulated DEGs were obtained at each time point through the Venn diagram (Fig. 1B, Supplemental Tables S1 and S2).
Time Series Clustering Analysis
From a biological point of view, genes with similar expression patterns may have common characteristics, such as being regulated by a gene at the same time or having similar biological functions. According to the threshold described in the method, a total of 11 significant gene clusters were obtained, as shown in Fig. 2. The clusters 42, 48, 40, and 29 were integrated as gene clusters with increased expression over time, including 323 genes, and clusters 9, 11, and 1 were integrated as gene clusters with decreased expression over time, containing 248 genes (Supplemental Table S3). These trend DEGs were considered to be gene clusters that changed significantly with the treatment time of kainate and were associated with the development of MTLE.
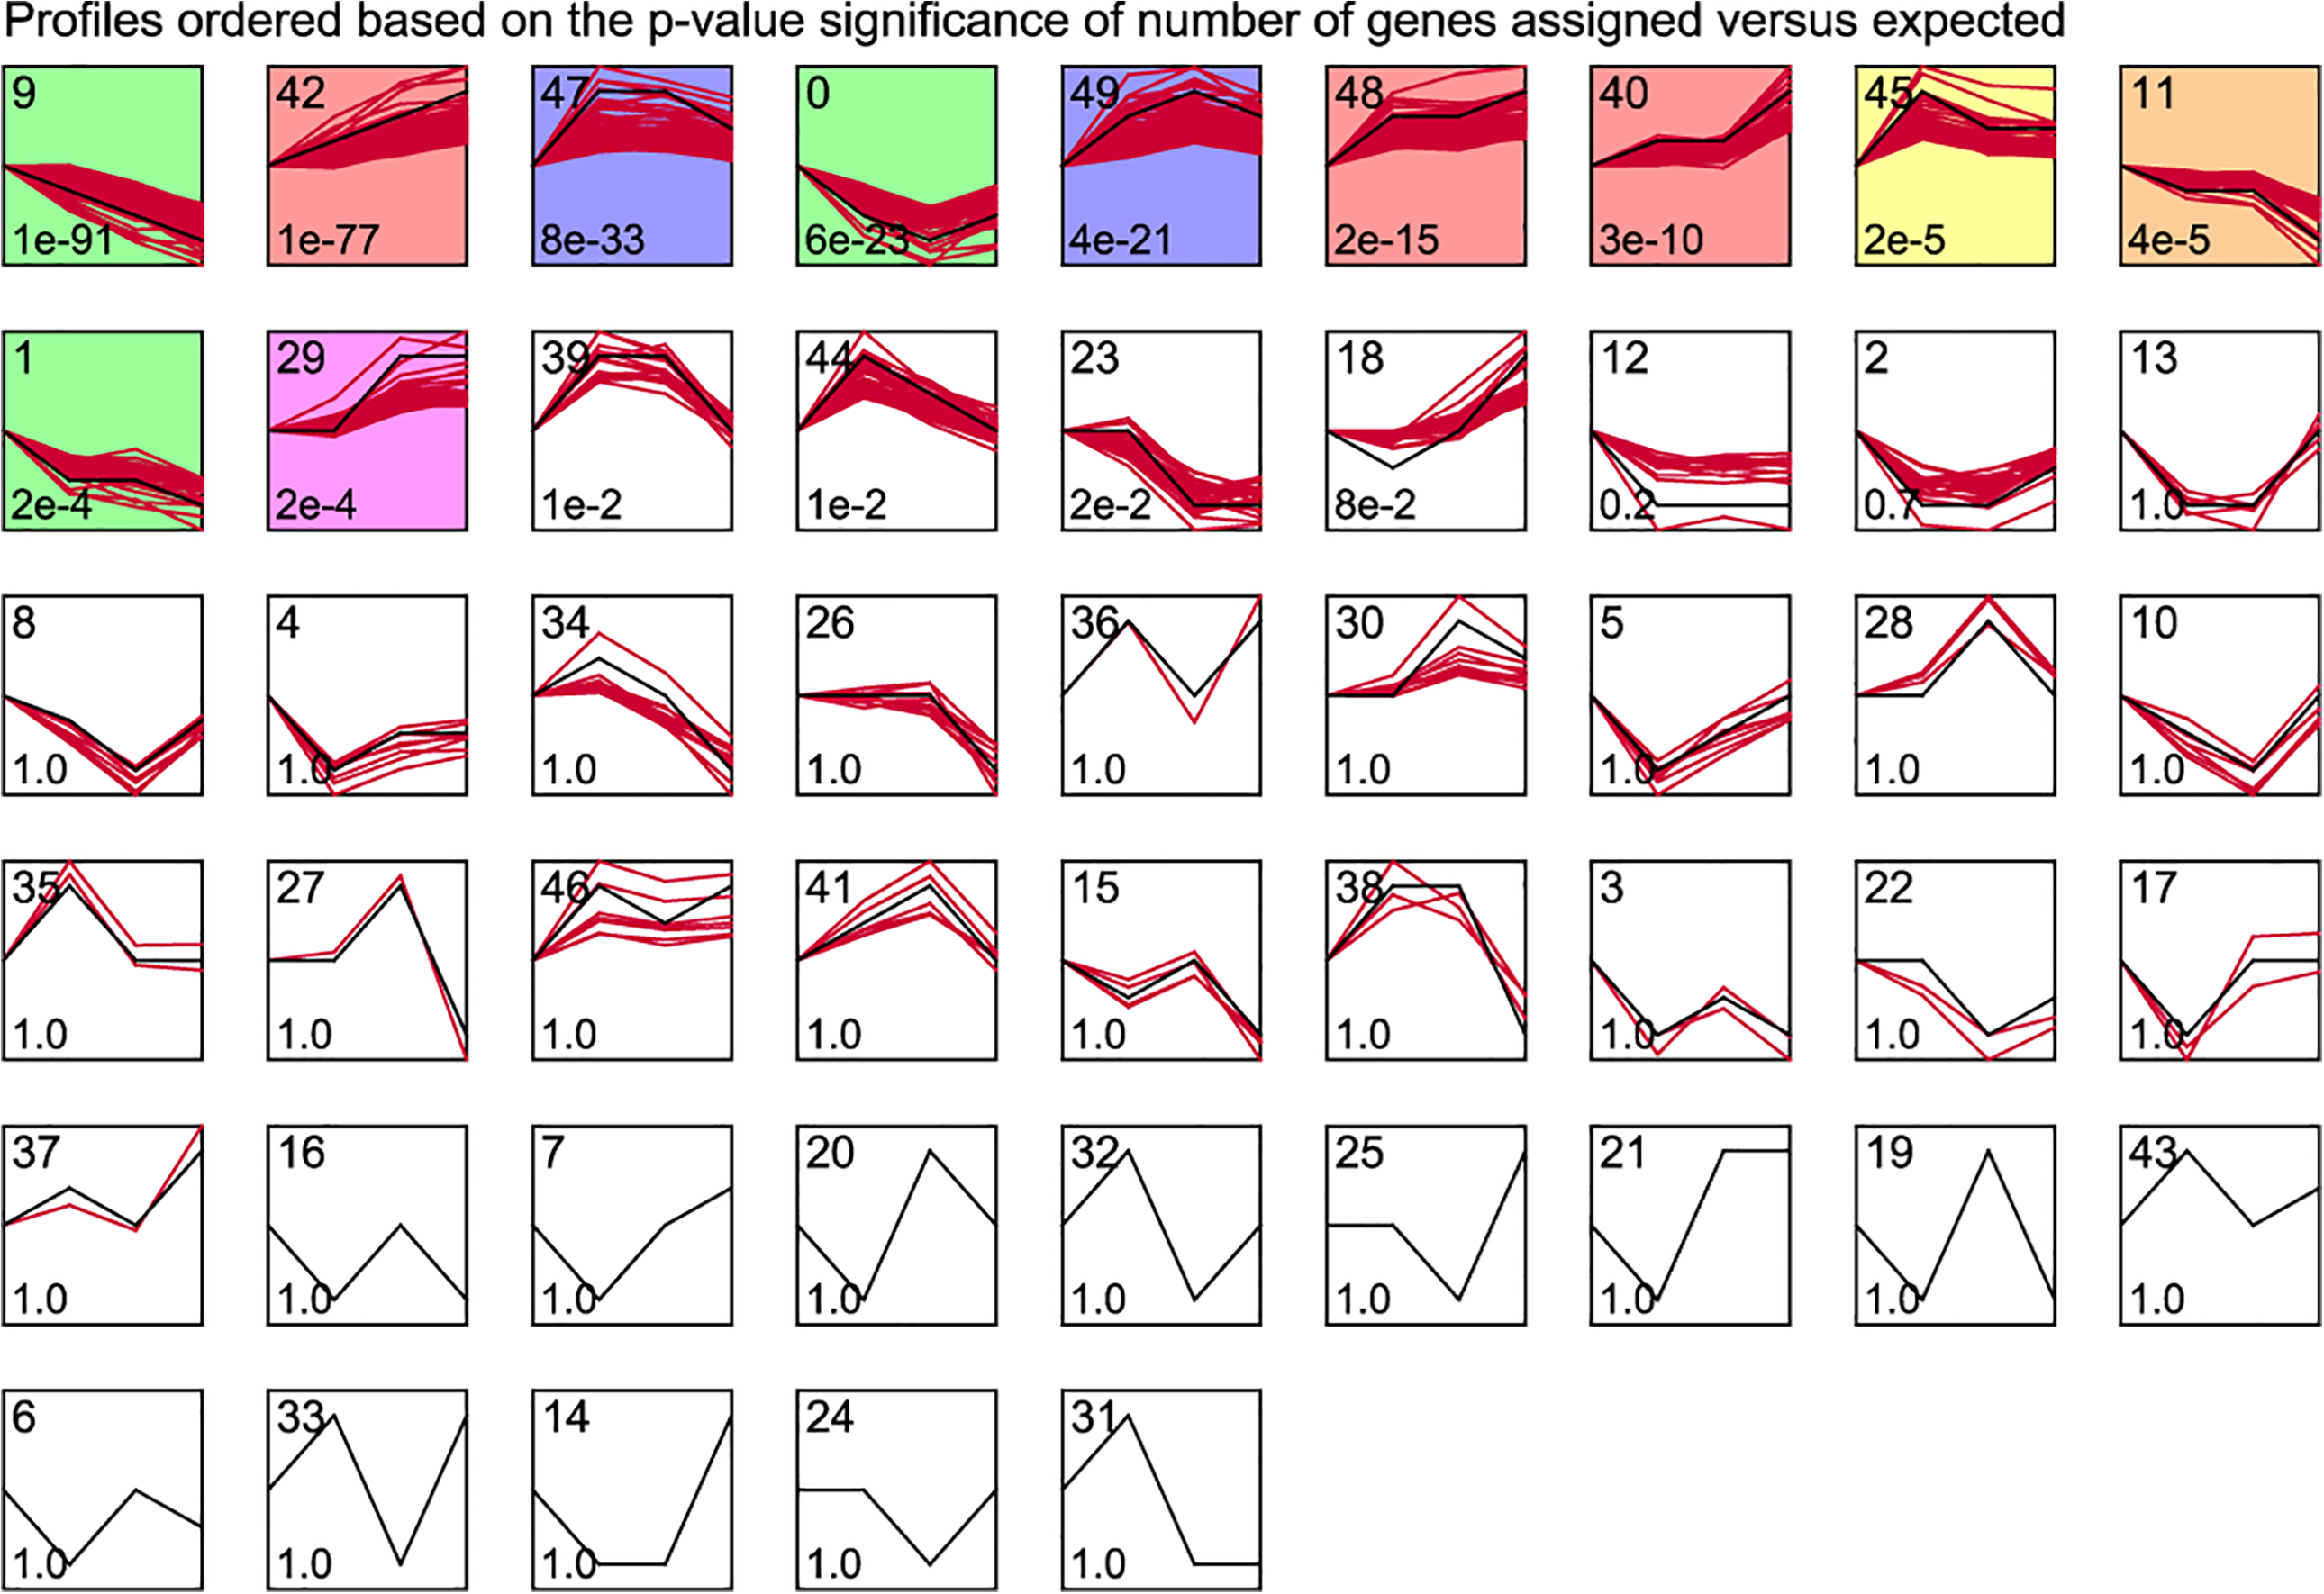
STEM time series clustering analysis. The black line represents the overall trend, the number in the upper left corner represents the cluster number, the number in the lower left corner represents P-value, and the colored one represents the significant gene cluster (P-value < 0.001). STEM: Short Time-series Expression Miner.
Functional and Pathway Enrichment Analyses of Trend Genes
To investigate the biological classification and KEGG pathway enrichment analyses of DEGs, the up- or downtrend DEGs of GO function were identified using DAVID (Supplemental Table S4). The cut-off criterion was set as P < 0.05. Top 10 changes of up- and downtrend DEGs in biological processes (BP) were significantly enriched in the inflammatory response, innate immune response, angiogenesis (Fig. 3A bottom), ion transport, chemical synaptic transmission, and neuron apoptotic process (Fig. 4B bottom).

GO function and KEGG pathway for trend DEGs: uptrend genes (A) and downtrend genes (B). The black line represents −log10 (P-value), red represents GO BP, green represents KEGG pathway, and the length of the bar represents the number of enriched genes. BP: biological processes; DEGs: differentially expressed genes; GO: Gene Ontology.

PPI network analysis of trend DEGs. PPI network corresponding to up- and downtrend genes. The red node represents the uptrend gene, the green node represents the downtrend gene, and the node size represents the degree. DEGs: differentially expressed genes; PPI: protein–protein interaction.
The top 10 enriched KEGG pathways of up- and downtrend DEGs were abundant in cytokine–cytokine receptor interaction, jak-stat signaling pathway, TNF signaling pathway (Fig. 3A top), neuroactive ligand–receptor interaction, calcium signaling pathway, and glutamatergic synapse (Fig. 4B top). These significantly enriched GO terms and pathways will help us to understand key molecules in the development of MTLE.
PPI Network Construction and Module Analysis
To further investigate the interaction among the 571 up- and downtrend DEGs, a PPI network was constructed from STRING to elucidate PPI (Fig. 4). Analysis of the connectivity degrees of nodes in the network showed that the connectivity degrees of most nodes were small (less than 10) and only a few nodes had large degrees (more than 10), which conformed to the characteristics of PPI network, that is, only a few genes play an important role in the whole network. Genes with degrees greater than 10, including complement C3 (C3), fibrinogen alpha chain (FGA), TIMP metallopeptidase inhibitor 1 (TIMP1), G protein subunit gamma 2 (GNG2), proenkephalin (PENK), cytoskeleton-associated protein 4 (CKAP4), complement C3a receptor 1 (C3AR1), glutamate metabotropic receptor 8 (GRM8), alpha-2-macroglobulin (A2M), which may be hub genes in PPI network.
PPI network was mined for functional modules. According to the threshold, five submodules were identified, as shown in Fig. 5A. KEGG pathway analysis of the five modules revealed that module 1 was involved in complement and coagulation cascades, module 2 was involved in endocytosis, module 3 was involved in neuroactive ligand–receptor interaction, module 4 was involved in phagosome, and module 5 was involved in ECM–receptor interaction (Fig. 5B). These findings indicated that the hub genes exhibited higher degrees and could serve critical roles in MTLE.

PPI module analysis. (A) Subnetwork module of the protein–protein interaction network. The red node represents the uptrend gene, and the green node represents the downtrend gene. (B) Pathway analysis results of the subnetwork module. Color from blue to red indicates the decrease of adjusted P-value, and bubble size indicates the proportion of the number of enriched genes in the number of module genes annotated to KEGG pathway. PPI: protein–protein interaction.
TF-Target Regulatory Network Construction
Combined with the results of PPI network analysis, we are interested to further investigate the TF of DEGs. Four upregulated TFs, Jun proto-oncogene, AP-1 TF subunit (JUN), signal transducer and activator of transcription 3 (STAT3), nuclear receptor subfamily 4 group A member 2 (NR4A2), and myelocytomatosis oncogene (MYC), were obtained through TF analysis of the uptrend DEGs, in which JUN and Nr4a2 were significantly upregulated at 6 and 12 h compared with the control group, Myc was significantly upregulated at 12 and 24 h, and Stat3 was significantly upregulated at 24 h. Moreover, we found two TFs, JUN and NR4A2, that can regulate hub gene expression, including TIMP1, PENK, and TNC (Fig. 6).

Transcription factor-target regulatory network. The red circle indicates the uptrend gene, and the yellow diamond indicates the upregulated transcription factor.
Upstream miRNA Prediction Analysis
A total of 26,834 miRNA–mRNA pairs were predicted, including 1014 miRNA and 465 target genes. We selected miRNAs with the top 20 target genes and constructed the miRNA-target network. As shown in Fig. 7A, 20 miRNAs, such as miR-240-3p, miR-298-5p, and miR-3473a and 317 target genes were included in the network. Pathway analysis showed that these miRNAs were significantly associated with HIF-1 signaling pathway, cAMP signaling pathway, calcium signaling pathway, and neuroactive ligand–receptor interaction (Fig. 7B, Supplemental Table S5).

miRNA-target regulatory network analysis. (A) miRNA-target regulatory network. The red circle indicates the uptrend gene, and the light purple triangle indicates the predicted miRNA. (B) Pathway analysis results of miRNAs. Color from blue to red indicates the decrease of adjusted P-value, and bubble size indicates the proportion of the number of enriched genes in the number of miRNA target genes annotated to KEGG pathway.
Expression and Survival Analysis of Key Genes in LGG Patients
To further investigate the relationship between MTLE and LGG, we selected 10 key genes with MTLE for survival analysis of LGG patients (Grade 2 and Grade 3) by the UALCAN database. Among these key genes, we found the expression levels of all key genes (C3, TIMP1, GNG2, CKAP4, PENK, TNC, JUN, STAT3, NR4A2, and MYC) were associated with poor overall survival of LGG patients (P < 0.001) (Fig. 8). However, the expression level of GNG2, PENK, NR4A2, and MYC did not have a significant difference between the LGG-Grade 2 and LGG-Grade 3 (P > 0.05) (Fig. 9). The comprehensive analysis has shown that a combination of 10 key genes of MTLE can predict the prognosis of LGG.

Overall survival analysis of hub genes in brain LGG patients based on tumor grade. Survival analysis of C3, TIMP1, GNG2, CKAP4, PENK, TNC, JUN, STAT3, NR4A2, and MYC. P < 0.05 was considered to indicate a statistically significant difference. LGG: low-grade gliomas.

Expression of hub genes in brain LGG patients based on tumor grade. Expression of C3, TIMP1, GNG2, CKAP4, PENK, TNC, JUN, STAT3, NR4A2, and MYC in LGG grade 2 and grade 3 patients. P < 0.05 was considered to indicate a statistically significant difference.
qRT-PCR Verification
To confirm the results obtained from the microarray, some DEGs (Npas4, Atf3, Fosb, Fos, TIMP1, NR4A2, etc.) from three different time points (6, 12, and 24 h) as detected by qRT-PCR. Our findings suggested that majority of the investigated genes had congruent results between the microarray and qRT-PCR assays (Fig. 10). Primers for the DEGs were summarized in Supplemental Table S6.
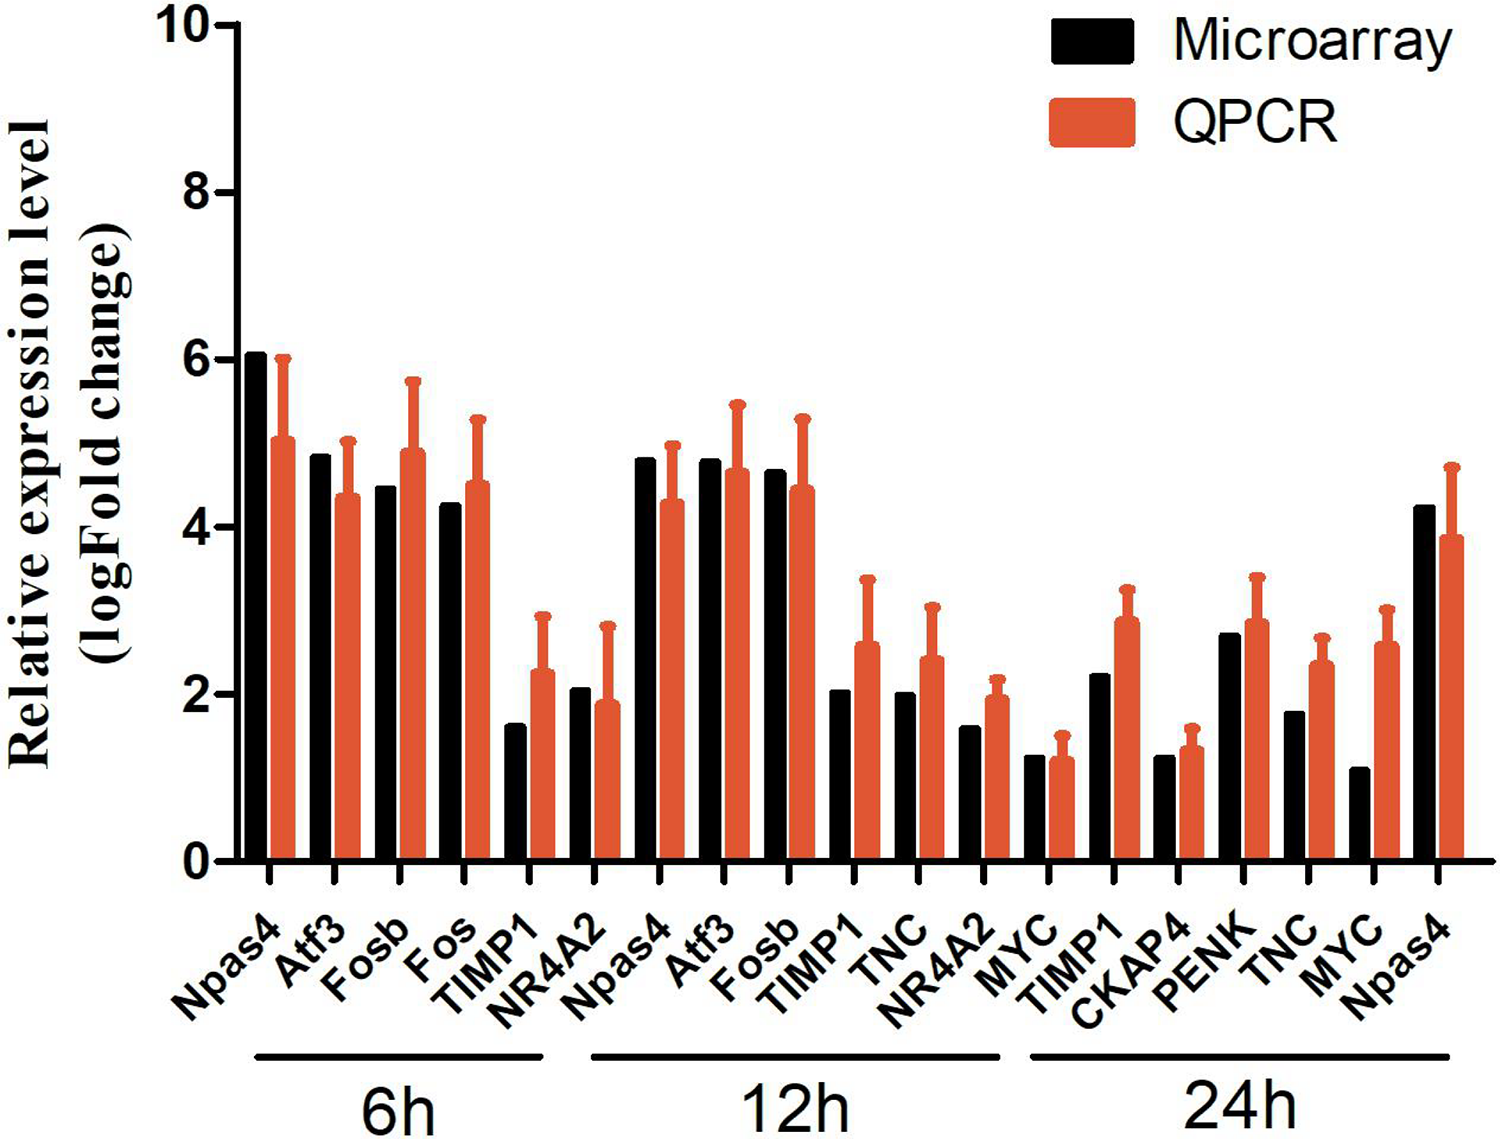
The verification results of qRT-PCR. Npas4, Atf3, Fosb, Fos, TIMP1, and NR4A2 were upregulated at 6 h; Npas4, Atf3, Fosb, TIMP1, TNC, NR4A2, and MYC were upregulated at 12 h; TIMP1, CKAP4, PENK, TNC, MYC, and Npas4 were upregulated at 24 h. LogFC was calculated based on the mean intensity value from five mice by using the comparative Ct method and normalized to the housekeeping gene β-actin. FC: fold change; qRT-PCR: quantitative real-time polymerase chain reaction.
Discussion
Bioinformatics analysis plays a crucial role in disease study, and it facilitates the understanding of disease processes by integrating data at the genome level with systematic bioinformatic methods. In this study, after time series clustering analysis of the DEGs, we identified 323 uptrend and 248 downtrend DEGs in MTLE and used a series of bioinformatics analyses to screen the key genes and pathways associated with MTLE. Moreover, these key genes are closely related to the prognosis of LGG.
Up- and downtrend DEGs lead to significant alterations in GO terms and KEGG pathways. The Biological Process (BP) of DEGs was abundantly enriched in the inflammatory response, innate immune response, ion transport, chemical synaptic transmission, process. Previous studies have suggested inflammatory cells and molecules in the injured neuronal tissue are critical factors in the development of epilepsy 28 -30 . The KEGG pathways are associated with cytokine–cytokine receptor interaction, JAK-STAT signaling pathway, TNF signaling pathway, calcium signaling pathway, and glutamatergic synapse. A recent study has revealed that the JAK-STAT and TNF signaling pathways may promote epileptogenesis 31,32 , which is consistent with our findings.
Some hub genes, including C3, TIMP1, CKAP4, PENK, TNC, and GNG2, were identified based on PPI network of DEGs analyses. Additionally, several module genes, such as SYT1, KCNAB2, and COL4A2, were identified by MCODE. TF-hub genes regulatory network was also constructed to explore the molecular mechanism of MTLE progression. We identified four TFs, JUN, STAT3, NR4A2, and MYC, that can regulate the expression of these hub genes, which provide more evidence to illustrate the mechanisms in MTLE.
The study has reported that TLE is often related to granule cell dispersion, an abnormal broadening of the granule cell layer in the dentate gyrus. Functional inactivation of the extracellular matrix protein of Reelin is associated with the formation of granule cell dispersion 33 . TIMP1 is an endogenous inhibitor of a matrix metalloprotease and plays a central role in the control of Reelin cleavage. The epileptic conditions inhibit the activity of matrix metalloprotease by the upregulation of TIMP1 34 . In our study, TIMP1 was an uptrend gene, which was following the findings above. Thus, TIMP1 may serve as a therapeutic target in MTLE.
Moreover, we found that JUN, as an important TF, regulates the expression of TIMP1. JUN is one of the immediate early genes, which can be triggered by a range of pathologic insults to the brain, such as ischemia, trauma, and seizures 35,36 . Early upregulation of JUN transcription has been reported in hippocampal neurons of experimental seizures 37 . Lee et al. 38 also reported that the seizures were related to the expression of Jun in the hippocampal neurons, and the loss of hippocampal neurons was partly caused by cell apoptosis induced by Jun-mediated signaling pathway. We speculated that TF-JUN may play a role in MTLE by regulating TIMP1.
Moreover, PENK was also regulated by TF-JUN. Additionally, PENK was predicted to be regulated by miR-3473a. Function analysis revealed that PENK was significantly enriched in GO terms of response to calcium ion (Supplemental Table S1). Interestingly, miR-3473a was also involved in the pathway of calcium signaling pathway. Voltage-gated calcium channels are widely expressed in the central nervous system of mammals. Changes in the expression and biophysical properties of voltage-gated calcium channels can easily lead to epilepsy 39 . The calcium ion is an important second messenger and plays a key role in normal brain function. It has been reported that calcium ion can regulate neuronal excitability, and intracellular calcium ion imbalance is a trigger for epilepsy 40 . Given the association of PENK with calcium ion as well as the involvement of its regulatory miRNA in calcium signaling pathway, we speculated that PENK may be associated with the occurrence of MTLE via calcium ion channels.
In addition to hub genes, several module genes may also be associated with MTLE, such as SYT1 (module 2), TNC (module 3), KCNAB2 (module 4), and COL4A2 (module 5). SYT1 encodes a synaptotagmin, which is depressed in the adult brain after seizure activity 41,42 . TNF protein was recently reported to be overexpressed in childhood with cortical dysplasia and epilepsy 43 . KCNAB2 is an ion channel gene and encodes a voltage-gated K+ channel β-subunit protein. Lack of the β subunit decreased K+ channel-mediated membrane repolarization as well as increases the excitability of neurons. Thus, loss of KCNAB2 is associated with epilepsy 43 . Col4a2 encodes one of the six subunits of type IV collagen, mutations of which are associated with neurologic diseases, including epilepsy 44 . Taken together, we speculated that these module genes may act as biomarkers of MTLE.
Furthermore, survival analysis of UALCAN data indicated that C3, TIMP1, GNG2, CKAP4, PENK, TNC, JUN, STAT3, NR4A2, and MYC is associated with poorer overall survival of LGG patients. These findings indicated that the identified key genes could be clinical biomarkers in LGG. Consistent with our results, previous studies have revealed the overexpression of TIMP1 in old LGG patients 45 . The gene expression of complement C3 cells was regulated by interferon-γ and interleukin-1β in human astroglioma, which is correlated with the pathological stage 46 . Previous results suggest that TNC is not only a potential prognostic marker for GBM but also a potential marker for glioma cancer stem cells (CSCs) 47 . The comprehensive analysis showed that there was a certain correlation between MTLE and LGG, and the key genes of MTLE could be used to evaluate the potential prognostic value of survival in LGG patients.
In summary, we aimed to identify up- and downtrend DEGs by bioinformatics analysis to find key genes involved in the development of MTLE. Moreover, the study provides 10 useful DEGs for future investigation into the prognostic value of survival in LGG patients. However, further functional explorations are required to explore the functions of these DEGs in the progression of MTLE and LGG.
Supplemental Material
Supplemental Material, sj-xls-1-cll-10.1177_0963689720978722 - Identification of Hub Genes of Mesio Temporal Lobe Epilepsy and Prognostic Biomarkers of Brain Low-grade Gliomas Based on Bioinformatics Analysis
Supplemental Material, sj-xls-1-cll-10.1177_0963689720978722 for Identification of Hub Genes of Mesio Temporal Lobe Epilepsy and Prognostic Biomarkers of Brain Low-grade Gliomas Based on Bioinformatics Analysis by Jian Xu, Mingqiang Sun, Yuanyuan Wang, Anmu Xie and Jian Gao in Cell Transplantation
Supplemental Material
Supplemental Material, sj-xls-2-cll-10.1177_0963689720978722 - Identification of Hub Genes of Mesio Temporal Lobe Epilepsy and Prognostic Biomarkers of Brain Low-grade Gliomas Based on Bioinformatics Analysis
Supplemental Material, sj-xls-2-cll-10.1177_0963689720978722 for Identification of Hub Genes of Mesio Temporal Lobe Epilepsy and Prognostic Biomarkers of Brain Low-grade Gliomas Based on Bioinformatics Analysis by Jian Xu, Mingqiang Sun, Yuanyuan Wang, Anmu Xie and Jian Gao in Cell Transplantation
Supplemental Material
Supplemental Material, sj-xls-3-cll-10.1177_0963689720978722 - Identification of Hub Genes of Mesio Temporal Lobe Epilepsy and Prognostic Biomarkers of Brain Low-grade Gliomas Based on Bioinformatics Analysis
Supplemental Material, sj-xls-3-cll-10.1177_0963689720978722 for Identification of Hub Genes of Mesio Temporal Lobe Epilepsy and Prognostic Biomarkers of Brain Low-grade Gliomas Based on Bioinformatics Analysis by Jian Xu, Mingqiang Sun, Yuanyuan Wang, Anmu Xie and Jian Gao in Cell Transplantation
Supplemental Material
Supplemental Material, sj-xls-4-cll-10.1177_0963689720978722 - Identification of Hub Genes of Mesio Temporal Lobe Epilepsy and Prognostic Biomarkers of Brain Low-grade Gliomas Based on Bioinformatics Analysis
Supplemental Material, sj-xls-4-cll-10.1177_0963689720978722 for Identification of Hub Genes of Mesio Temporal Lobe Epilepsy and Prognostic Biomarkers of Brain Low-grade Gliomas Based on Bioinformatics Analysis by Jian Xu, Mingqiang Sun, Yuanyuan Wang, Anmu Xie and Jian Gao in Cell Transplantation
Supplemental Material
Supplemental Material, sj-xls-5-cll-10.1177_0963689720978722 - Identification of Hub Genes of Mesio Temporal Lobe Epilepsy and Prognostic Biomarkers of Brain Low-grade Gliomas Based on Bioinformatics Analysis
Supplemental Material, sj-xls-5-cll-10.1177_0963689720978722 for Identification of Hub Genes of Mesio Temporal Lobe Epilepsy and Prognostic Biomarkers of Brain Low-grade Gliomas Based on Bioinformatics Analysis by Jian Xu, Mingqiang Sun, Yuanyuan Wang, Anmu Xie and Jian Gao in Cell Transplantation
Supplemental Material
Supplemental Material, sj-xls-6-cll-10.1177_0963689720978722 - Identification of Hub Genes of Mesio Temporal Lobe Epilepsy and Prognostic Biomarkers of Brain Low-grade Gliomas Based on Bioinformatics Analysis
Supplemental Material, sj-xls-6-cll-10.1177_0963689720978722 for Identification of Hub Genes of Mesio Temporal Lobe Epilepsy and Prognostic Biomarkers of Brain Low-grade Gliomas Based on Bioinformatics Analysis by Jian Xu, Mingqiang Sun, Yuanyuan Wang, Anmu Xie and Jian Gao in Cell Transplantation
Footnotes
Acknowledgments
We thank Pro Frank Huang (Department of Cancer and Blood Disease, Cincinnati Children’s Hospital Medical Center) for providing experimental guidance. We express our sincere appreciation to the reviewers for their helpful comments on this article.
Author Contributions
All the authors contributed significantly to this article. AX conceived and supervised the study, JX and MS designed experiments, JG and YW carried out experiments, JX and AX wrote the manuscript.
Data Availability
All datasets generated during the study are available on request from the corresponding author.
Ethical Approval
Ethical Approval is not applicable for this article.
Statement of Human and Animal Rights
This article does not contain any studies with human subjects. The data of animal subjects were obtained from the NCBI Gene Expression Omnibus 16 (GEO) database.
Statement of Informed Consent
There are no human subjects in this article and informed consent is not applicable.
Declaration of Conflicting Interests
The author(s) declared no potential conflicts of interest with respect to the research, authorship, and/or publication of this article.
Funding
The author(s) disclosed receipt of the following financial support for the research, authorship, and/or publication of this article: This work was supported by grants from the China Postdoctoral Science Foundation (2018M642618), the National Natural Science Foundation of China (81401230), and the Natural Science Foundation of Shandong Province (Grant No. ZR2019BH056).
Supplemental Material
Supplemental material for this article is available online.
References
Supplementary Material
Please find the following supplemental material available below.
For Open Access articles published under a Creative Commons License, all supplemental material carries the same license as the article it is associated with.
For non-Open Access articles published, all supplemental material carries a non-exclusive license, and permission requests for re-use of supplemental material or any part of supplemental material shall be sent directly to the copyright owner as specified in the copyright notice associated with the article.