
Abstract
Hepatocellular carcinoma (HCC) is a widespread, common type of cancer in Asian countries, and the need for biomarker-matched molecularly targeted therapy for HCC has been increasingly recognized. However, the effective treatment for HCC is unclear. Therefore, identifying additional hub genes and pathways as novel prognostic biomarkers for HCC is necessary. In this study, the expression profiles of GSE121248, GSE45267 and GSE84402 were obtained from the Gene Expression Omnibus (GEO), including 132 HCC and 90 noncancerous liver tissues. Differentially expressed genes (DEGs) between HCC and noncancerous samples were identified by GEO2 R and Venn diagrams. In total, 109 DEGs were identified in these datasets, including 24 upregulated genes and 85 downregulated genes. Subsequently, Gene Ontology (GO) enrichment and Kyoto Encyclopedia of Genes and Genomes (KEGG) preliminary analyses of the DEGs were performed using DAVID. The protein–protein interaction (PPI) network of the DEGs was constructed with the Search Tool for the Retrieval of Interacting Genes (STRING) and visualized in Cytoscape. Module analysis of the PPI network was performed using MCODE to get hub genes. Moreover, the influence of the hub genes on overall survival was determined with Kaplan–Meier plotter. All hub genes were analyzed by Gene Expression Profiling Interactive Analysis (GEPIA) and KEGG. Overall, the hub genes DTL, CDK1, CCNB1, RACGAP1, ECT2, NEK2, BUB1B, PBK, TOP2A, ASPM, HMMR, RRM2, CDKN3, PRC1, and ANLN were upregulated in HCC, and the survival rate was lower for HCC with increased expression of these hub genes. CCNB1, CDK1, and RRM2 were enriched in the p53 signaling pathway, and CCNB1, CDK1, and BUB1B were enriched in the cell cycle. In brief, we screened 15 hub genes and pathways to identify potential prognostic markers for HCC treatment. However, the specific occurrence and development of HCC with expression of the hub genes should be verified in vivo and in vitro.
Introduction
Hepatocellular carcinoma (HCC) is a lethal malignancy of the liver. Similar to other cancers, HCC is associated with potentially alterable risk factors, such as excess body weight, alcohol abuse, hepatitis B virus (HBV), hepatitis C virus, nonalcohol fatty liver disease, and certain genes 1,2 . Most cases of HCC (80%) occur in Asian countries because of chronic HBV infection and exposure to aflatoxin 3 . It is estimated that by 2030 China will have the largest number of HCC patients in the world, an increase of 82% from 2016 4 . Therefore, we need to determine the mechanism of HCC to detect and treat early HCC at the molecular level.
To date, the common treatment methods for HCC include radiofrequency ablation or resection, transplantation, and radioembolization. Patients with tumors of different stages choose different treatment methods, but intrahepatic spread and recurrence rates are still very high after 5 years 5 . In 2013, Nault et al. discovered potential biomarkers, which shifted the research focus to genes related to the pathogenesis of HCC 6 . Gores proposed that HCC needed an individualized treatment scheme and the stratification of patients according to a five-gene score to adopt different molecularly matched targeted treatments 7 . Subsequently, genomic mutations, such as those in the TERT promoter, TP53, CTNNB1, FGF, and PTEN anomalies, which are used in guiding biomarker-matched molecularly targeted therapy of HCC, were detected in HCC, and research on these biomarkers has recently shown significant progress 8 . Therefore, we need to identify additional dysregulated genes to find new treatment strategies to improve prognosis and to realize precision medicine.
In recent years, microarrays have rapidly developed and have become the most successful tool to allow multiple combinatorial chemistry, genomics, and proteomics assays to be carried out in parallel 9 . Currently, a large number of microarray datasets have been disclosed, but the amount of data thoroughly analyzed is lacking. However, bioinformatics analysis can be used to illustrate large and complex datasets. In our study, we examined three HCC datasets in the Gene Expression Omnibus (GEO) and identified differentially expressed genes (DEGs) through a comparison of human HCC tissue with the corresponding noncancerous liver tissue, and applied bioinformatics analysis to identify hub genes and conduct a series of functional analyses.
Materials and Methods
Datasets from the GEO
Three microarray datasets from the GPL570 platform ([HG-U133_Plus_2] Affymetrix Human Genome U133 Plus 2.0 Array) were downloaded from the GEO (http://www.ncbi.nlm.nih.gov/geo/). The GSE121248 expression profile contains 70 HCC samples and 37 noncancerous samples derived from the National Cancer Centre Singapore 10 . The GSE45267 expression profile contains 48 HCC samples and 39 noncancerous samples from National Yang-Ming University in Taiwan 11 . The GSE84402 expression profile contains 14 HCC samples and 14 noncancerous samples from the Shanghai Cancer Institute in China 12 .
Inclusion Criteria of the DEGs
GEO2 R is a free download system for online data analysis in the GEO; thus, the DEGs between HCC and noncancerous liver tissues in the GSE121248, GSE45267 and GSE84402 datasets could be obtained 13 . We established the following inclusion criteria for the DEGs: upregulated genes must have a log2 fold change (logFC) ≥ 2 and an adjusted p-value < 0.05, while downregulated genes must have a logFC ≤ –2 and an adjusted p-value < 0.05. Subsequently, Venn diagrams of the up- and downregulated genes were drawn for the different databases.
Functional Annotation of the DEGs
The Database for Annotation, Visualization and Integrated Discovery (DAVID, https://david.ncifcrf.gov/version 6.8) was used to perform a preliminary analysis of the obtained DEGs with systematic and comprehensive biological function notes. The Functional Annotation Tool is the core of DAVID, which includes Gene Ontology (GO) enrichment and Kyoto Encyclopedia of Genes and Genomes (KEGG) analyses. Through GO enrichment analysis, we can roughly compare and classify DEGs to better understand their biological characteristics 14 . The KEGG helps us to study the functional interpretation of genes and genomes as a whole network 15 . In our paper, the threshold p-value < 0.05 was considered statistically significant.
Protein–Protein Interaction Network of the DEGs
To identify the hub regulatory genes and to examine the interactions between the DEGs, a protein–protein interaction network (PPI) was generated with the Search Tool for the Retrieval of Interacting Genes/Proteins (STRING, https://string-db.org/) 16 . These genes required an interaction score ≥ 0.4 and a maximum number of interactors = 0, and the genes were imported into Cytoscape (version 3.6.1) with the Molecular Complex Detection (MCODE) app (version 1.5.1) 17 to screen the modules of hub genes with a degree cut-off = 2, haircut on, node score cut-off = 0.2, k-core = 2, and max. depth = 100.
Validation of the Hub Genes
Kaplan–Meier plotter (http://kmplot.com/analysis) is a website that offers an online validation of survival biomarkers and analyzes the overall survival (OS) of patients with high and low expression of certain genes. In our study, hub genes were detected, and a survival curve was drawn. The log-rank p-value (p < 0.05) and hazard ratio with the 95% confidence interval were also calculated. Next, Gene Expression Profiling Interactive Analysis (GEPIA) (http://gepia.cancer-pku.cn/), an open source cancer big data analysis website, was used to analyze the differential expression of 369 HCC and 160 normal tissues from The Cancer Genome Atlas (TCGA) and the Genotype-Tissue Expression (GTEx) portal. All hub genes were analyzed singly, and |log2FC| =1 and p-value = 0.01 were used as cut-off criteria 18 .
Results
Identification of the DEGs between HCC and Noncancerous Tissues
In our study, we chose 132 HCC and 90 noncancerous liver tissues from three datasets, GSE121248, GSE45267, and GSE84402, which were analyzed by GEO2 R and on the basis of filter criteria; 176, 480, and 585 DEGs were obtained, respectively (Additional files 1, 2, and 3). However, we found 109 DEGs with repeated emergence in these datasets, including 24 upregulated genes (logFC ≥ 2) and 85 downregulated genes (logFC ≤ –2), as shown in the Venn diagram (Table 1 and Fig. 1).
Identification of the Up- and Downregulated DEGs in HCC Tissues Compared with Noncancerous Liver Tissues.

DEGs: differentially expressed genes; HCC: hepatocellular carcinoma.

Identification of the DEGs between HCC and noncancerous liver tissues in three datasets via a Venn diagram. The blue circle indicates GSE121248, the green circle indicates GSE45267, and the red circle indicates GSE84402. A. Twenty-four upregulated genes had a logFC ≥ 2 and an adjusted p-value < 0.05. B. Eighty-five downregulated genes had a logFC ≤ –2 and an adjusted p-value < 0.05.
GO and KEGG Enrichment Analysis of the DEGs
To extract biological information from the 109 DEGs, we used DAVID for analysis (GO enrichment and KEGG analyses). The results of the GO analysis are presented from three aspects (Table 2): the biological process (BP) terms of the upregulated genes were mitotic nuclear division, regulation of attachment of spindle microtubules to kinetochore and G2/M transition of mitotic cell cycle, while the BP terms of the downregulated genes were epoxygenase P450 pathway, oxidation-reduction process, exogenous drug catabolic process, xenobiotic metabolic process, monocarboxylic acid metabolic process, and drug metabolic process; the cellular component (CC) terms of the upregulated genes were midbody, cytoplasm, mitotic spindle, cytosol, and nucleus, while the CC terms of downregulated genes were organelle membrane, extracellular region, blood microparticle, and extracellular space; the molecular function (MF) terms of the upregulated genes were heme binding, iron ion binding, oxidoreductase activity, acting on paired donors, with incorporation or reduction of molecular oxygen, reduced flavin or flavoprotein as one donor, and incorporation of one atom of oxygen, arachidonic acid epoxygenase activity, oxygen binding and monooxygenase activity, while the MF terms of downregulated genes were histone kinase activity, protein binding, protein kinase activity, and protein serine/threonine kinase activity. The results of the KEGG analysis are shown in Table 3. The upregulated genes were significantly enriched in the p53 signaling pathway and the cell cycle. The downregulated genes were significantly enriched in retinol metabolism, caffeine metabolism, drug metabolism – cytochrome P450, metabolism of xenobiotics by cytochrome P450, and chemical carcinogenesis.
GO Enrichment Analysis of the Up- and Downregulated DEGs.

DEGs: differentially expressed genes; GO: Gene Ontology; BP: biological process; CC: cellular component; MF: molecular function; FDR: false discovery rate.
KEGG Enrichment Analysis of the Up- and Downregulated DEGs.

DEGs: differentially expressed genes; KEGG: Kyoto Encyclopedia of Genes and Genomes.
PPI Network Analysis of the DEGs and the Identification of Hub Genes
To explore the functions of these genes, we looked for proteins that interact with the DEGs in STRING and constructed a PPI network that included 69 nodes and 209 edges (Fig. 2A). Then, the hub genes of the DEGs were identified with the MCODE app from Cytoscape (Fig. 2B). In this network, we obtained 15 nodes and 105 edges; these nodes represent 15 genes (all upregulated hub genes: denticleless E3 ubiquitin protein ligase homolog (DTL), cyclin-dependent kinase 1 (CDK1), cyclin B1 (CCNB1), Rac GTPase-activating protein 1 (RACGAP1), epithelial cell transforming 2 (ECT2), NIMA-related kinase 2 (NEK2), BUB1 mitotic checkpoint serine/threonine kinase B (BUB1B), PDZ-binding kinase (PBK), DNA topoisomerase II alpha (TOP2A), abnormal spindle microtubule assembly (ASPM), hyaluronan-mediated motility receptor (HMMR), ribonucleotide reductase regulatory subunit M2 (RRM2), cyclin-dependent kinase inhibitor 3 (CDKN3), protein regulator of cytokinesis 1 (PRC1), and anillin actin-binding protein (ANLN) (Table 4).

Identification of hub genes from the DEGs by STRING and MCODE. A. A PPI network was constructed; red nodes represent upregulated genes, and blue nodes represent downregulated genes. B. The hub genes (yellow nodes) with a degree cut-off = 2, haircut on, node score cut-off = 0.2, k-core = 2, and max. depth = 100 were screened with MCODE.
Identification of the Hub Genes in the Protein–protein Interaction Network.

Kaplan–Meier Plotter and GEPIA of the Hub Genes
After screening the 15 hub genes, we performed an OS analysis of the target genes in Kaplan–Meier plotter. The results showed that mutations in these hub genes could cause poor OS in HCC patients (Fig. 3). Subsequently, using GEPIA, we also found that the expression of the hub genes was significantly increased in tumor tissues (Fig. 4).

Overall survival analysis of the hub genes to validate survival biomarkers by Kaplan–Meier plotter. p < 0.05 was considered statistically significant.

Expression of the hub genes was validated in 369 HCC tissues and 160 normal tissues with GEPIA. |log2FC| > 1 and p-value < 0.01 were considered statistically significant. Tumor tissue is shown in red, and normal tissue is shown in gray.
KEGG Analysis of the Hub Genes
After the verification of 15 hub genes using Kaplan–Meier plotter and GEPIA, KEGG pathways of these hub genes were re-analyzed via DAVID to better understand their functions; we identified four pathways associated with the 15 hub genes (Table 5). CCNB1, CDK1, and RRM2 were enriched in the p53 signaling pathway, CCNB1, CDK1, and BUB1B were enriched in the cell cycle (Fig. 5), and CCNB1 and CDK1 were enriched in Progesterone-mediated oocyte maturation and in Oocyte meiosis (p > 0.05), respectively. Studied have proved that p53 signaling pathway and cell cycle play important roles in the progression of HCC 19 –24 . Therefore, CCNB1, CDK1, RRM2 and BUB1B may play important roles in the occurrence and development of HCC.
KEGG Enrichment Analysis of the Hub Genes.
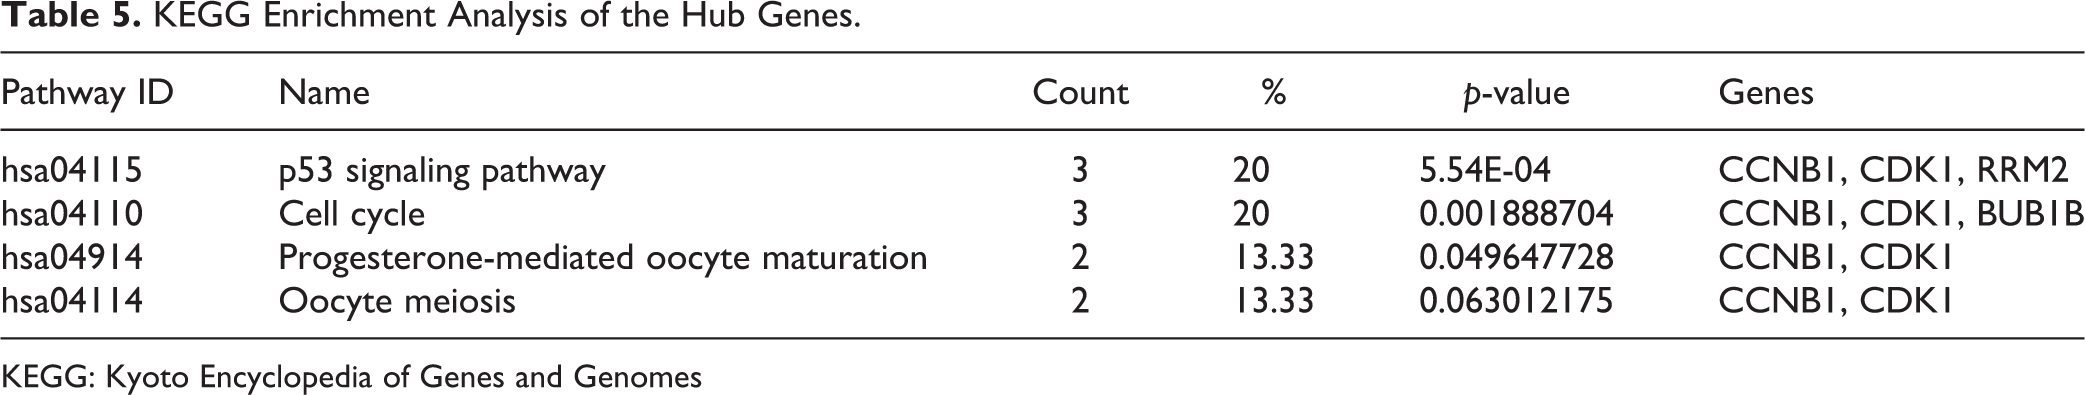
KEGG: Kyoto Encyclopedia of Genes and Genomes

KEGG enrichment analysis of the hub genes. A. CCNB1, CDK1, and RRM2 are enriched in the p53 signaling pathway (Cyclin B represents CCNB1, Cdc2 represents CDK1, and p53R2 represents RRM2). B. CCNB1, CDK1, and BUB1B enriched in the cell cycle (BubR1 represents BUB1B, and CycB represents CCNB1).
Discussion
HCC-related genes have yet to be identified to elucidate the underlying molecular mechanisms of cancer susceptibility, progression and prognosis. That is, a novel therapy targeting a direct regulatory mechanism that is correlated with a poor prognosis in HCC patients still needs to be identified. In this study, we selected three public microarray datasets from Asian countries, GSE121248, GSE45267, and GSE84402, and 109 DEGs were screened by GEO2 R according to the inclusion criteria between 132 HCC samples and 90 noncancerous samples. A PPI network of the DEGs was used to identify hub genes, and then the roles of these hub genes in HCC were validated via an OS analysis of patients in Kaplan–Meier plotter. The expression of these hub genes was compared between HCC and noncancerous tissues from the TCGA and GTEx. Finally, 15 hub genes related to a poor prognosis in HCC were identified: CCNB1, CDK1, RRM2, BUB1B, DTL, RACGAP1, ECT2, NEK2, PBK, TOP2A, ASPM, HMMR, CDKN3, PRC1, and ANLN.
In our study, among the 15 hub genes that were significantly enriched in the p53 signaling and cell cycle pathways were four potential therapeutic targets: CCNB1, CDK1, RRM2, and BUB1B. Studied have proved that cell cycle and p53 signaling pathways play important roles in development of HCC19-24. The mammalian cell cycle is controlled by regulators of the G1 to S transition such as p53, retinoblastoma, and cyclin D1 proteins. Many reports have shown that disruption of these cell cycle-related genes results in the progression of HCC19-21. And the p53 pathway is composed of a set of genes and their proteins that respond to a wide variety of stress signals. These responses to stress include cell cycle arrest, cellular senescence, or apoptosis. Moreover, the p53-regulated genes produce proteins that communicate these stress signals to adjacent cells, prevent and repair damaged DNA, and create feedback loops that regulate p53 activity and communicate with other signal transduction pathways, such as the Wnt/β-catenin, RB/INK4a, and p38 MAP pathways. Thus, the disruption of the p53 pathway has been reported in almost every type of cancer including HCC 22–24 . Based on these studies, CCNB1, CDK1, RRM2, and BUB1B may play important roles in the occurrence and development of HCC. Previous studies have reported that the CCNB1–Cdk1 complex is a key regulator of mitotic entry 25 . Importantly, Chai et al. noted that CCNB1 is highly expressed in HCC and is closely related to the poor prognosis of HCC patients, consistent with our results 26 . Gu et al. showed that CCNB1 is directly suppressed by miR-144 as a therapy targeting HCC 27 . Thus, the expression of CCNB1 is often used to estimate prognosis after treatment with anticancer drugs. CDK1 is a serine/threonine kinase and plays an important role in cell cycle progression. The inhibition of CDK1 suppresses cellular proliferation 28,29 . Its expression is also significantly higher in HCC tissue and cells; however, the real mechanism underlying the correlation between CDK1 and HCC remains unclear. RRM2 catalyzes the production of deoxynucleotide ribonucleotides in DNA synthesis and is a potential prognostic biomarker in glioma 30 , breast cancer 31 , and prostate cancer 32 . BUB1B, as a key mitotic spindle checkpoint, plays an important role in the development of many tumors. For example, the expression of BUB1B is increased in adrenocortical carcinomas 33 , and BUB1B promotes tumor proliferation and induces radioresistance in glioblastoma 34 .
We also identified other hub genes, namely, ANLN, ASPM, CDKN3, DTL, ECT2, HMMR, NEK2, PBK, PRC1, RACGAP1, and TOP2A, all of which encode proteins with high degrees in the PPI network. Most of these genes are closely related to HCC. For instance, ANLN is an actin-binding protein that is essential for assembly of the cleavage furrow during cytokinesis. Lian et al. 35 and Zhang et al. 36 have shown that ANLN promotes tumor growth by decreasing apoptosis and DNA damage, and the inhibition of ANLN in liver cells blocks cytokinesis and inhibits the development of liver tumors. ASPM overexpression is a molecular marker that predicts the enhanced invasive/metastatic potential of HCC 37 . CDKN3 is involved in the cell cycle, and Xing et al. found that CDKN3 is frequently overexpressed in both HCC cell lines and samples and that the overexpression of CDKN3 is correlated with poor tumor differentiation and advanced tumor stage by promoting cell proliferation 38 . Chen et al. showed that PRC1 promotes early HCC recurrence and poor patient outcomes in association with the Wnt/β-catenin signaling pathway 39 . Yang et al. demonstrated that PBK promotes the metastasis of hepatocellular carcinoma by activating the ETV4-uPAR signaling pathway 40 . In addition, TOP2A contributes to the early detection and targeted therapy of a variety of cancers 41 –43 , including HCC 44 . However, the relationship between some of these genes, such as NEK2, and HCC remains unclear. NEK2 participates in the progression of multiple types of cancer, such as glioblastoma 45 , adrenal cortical carcinoma 46 and myeloma 47 . Interestingly, Li et al. reported that NEK2 was overexpressed in HCC tissue and cells 48 . HCC patients with high NEK2 expression had an unfavorable prognosis, in accord with our finding. However, Fu et al. proposed that low NEK2 expression was related to a poor prognosis in HCC 49 . Therefore, the effect of NEK2 on HCC is controversial, and its elucidation requires further evidence.
In brief, our study found that high expression of 15 hub genes was closely related to poor survival in HCC patients, indicating that their antagonism may improve the prognosis of HCC. However, the detailed mechanisms underlying the possible effects of these genes still need to be characterized in vivo and in vitro. Moreover, whether there are differences in the expression of these genes in different stages of HCC or different diseases also needs to be further studied and discussed.
Supplemental Material
Supplemental Material, Complete_list_of_differentially_expressed_genes - Screening Hub Genes as Prognostic Biomarkers of Hepatocellular Carcinoma by Bioinformatics Analysis
Supplemental Material, Complete_list_of_differentially_expressed_genes for Screening Hub Genes as Prognostic Biomarkers of Hepatocellular Carcinoma by Bioinformatics Analysis by Zengyuan Zhou, Yuzheng Li, Haiyue Hao, Yuanyuan Wang, Zihao Zhou, Zhipeng Wang and Xia Chu in Cell Transplantation
Supplemental Material
Supplemental Material, Complete_list_of_differentially_expressed_genes_2 - Screening Hub Genes as Prognostic Biomarkers of Hepatocellular Carcinoma by Bioinformatics Analysis
Supplemental Material, Complete_list_of_differentially_expressed_genes_2 for Screening Hub Genes as Prognostic Biomarkers of Hepatocellular Carcinoma by Bioinformatics Analysis by Zengyuan Zhou, Yuzheng Li, Haiyue Hao, Yuanyuan Wang, Zihao Zhou, Zhipeng Wang and Xia Chu in Cell Transplantation
Supplemental Material
Supplemental Material, Complete_list_of_differentially_expressed_genes_3 - Screening Hub Genes as Prognostic Biomarkers of Hepatocellular Carcinoma by Bioinformatics Analysis
Supplemental Material, Complete_list_of_differentially_expressed_genes_3 for Screening Hub Genes as Prognostic Biomarkers of Hepatocellular Carcinoma by Bioinformatics Analysis by Zengyuan Zhou, Yuzheng Li, Haiyue Hao, Yuanyuan Wang, Zihao Zhou, Zhipeng Wang and Xia Chu in Cell Transplantation
Footnotes
Ethical Approval
Ethical Approval is not applicable for this article.
Statement of Human and Animal Rights
This article does not contain any studies with human or animal subjects.
Statement of Informed Consent
There are no human subjects in this article and informed consent is not applicable.
Declaration of Conflicting Interests
The author(s) declared no potential conflicts of interest with respect to the research, authorship, and/or publication of this article.
Funding
The author(s) disclosed receipt of the following financial support for the research, authorship, and/or publication of this article: This research was supported by grants from the National Natural Science Foundation of China (No. 81673153), University Nursing Program for Young Scholars with Creative Talents in Heilongjiang Province (UNPYSCT-2016184), Postdoctoral Science Foundation of Heilongjiang province (LBH-Z15142) and Outstanding Youth Fundation of the Fourth Affiliated Hospital of Harbin Medical University (HYDSYJQ201508).
Supplemental Material
Supplemental material for this article is available online.
References
Supplementary Material
Please find the following supplemental material available below.
For Open Access articles published under a Creative Commons License, all supplemental material carries the same license as the article it is associated with.
For non-Open Access articles published, all supplemental material carries a non-exclusive license, and permission requests for re-use of supplemental material or any part of supplemental material shall be sent directly to the copyright owner as specified in the copyright notice associated with the article.