
Abstract
Increased β-synuclein (Sncb) expression has been described in the aging visual system. Sncb functions as the physiological antagonist of α-synuclein (Snca), which is involved in the development of neurodegenerative diseases, such as Parkinson’s and Alzheimer’s diseases. However, the exact function of Sncb remains unknown. The aim of this study was to elucidate the age-dependent role of Sncb in brain microvascular endothelial cells (BMECs). BMECs were isolated from the cortices of 5- to 9-d-old Sprague-Dawley rats and were cultured with different concentrations of recombinant Sncb (rSncb) up to 72 h resembling to some degree age-related as well as pathophysiological conditions. Viability, apoptosis, expression levels of Snca, and the members of phospholipase D2 (Pld2)/p53/ Mouse double minute 2 homolog (Mdm2)/p19(Arf) pathway, response in RAC-alpha serine/threonine-protein kinase (Akt), and stress-mediating factors such as heme oxygenase (decycling) 1 (Hmox) and Nicotinamide adenine dinucleotide phosphate oxygenase 4 (Nox4) were examined. rSncb-induced effects were confirmed through Sncb small interfering RNA (siRNA) knockdown in BMECs. We demonstrated that the viability decreases, while the rate of apoptosis underly dose-dependent alterations. For example, apoptosis increases in BMECs following the treatment with higher dosed rSncb. Furthermore, we observed a decrease in Snca immunostaining and messenger RNA (mRNA) levels following the exposure to higher rScnb concentrations. Akt was shown to be downregulated and pAkt upregulated by this treatment, which was accompanied by a dose-independent increase in p19(Arf) levels and enhanced intracellular Mdm2 translocation in contrast to a dose-dependent p53 activation. Moreover, Pld2 activity was shown to be induced in rSncb-treated BMECs. The expression of Hmox and Nox4 after Sncb treatment was altered on BEMCs. The obtained results demonstrate dose-dependent effects of Sncb on BMECs in vitro. For example, the p53-mediated and Akt-independent apoptosis together with the stress-mediated response of BMECs related to exposure of higher SNCB concentrations may reflect the increase in Sncb with duration of culture as well as its impact on cell decay. Further studies, expanding on the role of Sncb, may help understand its role in the neurodegenerative diseases.
Introduction
Synucleins constitute a family of small proteins including α (Snca), β (Sncb), and γ (Sncg) synucleins. 1 The majority of recent studies focused on Snca and Sncg. The accumulation of Snca has been associated with different neurodegenerative diseases, such as Lewy body disease, Parkinson’s disease (PD), and Alzheimer’s disease (AD). 2 –5 Snca, together with the amyloid-β peptide, represents the main nonamyloidogenic component of senile plaques in AD. 6 –8 Moreover, mutations in the familial forms of PDs trigger the alterations of biophysical properties of Snca, leading to misfolding and aggregation. 9 –11
Less is known about Sncb functions, and the protein structure is similar to that of Snca, but Sncb lacks the nonamyloidogenic component domain. 1,12 The results of recent studies indicated that Sncb acts as a physiological inhibitor of Snca aggregation and that Sncb-derived peptides can potentially interfere with this process. However, the underlying molecular mechanisms have not been elucidated. 1 Sncb function was shown to be related with the control of neuronal cell death, the protection of neurons from insults, and the maintenance of the antiapoptotic effects in TSM-1 neurons. 1,13 An increase in Sncb expression within the neuroretina and visual cortex of rats and nonhuman primates was observed with age, suggesting the age-related functions of Sncb affecting neurons and other cells within the CNS. 14,15
Through the interactions with pericytes and astrocytes, endothelial cells maintain physiological homeostasis of the central nervous system (CNS) by building the blood–brain (BBB) and blood–retinal barriers. Under physiological conditions, microvessels throughout most of the CNS possess a monolayer of endothelial cells connected with tight junctions and located between the blood and brain parenchyma, comprising the BBB together with adjacent astrocytes. 16
Numerous studies showed that neurovascular dysfunctions may contribute to the onset and progression of neurodegenerative diseases, such as AD by linking cerebrovascular changes and dysfunction. 17 Recently, the age-dependent deterioration of the BBB during normal aging in the human hippocampus was demonstrated. 18 Brain microvascular endothelial cells (BMECs) derived from the mammal brain support the assumption that the BBB is a component of the neurovascular unit associated with AD development. 19
At the molecular level, p53 is one of the most commonly mutated genes associated with human tumors. Several stressors, such as hypoxia, oncogenic proteins, and ultra violet (UV) light, can cause different outcomes mediated by p53. For example, cell cycle arrest, normal growth, DNA repair, and apoptosis were shown to be related to the alterations in p53 functions and structure, while the increased levels of p53 together with p19(ARF) were observed in cellular senescence. 20 –22
No previous studies analyzed the potential effects of Sncb on the apoptosis or senescence pathways in BMECs. The aim of this study was to elucidate the potential age-related roles of Sncb in BMECs, by treating these cells with recombinant (r)Sncb, and examining Snca expression, apoptosis, and the age-related Arf-p53 senescence pathway. Following this, the anti-inflammatory and antioxidative responses of BMECs were investigated, together with the effects of Sncb downregulation.
Materials and Methods
Animals and Drugs
All experiments were conducted in strict accordance with the Association for Research in Vision and Ophthalmology (ARVO) Statement for the Use of Animals in Ophthalmic and Vision Research. Female Sprague-Dawley rats aged 5 to 9 d (P5-9; n = 6) were housed in a standard animal room under 12 h/12 h light/dark conditions, with food and water provided ad libitum. The ethics committee LANUV (Landesamt für Umwelt, Natur, und Verbraucherschutz), the regional government committee of North Rhine/Westfalia, Germany, approved this study (Permission No.: 84-02.05.20.13.128 from November 26, 2013).
Tissue Preparation and BMEC Isolation
Rats were sacrificed, and the skulls were removed and sterilized by incubation in betaisodona (Mundipharma, Limburg, Germany). After a sagittal cut, the frontal and parietal bones were removed, the cerebellum was extracted, and the cerebellum and noncerebrum structures were removed. Primary cultures of rat (r)BMECs were prepared according to the method of Li et al. 23 All procedures were carried out under aseptic conditions. Briefly, cortices from 5- to 9-d-old Sprague-Dawley rats were isolated, the surface vessels and meninges were removed, and the cortex grey matter was minced and incubated for 25 min at 35 °C in Dulbecco’s phosphate-buffered saline (DPBS; Sigma-Aldrich, Hamburg, Germany) containing 0.05% trypsin (Sigma-Aldrich). Following the centrifugation for 5 min at 800×g, the pellet was resuspended in DPBS containing 20% bovine serum albumin (BSA; Sigma-Aldrich). Further centrifugation at 2000×g for 5 min was carried out to remove cell debris, myelin, and fat. The remaining cell pellet containing microvessels was digested with 0.1% collagenase A (Roche, Mannheim, Germany) for 30 min at 37 °C, washed twice with DPBS, and resuspended in Dulbecco’s Modified Eagle Medium (DMEM)/F12 (PAA Laboratories, Pasching, Austria) supplemented with 20% fetal calf serum (FCS; Seromed, Biochrom, Berlin, Germany), 3.57 mg/mL 4-(2-hydroxyethyl)-1-piperazineethanesulfonic acid (HEPES; Sigma-Aldrich), and 100 U/mL penicillin/streptomycin (Sigma-Aldrich). Cells were cultivated in gelatinated cell culture ware at 37 °C in a 5% CO2-humidified atmosphere.
To verify the identity of the isolated cells, immunocytochemical staining was performed using the antibodies against endothelin 1 (Abbiotec, San Diego, USA) and von Willebrand factor VIII (Sigma-Aldrich). All experiments were performed in triplicate.
Cell Culture
BMECs were cultured in DMEM/F12 (PAA Laboratories) supplemented with 20% FCS (Seromed), 3.57 mg/mL HEPES, and 1% penicillin/streptomycin (50 μg/mL; Sigma-Aldrich) in a humidified CO2 atmosphere at 37 °C. The medium was replaced every 2 to 3 d. All experiments were performed in triplicate.
Exposure of BMECs to rSncb
We incubated BMECs with rSncb (rat; Prospec, East Brunswick, NJ, USA) at increasing concentrations (1, 10, 100, 250, and 500 ng/mL, and 1 μg/mL) for 24, 48, and 72 h. Since the viability and apoptosis of BMECs were affected the most in the samples treated with 1 , 50, and 500 ng/mL of rSncb for 72 h, all further analyses were performed by incubating the cells with these concentrations for 72 h (n = 4 per group).
Immunohistochemistry
BMECs were grown on cover slips, fixed in PBS-buffered solution of 4% paraformaldehyde (pH 7.4; PFA; Carl Roth, Karlsruhe, Germany) for 10 min at room temperature, and then washed in PBS (Sigma-Aldrich). The cells were incubated with blocking solution containing 10% FCS and 0.25% Triton X-100 (Sigma-Aldrich) for 2 h at room temperature, and then with the primary antibodies diluted in 10% FCS overnight at 4 °C. After washing with PBS, the cells were incubated with the secondary antibodies diluted in 10% FCS (2 h at room temperature), washed in PBS, and then cover-slipped with antifade mounting medium (Mowiol, Hoechst, Frankfurt, Germany) containing bisBenzimide (33342, Hoechst), in order to stain cell nuclei. The slides were viewed using the appropriate filter, an epifluorescence microscope (Imager 2; Carl Zeiss, Jena, Germany), and the appropriate software (ZEN 2012; Carl Zeiss). Secondary antibody alone was used in the negative controls. Controls and treated samples were stained simultaneously to avoid variations in immunohistochemistry (IHC) staining. The antibodies used are listed in Table 1.
Antibodies for Immunohistochemistry and Western Blotting.

Abbreviations: Akt, RAC-alpha serine/threonine-protein kinase; ARF, Adenosine diphosphate ribosylation factors; GAPDH, glyceraldehyde 3-phosphate dehydrogenase; HMOX1, heme oxygenase (decycling) 1; HRP, horseradish peroxidase; MDM-2, mouse double minute 2 homolog; kDa, kilo Dalton; NA, not applicable; p53, cellular tumor antigen p53; PECAM-1, platelet endothelial cell adhesion molecule; pAkt, phosphorylated RAC-alpha serine/threonine-protein kinase; phospho PLD-2, phospholipase D-2; Snca, α-Synuclein; Sncb, β-synuclein; Tbp, TATA-binding protein.
Western Blot Analysis
Expression of Snca, Sncb, Mdm2, p19(Arf), and p53 was analyzed using Western blotting. The used antibody for Pld2 was suitable only for the IHC analysis. For Western blot, 2 × 10⁵ BMECs were cultured in petri dishes (Sarstedt, AG & Co, Nürnbrecht, Germany), as described above. The cultured cells were harvested by trypsinization and washed twice in PBS (Sigma-Aldrich). To distinguish between the localization of Pld2, Mdm2, p19(Arf), and p53 in the cytoplasm and/or the nucleus, cells were resuspended in hypotonic buffer (20 mM Tris, pH 7.4 (Carl Roth); 10 mM NaCl; 3 mM MgCl2) supplemented with protease and phosphatase inhibitors (Roche and Sigma-Aldrich, respectively) and incubated on ice for 15 min. After centrifugation (10 min, 3000×g, 4 °C), the supernatant was collected as cytoplasmic extract. The remaining pellet was resuspended in nuclear cell extraction buffer (50 mM Tris, pH 7.4; 150 mM NaCl; 2 mM ethylenediaminetetraacetic acid [EDTA] (Serva, Heidelberg, Germany); 0.5% sodium deoxycholate (Merck Millipore, Darmstadt, Germany); 1% Triton X-100 (Sigma-Aldrich); 10% glycerol (Merck Millipore); 1 mM DTT (Roche); 0.25% sodium dodecylsulfate [SDS, Sigma-Aldrich]) supplemented with protease and phosphatase inhibitors and kept on ice for 30 min. Following the centrifugation (30 min, 15800×g, 4 °C), the supernatant was saved as nuclear membrane extract. To study the expression of Snca, Sncb, and the apoptosis-related factors, cells were lysed in radioimmunoprecipitation assay (RIPA) buffer, containing 0.25% SDS, with the additional protease inhibitor cocktail (Roche) and 1 mM phenylmethylsulphonyl fluoride (Sigma-Aldrich), which was followed by further trituration and ultrasound treatment. To determine the localization of the factors related to the p53/Mdm2/p19(Arf) pathway, cells were resuspended in hypotonic buffer (20 mM Tris pH 7.4; 10 mM NaCl; 3 mM MgCl2), supplemented with protease and phosphatase inhibitors (Roche, Mannheim, Germany; Sigma-Aldrich) and incubated on ice for 15 min. After centrifugation (10 min, 3,000×g, 4 °C), the supernatant was saved as cytoplasmic extract (cytoplasm). The remaining pellet was resuspended in nuclear cell extraction buffer (50 mM Tris pH 7.4; 150 mM NaCl; 2 mM EDTA; 0.5% sodium deoxycholate; 1% Triton X-100; 10% glycerin; 1 mM DTT; 0.25% SDS), supplemented with protease and phosphatase inhibitors, and kept on ice for 30 min. After centrifugation (30 min, 15,800×g, 4 °C), the supernatant was saved as nuclear membrane extract. To study the expression of apoptosis-related factors, cells were lysed in RIPA buffer containing 0.25% SDS with the addition of protease inhibitor cocktail (Roche, Mannheim, Germany) and 1 mM phenylmethylsulfonyl fluoride (Sigma-Aldrich), which was followed by further trituration and ultrasound treatment. Protein concentrations were determined using Bradford reagents (Bio-Rad, Munich, Germany). The samples were then transferred to SDS sample buffer containing 130 mM Tris-HCl, 10% wt/vol SDS, 10% mercaptoethanol (Sigma-Aldrich), 20% glycerol, and 0.06% wt/vol bromophenol blue (Sigma-Aldrich). Thirty micrograms of protein from each sample were fractionated on 8% and 12% SDS-polyacrylamide gels (depending on the molecular weight of the target protein) with a protein marker (Bio-Rad, Hercules, CA, USA). After electrophoresis, the proteins were transferred onto a nitrocellulose membrane (Whatman, GE Healthcare Europe, Freiburg, Germany) or polyvinylidene difluoride membrane (Roche Diagnostics GmbH, Mannheim, Germany). Blots were incubated in the blocking solution containing 3% fat-free dried milk (Carl Roth) in tris-buffered saline (pH 7.6) for 1 h, followed by incubation overnight at 4 °C with a primary antibody (Table 1). As the control antibodies, we used anti-glyceraldehyde 3-phosphate dehydrogenase (Gapdh; 1:100,000; Sigma-Aldrich), anti-β-tubulin (abcam, Cambridge, UK), and anti-TATA-binding protein (Tbp; 1:1000, Cell Signaling, Leiden, Netherlands). The membrane was then incubated with a horseradish-peroxidase-conjugated secondary antibody (Sigma-Aldrich) in a blocking solution at room temperature for 1 h. Antibodies were detected by enhanced chemiluminescence (Amersham, Rockville, MD, USA), and the relative densities of the protein bands were analyzed using Alpha Ease (Alpha-Ease FC software 4.0, Alpha Innotech, Biozym Scientific, Vienna, Austria). The protein density of a fixed area was determined after subtracting the specific background density in the surrounding region, and this density was correlated and corrected using the relative density of an application control. The protein density of the control samples was defined as the reference values, and the relative values of other groups were calculated. Means and standard deviations (SDs) of the relative protein densities were obtained in at least 3 individual experiments, each performed in triplicate for each individual group. To evaluate whether p53 and Mdm2 increase in cytoplasm or nucleus, the ratio of the average p53 level and Mdm2 expression level was estimated. The primary and secondary antibodies used for these experiments are listed in Table 1.
Quantitative Real-Time Polymerase Chain Reaction
Total RNA was isolated using the Gene Elute Mammalian Total RNA Miniprep Kit (Sigma-Aldrich) according to the manufacturer’s instructions. Quantification was performed using an UV/visual spectral photometer (NanoDrop ND-1000, Peqlab, Erlangen, Germany). Complementary DNA was synthesized from 1 μg of total RNA using the High Capacity cDNA Reverse Transcription Kit (Applied Biosystems; ABI, Foster City, CA, USA). The following quantitative real-time (qRT)-polymerase chain reaction (PCR) primer pairs designed with Synergy Brands, Inc. (SYBR)-Green were used: Pld2 (NM_033299.2) forward: AGCCTGCTGACAGACACTAAC; reverse: ACCTAAGACAACATCCATCTCCAAG; Mdm2 (NM_001108099.1) forward: CCGAGCGAAATGGTCTCTCA; reverse: CTGCAGACCGCTGCTACTC; Mdm2 (NM_001108099.1) forward: TGCTTTGTTAACGGGGCCT; reverse: TGAGAGACCATTTCGCTCGG; p19(Arf) (NM_031550.1) forward: CTACTCTCCTCCGCTGGGAA; reverse: CCAAGGAGAAAAAGGAGGGCT;
p53 (NM_030989.3) forward: AGCGACTACAGTTAGGGGGT; reverse: ACAGTTATCCAGTCTTCAGGGG; Bax (NM_007527) forward: TTGCTGATGGCAACTTCAAC; reverse: GATCAGCTCGGGCACTTTAG; Bcl2 (NM_016993.1) forward: TGAAGACTCCGCGCCCCTGA; reverse: CTGGCAGCCGTGTCTCGGTG; Hmox1 (NM_012580.2) forward: TGCACATCCGTGCAGAGAAT; reverse: CTGGGTTCTGCTTGTTTCGC; Nox4 (NM_053524.1) forward: CTGCTGCTGCATGTTTCG; reverse: GGGGTCCGGTTAAGACTGAT; Gclc (NM_017305.2) forward: GAAAAAGTGTCCGTCCACGC; reverse: ATCAGGGCTGATTTGGGAGC; Gclm (NM_012815.2) forward: TCCAGACGAAGCCATAAACA; reverse: TTGGCACATTGATGACAACC.
qRT-PCR was performed using the SYBR-Green PCR kit (ABI) according to the manufacturer’s instructions. The relative expression was calculated as 2−ΔCt(specific gene)/2−ΔCt mean, using the gene-encoding Gapdh as the endogenous housekeeping gene. The relative expression (relative quotient [RQ]) was calculated and is presented as a fold change relative to the expression level in the control group. To evaluate the pro- and the antiapoptotic conditions, the ratio of the average Bax and Bcl2 expression levels was determined.
Cell Viability Assay
The viability of BMECs treated with rSncb was evaluated using the 3-(4,5- dimethylthiazol-2-yl)-2,5-diphenyl tetrazolium bromide (MTT) assay, and the results were obtained using the microplate reader at 570 and 670 nm (Spectra II, Tecan Group, Männedorf, Switzerland). Cells were seeded in 24-well plates (300 μL per well, containing 2 × 10⁴ cells/mL). MTT (350 μL, 5 mg/mL; Sigma-Aldrich) was added to each well, and the cells were incubated for 2 h. Medium was removed, and 500 μL of isopropanol with 0.04 M HCl was added to each well to dissolve formazan. The viability of the control samples was considered to be 100%.
TUNEL Assay
BMECs exposed to rSNCB were fixed with PBS-buffered solution of 4% PFA and pH 7.4 (Sigma-Aldrich) for 30 min. After washing with PBS (pH 7.4), the specimens were incubated with 30% sucrose overnight at 4 °C and subsequently frozen in N-methylbutane (Merck Millipore) cooled in liquid nitrogen. Cell nuclei were stained as described. Afterward, ApopTag Fluorescein In Situ Apoptosis Detection Kit S7110 (Merck Millipore) was used for Terminal deoxynucleotidyl transferase dUTP nick end labeling (TUNEL) staining, according to the manufacturer’s instructions.
Sncb Knockdown
A transient knockdown of Sncb was achieved by using the small interfering RNA (siRNA)-27-transfection kit (Origene, Herford, Germany) with the siTran1.0 transfection reagent, according to the manufacturer’s instructions. Briefly, the day before the transfection, 8 × 10⁴ rBMECs per well were seeded into gelatinated 12-well plates and grown to 50% to 70% confluence in culture medium. On the day of transfection, these cells were washed once with DPBS and then incubated for 1 h with Opti-MEM (Thermo Fisher Scientific, Waltham, MA, USA) at 37 °C. The working concentration of Sncb-siRNA was mixed with siTran1.0 in Opti-MEM and incubated for 10 min at room temperature. Opti-MEM was replaced with 700 µL of fresh Opti-MEM, and the siTran (Origene, Herford, Germany)/siRNA mixtures were added dropwise to the cells. Multiwell plates were incubated at 37 °C in a CO2 incubator for 24 h. Scrambled siRNA was used as the negative control in each assay.
Statistical Analysis
Mean ± SD values were obtained using Kolmogorov–Smirnov test to confirm Gaussian distribution. The independent-sample t test (for normally distributed samples) or the Kruskal–Wallis H test (for non-Gaussian-distributed samples) was used when appropriate. Local P values were corrected for multiple comparisons using the Holm–Bonferroni method. Figures were prepared using standard image-processing software (Photoshop, Adobe Systems, San Jose, CA, USA), and the overall brightness and contrast were adjusted without retouching. Data are presented as mean ± SD values compared with the unaffected control, and the level of statistical significance was set at P < 0.05.
Results
Effects of rSncb Treatment on Snca and Sncb Expression
Snca expression was shown to be associated with the membrane of BMECs (Fig. 1C, J, and N), while Sncb was mainly detected within the nucleus and in perinuclear cytoplasm. The intensity of Snca immunostaining in the membrane of rSncb-treated BMECs was shown to be slightly decreased (Fig. 1L and 1P). Western blot analyses showed nonsignificant alterations in Snca protein expression levels, following the treatment with rSncb ([treatment with 1 ng/mL of rSncb] 69.94% ± 19,55%, P = .27; [50 ng/mL] 81.81% ± 77.97%, P = 0.79; [500 ng/mL] 44.3% ± 20.92%; P = 0.17), compared with those in the control (Fig. 1Q and 1R). The treatment with 1 ng/mL of rSncb resulted in an increase in Snca levels (RQ: 2.6 ± 2.9) compared with those in the control sample (P = .02), whereas the addition of the higher concentrations of rSncb resulted in a decrease in Snca expression levels ([treatment with 1 ng/mL of rSncb] 2.62 ± 0.3, P = 0.02; [50 ng/mL], 0.9 ± 0.2, P = 0.6; [500 ng/mL] RQ: 0.6 ± 0.5; P = 0.0008), compared with those in the control samples. No significant alterations in Sncb expression were observed [1 ng/mL of rSncb] RQ: 0.7 ± 0.03, P = 0.25; [50 ng/mL] RQ: 1.2 ± 0.03, P = 0.38; [500 ng/mL] RQ: 1.1 ± 0.02; P = 0.4) in comparison with those in the control cells (Fig. 1S). This indicates that Snca and Sncb levels are linked; however, they may operate independently.

α-synuclein (Snca) and β-synuclein Sncb expression in recombinant Sncb (rSncb)-treated brain microvascular endothelial cells (BMECs). (A-H) Immunohistochemistry (IHC) staining for Snca (red) and Sncb (red) in platelet endothelial cell adhesion molecule 1 (PECAM-1)-positive (green) BMECs. (I-P) Snca (green) and Sncb red expression in rSncb-treated BMECs. Secondary antibodies (green, Alexa 488; red, Alexa 594) were used for the visualization. BisBenzimide (blue) was used to stain cell nuclei. (Q) Western blotting blot analyses of Snca expression in rSncb-treated exposed BMECs. (R) Quantitative densitometric analyses of the results presented in (Q), relative to untreated control [%]. BMEC lysates were prepared, and Snca expression (18 kDa) was analyzed. Gapdh (36 kDa) was used as a loading control. (S) qRT-PCR results showing Snca and Sncb expression levels in rSncb-treated BMECs, compared with those in the control. Scale bars: (A-P): 50 µm. * P < 0.05, compared with the untreated control.
Cell Viability and Apoptosis
The viability of BMECs was studied using the MTT assay. Changes in cell viability were observed in the samples treated with the higher concentrations of rSncb (1 ng/mL of rSncb: 84.76% ± 20.62%, P = 0.36; 50 ng/mL: 64.76% ± 10.33%, P = 0.03; 500 ng/mL: 64.29% ± 15.1%; P = 0.04) compared with the viability of the untreated cells after 24 h (Fig. 2A). Additionally, no differences in cell viability were observed after 72 h of treatment (1 ng/mL of rSncb: 102.04% ± 12.74%, P = 0.85; 50 ng/mL: 114.8% ± 7.65%, P = 0.15; 500 ng/mL: 113.78% ± 29.85%; P = 0.52) compared with that of the untreated cells.
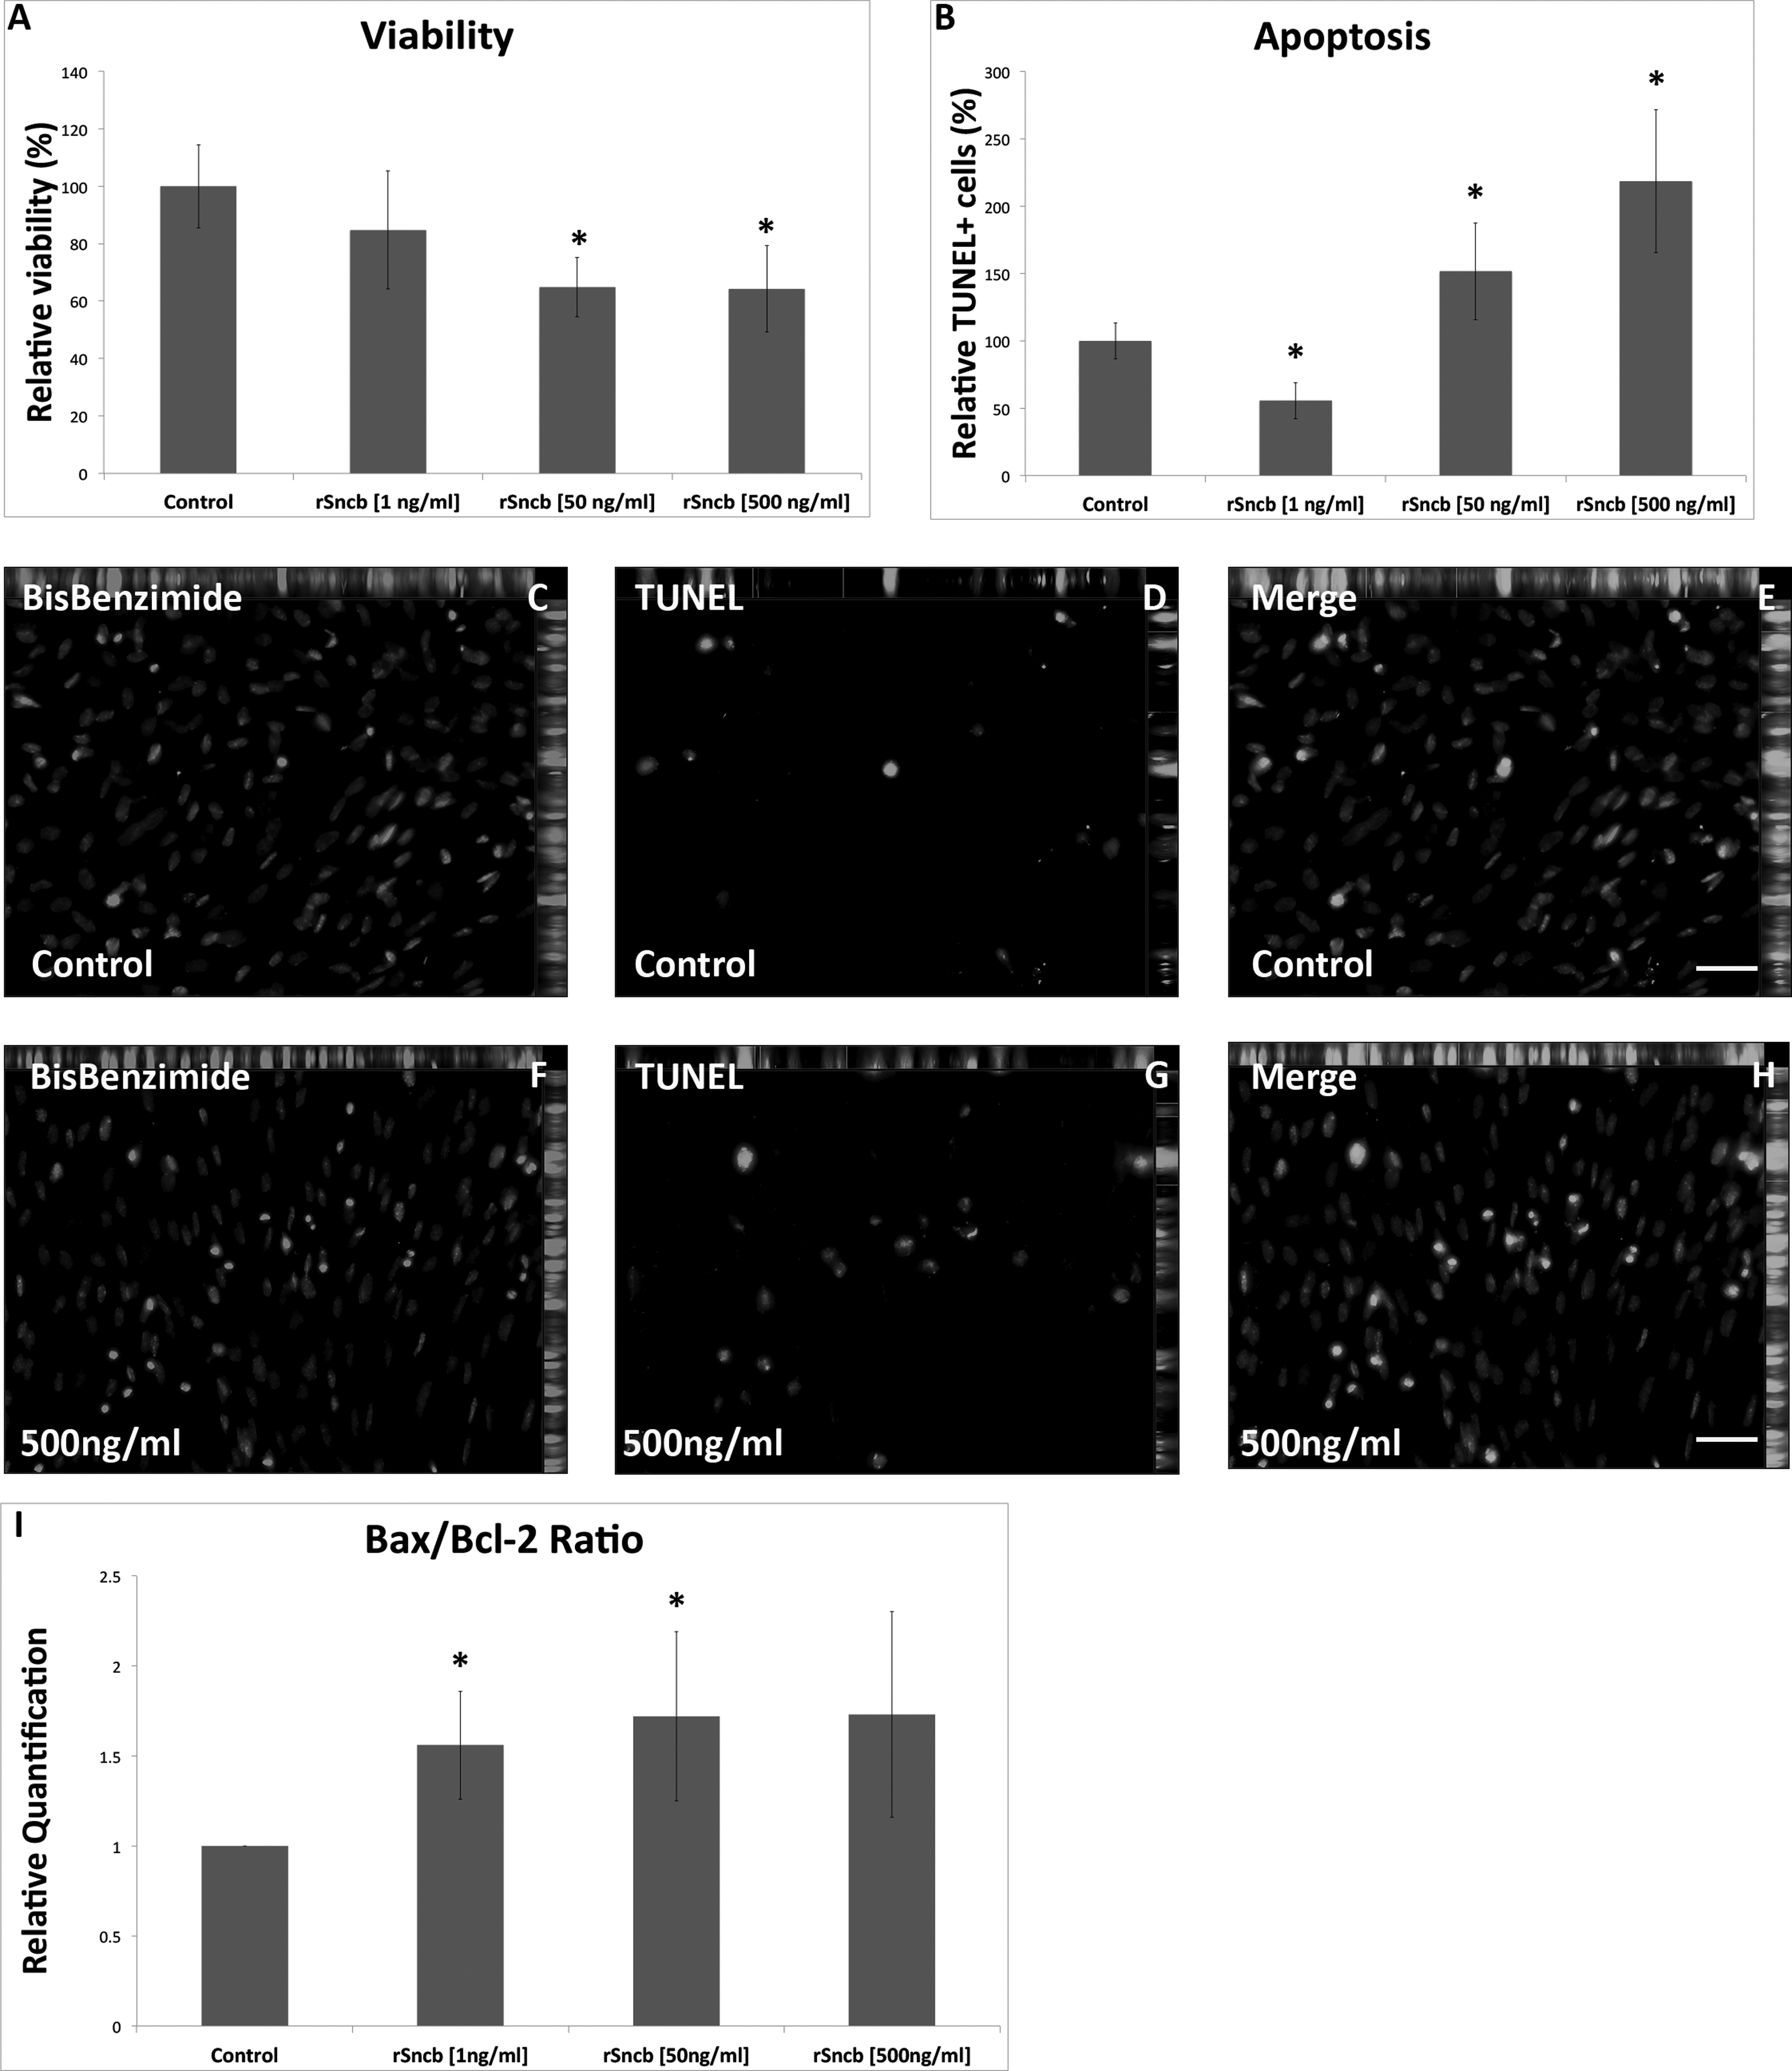
Viability and apoptosis of recombinant Sncb (rSncb)-treated brain microvascular endothelial cells (BMECs). (A) Viability of the BMECs following the treatment with rSncb was determined using the 3-(4,5- dimethylthiazol-2-yl)-2,5-diphenyl tetrazolium bromide (MTT) assay. (B-H) TUNEL assay, measuring the rate of apoptosis of rSncb-treated BMECs. BisBenzimide (blue) was used to stain cell nuclei. (I) Bax/Bcl2 ratio in the treated BMECs. Scale bars (C–H): 50 µm. * indicates P < 0.05, compared with the untreated control.
Next, the apoptosis of rSncb-treated BMECs was investigated using TUNEL assay. A significant increase in the number of apoptotic BMECs was observed in the samples treated with 50 ng/mL (151.61% ± 35.9%; P = 0.03) and 500 ng/mL of rSncb (218.64% ± 53.16%; P = 0.006), compared with that in the control sample (100% ± 13.28%). However, a significant decrease in the rate of apoptosis was observed in the sample treated with 1 ng/mL of rSncb (55.71% ± 13.53%; P=0.0008) in comparison with that measured in the control (Fig. 2B-H). Whereas no significant change in the expression of Bax (1 ng/mL of rSncb: RQ: 1.15 ± 0.19; P = 0.2; 50 ng/mL: RQ: 1.05 ± 0.14, P = 0.5; and 500 ng/mL: RQ: 0.91 ± 0.25, P = 0.53) could be detected, a conspicuous decrease in Bcl2 (1 ng/mL: RQ: 0.77 ± 0.27, P = 0.19; 50 ng/mL: RQ: 0.65 ± 0.22, P = 0.048; 500 ng/mL: RQ: 0.58 ± 0.25, P = 0.04) level in comparison with those in the control sample was observed. Bax/Bcl2 ratio level demonstrated proapoptotic effects of rSncb treatment on BMECs (Bax/Bcl2 ratio: 1 ng/mL: 1.56 ± 0.3, P = 0.03; 50 ng/mL: RQ: 1.72 ± 0.47, P = 0.05; 500 ng/mL: 1.73 ± 0.57, P = 0.08) compared with those in the untreated cells (Fig. 2I). The obtained results indicate that rSncb somewhat affects the viability and apoptosis of rBMEs. However, these effects may depend on many additional factors as well.
p53 and Mdm2 Expression Following Treatment With rSncb
IHC analyses revealed that p53 staining intensity in the nuclei and perinuclear cytoplasmic regions of BMECs increases with the applied concentration of rSncb, although IHC analyses do not represent an appropriate method for the quantification of p53 expression alterations (Fig. 3A-H). No statistically significant changes in cytoplasmic p53 levels were found in the treated group, in comparison with those in the untreated control ([1 ng/mL of rSncb] 103.5% ± 3.8%, P = 0.42; [50 ng/mL] 112.59% ± 1.58%, P = 0.056; [500 ng/mL] 110.68% ± 17.54%; P = 0.55). In contrast, an increase in the nuclear localization of p53 was observed, in comparison with that in the untreated controls ([1 ng/mL of rSncb] 227.68% ± 64.79%, P = 0.05; [50 ng/mL] 170% ± 0.54%, P = 0.003; [500 ng/mL] 103.35% ± 47.88%, P = 0.94; Fig. 3M and 3N).
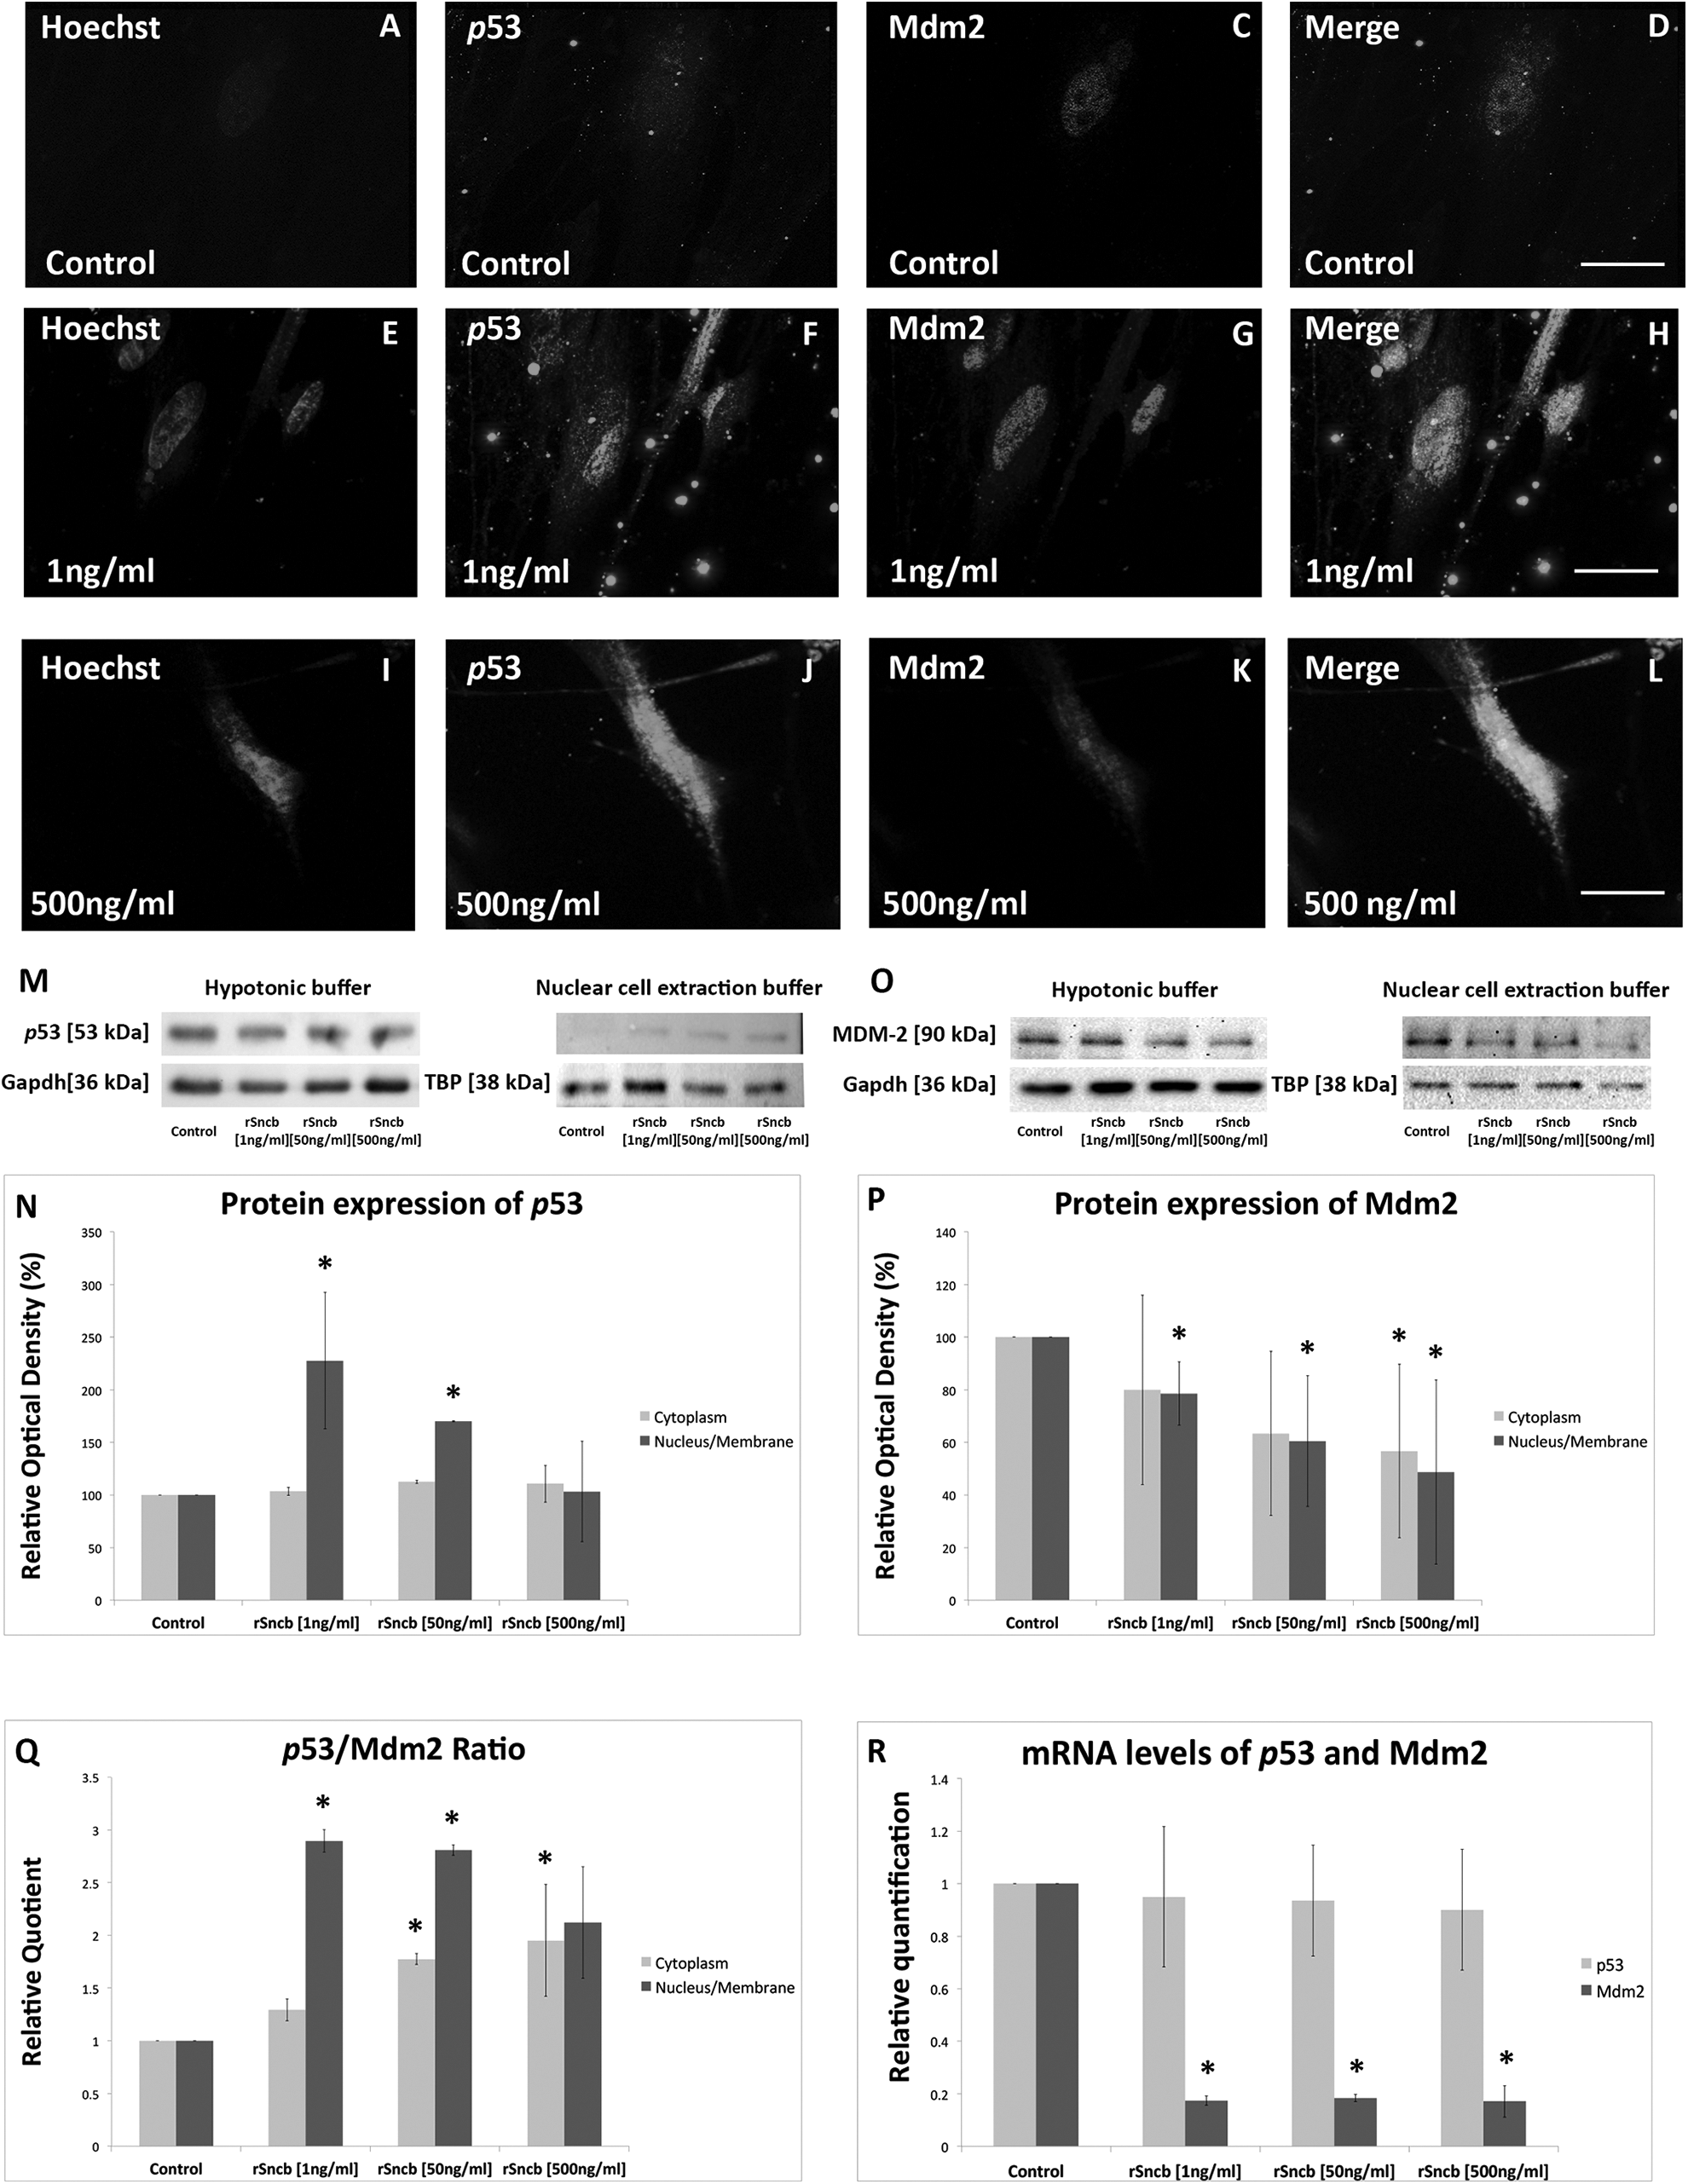
p53 and Mdm2 expression in recombinant Sncb (rSncb)-treated BMECs. (A-L) Immunohistochemistry (IHC) p53 (green) and Mdm2 (red) staining in rSncb-treated brain microvascular endothelial cells (BMECs). BisBenzimide (blue) was used to visualize cell nuclei. Secondary antibodies (green, Alexa 488; red, Alexa 594) were used to visualize antigen staining. (M-P) p53 and Mdm2 levels were determined by Western blotting. (M, O) p53 and Mdm2 expression in the cytoplasmic and nucleus/membrane fractions of rSncb-treated BMECs. Gapdh and Tbp were used as the controls. (N, P) Densitometric analyses of the results presented in (M, O). (Q) p53/Mdm2 ratio in the cytoplasm and nuclei of the treated cells. (R) p53 and Mdm2 levels in rSncb-treated BMECs, compared with those in the untreated control. Scale bars (A-L): 50 µm. *P<0.05, compared with the untreated control.
Mdm2 was mainly shown to be localized in the nuclei of BMECs, with a lower level of cytoplasmic staining observed in the control group. Following the rSncb treatment, a stronger Mdm2 staining was shown in both nuclei and cytoplasm of these cells (Fig. 3I-L). Western blot analysis demonstrated a decrease in Mdm2 levels in both cytoplasm and nucleus/membrane fractions of BMECs (cytoplasm: [1 ng/mL of rSncb] 79.95% ± 35.95%, P = 0.28; [50 ng/mL] 63.41% ± 31.16%, P = 0.058; [500 ng/mL] 56.72% ± 33.1%, P = 0.042; nucleus/membrane fraction: ([1 ng/mL] 78.61% ± 11.99%, P = 0.001; [50 ng/mL] 60.53% ± 24.92%, P = 0.003; [500 ng/mL] 48.7% ± 35.0%, P = 0.004), in comparison with those in the control (Fig. 3O and 3P).
The p53/Mdm2 level ratio revealed a significant increase in p53 levels in the cytoplasm of the treated cells (p53/Mdm2: [1 ng/mL of rSncb] 1.29 ± 0.11, P = 0.13; [50 ng/mL] 1.78 ± 0.1, P = 0.03; [500 ng/mL] 1.95 ± 0.53, P = 0.01), compared with those in the control sample. A significant increase in p53/Mdm2 ratio in the nuclei of the treated cells, compared with that in the control, was observed following the treatment of BMECs with the lower concentration of rSncb ([1 ng/mL] 2.9 ± 5.4, P = 0.04; [50 ng/mL] 2.81 ± 0.02, P = 0.05; [500 ng/mL] 2.12 ± 1.37, P = 0.25; Fig. 3Q).
p53 messenger RNA (mRNA) levels did not change compared with those in the control sample ([1 ng/mL of rSncb] RQ: 0.94 ± 0.27, P = 0.73; [50 ng/mL] RQ: 0.93 ± 0.21, P = 0.58; [500 ng/mL] RQ: 0.90 ± 0.22, P = 0.45), but Mdm2 levels decreased in the treated cells, in comparison with those in the control ([1 ng/mL] RQ: 0.17 ± 0.02, P = 0.0001; [50 ng/mL] RQ: 0.18 ± 0.01; P < 0.0001; [500 ng/mL] RQ: 0.17 ± 0.06, P = 0.002; Fig. 3R).
p19(Arf) and Pld2 Levels After rSncb Treatment of BMECs
A moderate intensity of p19(Arf) staining in the cytoplasm and the nuclei of the untreated cells was observed following the treatment with the increasing rSncb concentrations. Additionally, we observed strong p19(Arf) staining in the peripheral cytoplasm (Fig. 4A-F). Pld2 was shown to be associated with the membrane of control BMECs. Following the rSncb treatment, the staining intensity increased in the cell membrane, in comparison with that in the control sample (Fig. 4G-L). However, these are qualitative and not quantitative data.

p19(Arf) and Pld2 expression changes in recombinant Sncb (rSncb)-treated brain microvascular endothelial cells (BMECs). (A-L) Immunohistochemistry (IHC) staining of (A-F) p19 (Arf) (green) and (G-L) Pld2 (green) in rSncb-treated BMECs. BisBenzimide (blue) was used to stain cell nuclei. Secondary antibodies (green, Alexa 488) were used to visualize antigen staining. (M, N) Western blot analyses of p19(Arf) expression in cytoplasmic and nucleus/membrane fractions of rSncb-treated BMECs. Gapdh and Tbp were used as loading controls. (N) Quantitative analyses of p19(Arf) levels. (O) Expression levels of p19(Arf) and Pld2 in rSncb-treated BMECs. Scale bars (A-L): 50 µm. *P < 0.05.
Using the Western blot analyses, we demonstrated a decrease in the cytoplasmic p19(Arf) levels following the treatment with rSncb ([1 ng/mL of rSncb] 76.29% ± 15.32%, P = 0.03; [50 ng/mL] 73.95% ± 38.5%, P = 0.2; [500 ng
A significant increase in Pld2 expression levels was observed in rSncb-treated BMECs ([1 ng/mL of rSncb] RQ: 1.05 ± 0.12, P = 0.46; [50 ng/mL] RQ: 1.20 ± 0.26, P = 0.21; [500 ng/mL] RQ: 1.36 ± 0.19, P = 0.03), compared with those in the control (Fig. 4O).
rSncb Effects on Akt Expression in BMECs
IHC analyses revealed decreased Akt staining in the rSncb-treated BMECs, unlike in the untreated controls (Fig. 5A-H). In Western blots, a decrease in Akt1 levels in the cytoplasm of BMECs was seen (Fig. 5O). This decrease paralleled the overall decrease seen in the total fraction and that seen in the nucleus/membranes (Fig. 5O; cytoplasm: 1 ng/mL of rSncb] 69.42% ± 26.0%, P = 0.09; [50 ng/mL] 54.38% ± 11.78%, P = 0.004; [500 ng/mL] 50.08% ± 24.56%, P = 0.03; nucleus/membrane fraction: ([1 ng/mL] 207.2% ± 256.31%, P = 0.7; [50 ng/mL] 44.8% ± 50.3%; P = 0.36; [500 ng/mL] 16.32% ± 48.4%, P = 0.25; Fig. 5O and 5P). Moreover, a decrease in pAkt under the influence of increased SNCB concentrations in hypotonic buffer lysates (Fig. 5Q and 5R) (cytoplasm: 1 ng/mL of rSncb] 70.71% ± 22.12%, P = 0.08; [50 ng/mL] 63.4% ± 10.51%, P = 0.006; [500 ng/mL] 58.0% ± 9.7%; P = 0.02). In nuclear extraction buffer, a tendentious increase in pAkt was found in treated BMECs compared to controls (Fig. 5Q and 5R; nucleus/membrane fraction: ([1 ng/mL] 119.86% ± 10.93%, P = 0.04; [50 ng/mL] 134.97% ± 27.62%; P = 0.09; [500 ng/mL] 208.03% ± 111.3%; P = 0.15).

Akt and pAkt expression alteration in rSncb-treated brain microvascular endothelial cells (BMECs). (A-H) Immunohistochemistry (IHC) staining of RAC-alpha serine/threonine-protein kinase Akt (green), (Akt; green), and Sncb (red) in the treated and untreated BMECs. (I-N) IHC staining of Phosphorylated RAC-alpha serine/threonine-protein kinase (pAkt; red) in the treated and untreated BMECs. BisBenzimide (blue) was used to visualize cell nuclei. Secondary antibodies (green, Alexa 488; red, Alexa 594) were used to visualize antigen staining. (O, P) Western blot analyses of Akt expression in 2 hypotonic buffer lysates showing a concentration-dependent decrease of Akt. (Q, R) pAkt expression in cytoplasmic and nucleus/membrane fractions of rSncb-treated BMECs, respectively. Gapdh and Calnexin were used as loading controls. Scale bars (A-H): 50 µm, (I-N): 20 µm *P < 0.05, compared with the untreated control.
As anticipated from the tendentious changes induced by Sncb, no detectable alterations of pAkt staining were found immunocytochemically in treated BMECs compared to control (Fig. 5I-N).
Hmox and Nox4 Expression Following Treatment With rSncb
Anti-inflammatory properties of rSncb were examined by analyzing Hmox and Nox4 levels, while its antioxidant properties were investigated by analyzing the changes in Glutamate—cysteine ligase catalytic subunit (Gclc) and Glutamate-cysteine ligase regulatory subunit (Gclm) expression in BMECs. With increased rSncb concentrations, Hmox staining intensity increased in the nuclei and cytoplasm of the treated BMECs, compared with that in the untreated controls (Fig. 6A-I). At the mRNA level, Hmox expression did not change significantly compared with that in the controls ([1 ng/mL] RQ: 1.25 ± 0.32, P = 0.32; [50 ng/mL] RQ: 1.17 ± 0.21, P = 0.3; [500 ng/mL] RQ: 1.03 ± 0.26; P = 0.86). Although Gclc expression levels remained unchanged almost in the treated cells ([1 ng/mL] RQ: 1.01 ± 0.13, P = 0.91; [50 ng/mL] RQ: 0.91 ± 0.08, P = 0.21; [500 ng/mL] RQ: 0.78 ± 0.23, P = 0.24), a decrease in the expression of Gclm ([1 ng/mL] RQ: 0.78 ± 0.08, P = 0.04; [50 ng/mL] RQ: 0.76 ± 0.06, P = 0.026; [500 ng/mL] RQ: 0.61 ± 0.24; P = 0.1) and NOX4 ([1 ng/mL] RQ: 0.52 ± 0.19, P = 0.049; [50 ng/mL] RQ: 0.79 ± 0.71, P = 0.66; [500 ng/mL] RQ: 0.76 ± 0.73, P = 0.62), compared with that in the control, was observed (Fig. 6J).

Hmox, Gclc, Gclm, and Nox4 expression in recombinant Sncb (rSncb)-treated brain microvascular endothelial cells (BMECs). (A-I) Immunohistochemistry (IHC) Hmox1 (red) staining of rSncb-treated BMECs. BisBenzimide (blue) was used to visualize cell nuclei. Secondary antibodies (green, Alexa 488; red, Alexa 594) were used to visualize antigen staining. (J) Hmox, Gclc, Gclm, and Nox4 expression levels in rSncb-treated BMECs, relative to those in the untreated control. Scale bars (A-I): 50 µm. *P < 0.05, compared with the untreated control.
Sncb Knockdown
Although immunocytochemical images are not quantifiable, the fluorescence intensity of both SNCA and SNCB is visibly diminished following the siRNA-mediated Sncb knockdown in BMECs (Fig. 7A-H). The treatment with 1 nM Sncb-siRNA led to a 45% decrease in Sncb levels, compared with those in the control (P = .02). However, this did not alter Snca expression (70% ± 33%) in BMECs, compared with that in the control (P = 0.97; Fig. 7I).

Effects of β-synuclein (Sncb) knockdown on the viability and apoptosis rate of brain microvascular endothelial cells (BMECs) and the expression of different proteins. (A-H) Immunohistochemistry (IHC) analysis of α-synuclein (Snca; green) and Sncb (red) expression in Sncb-small interfering RNA (siRNA)-treated BMECs. BisBenzimide (blue) was used to visualize cell nuclei. Secondary antibodies (green, Alexa 488; red, Alexa 594) were used to visualize antigen staining. (I) Snca and Sncb levels in 2 Sncb-siRNA-treated BMECs, relative to those in the untreated control. (J) The viability of Sncb-siRNA-treated BMECs was evaluated using 3-(4,5- dimethylthiazol-2-yl)-2,5-diphenyl tetrazolium bromide (MTT) assay. (K-Q) TUNEL assay, performed using Sncb-siRNA-treated BMECs. BisBenzimide (blue) was used to visualize cell nuclei. (R) Bax/Bcl2 ratio in these cells. Scale bars (A-H, K-P): 50 µm. *P < 0.05, compared with the untreated control.
Sncb-siRNA treatment did not lead to any alterations in cell viability (99.8% ± 9.3%), compared with that in the control, P = 0.98; Fig. 7J). However, a significant reduction in the number of TUNEL-positive cells was observed following the treatment with Sncb-siRNA-treated BMECs (23.5% ± 11.24%), in comparison with that in the control (100% ± 35.3%, P = 0.009; Fig. 7K-Q). Bax/Bcl2 ratio revealed a slight proapoptotic switch of Sncb-siRNA-treated BMECs (RQ: 1.32 ± 0.22) compared to the controls sample (P = 0.004; Fig. 7R). The presented results confirm the previously obtained results. The contradictory switch of Bax/Bc-2 ratio toward apoptosis presumes that these observations may depend on additional factors as well.
The data are summarized in a comprehensive table in the supplements of this article (Supplemental Table 2).
Discussion
To the best of our knowledge, this is the first study to investigate the effects of Sncb on BMECs in vitro. Here, we demonstrated that these cells of the neurovascular unit are affected by Sncb expression changes and that this protein interacts with Snca, downregulating its expression in BMECs. Sncb may contribute to the induction of apoptosis by p53 activation and may be independent of Akt activation, suggesting its role as a stress-induced molecule in BMECs. The increase in p19(Arf) expression may lead to the inhibition of Mdm2 translocation from the nucleus and the resulting stabilization of p53, while the activity of Pld2 is affected by Sncb levels as well, and it is very likely independent of p53 stabilization and Akt activation. Furthermore, we demonstrated that the increase in the anti-inflammatory Hmox activity may be mediated by Nox4. Finally, we showed that Sncb expression knockdown leads to a decrease in the apoptosis rate and the downregulation of Snca levels, which supports previously obtained results.
The results obtained in this study support the role of Sncb in the age-related endothelial pathophysiological processes. The used concentrations were calculated according to bibliography showing Sncb concentrations in cerebrospinal fluid (CSF) under physiological conditions (98.2-627 pg/mL, est. median 250 pg/mL) compared to that in neurodegenerative diseases like Creutzfeldt–Jakob disease (CJD; 175–25,000 pg/mL, est. median 400 pg/mL) 24 . The bibliographic data were confirmed by additional pilot studies, which were used to calibrate the effects of different Sncb concentrations in BMECs. It is to be noted that the lowest concentrations of Sncb used within this study are slightly higher than the lowest concentrations detected in CSF of control groups and comparable to that reported in CJD disease. 24 We hypothesize that an overexpression and potential accumulation of Sncb within neuronal tissue occurs during a lifetime as well as in neurodegenerative diseases. This may have an impact on the aging neurovascular unit as well as the onset and progression of neurodegenerative diseases resulting in the mentioned pathophysiological conditions.
Recent studies demonstrated that the overexpression of Sncb affects Snca expression levels, and these effects are dose dependent, which supports the hypothesis that the anti-Parkinson’s effects of Sncb are related to the inhibition of SNCA expression, not its aggregation 25 . Our results confirm that the expression of Snca is affected by the exogenous addition of rSncb, and while lower concentrations of Sncb were shown to induce Snca expression, higher concentrations lead to a decrease in Snca expression at the protein levels, as indicated by immunostaining, and mRNA levels. These data indicate that the response of the endothelial component of CNS to synucleins is similar to that of the neuronal cells.
The data presented here show concentration-dependent effects on apoptosis related to rSncb-exposed BMECs. Lower concentrations of rSncb result in decrease of apoptosis and unchanged viability. In contrast, a decrease in viability and increase in BMEC apoptosis rate were found in groups with higher concentrations of rSncb. Bax/Bcl2 ratio did reveal a proapoptotic effect, the activation of p53 may play a role in the observed reduction of Bcl2 expression and the inhibition of antiapoptotic Bcl2 and Bax heterodimer formation. 26 The observation of an unaltered Bax/Bcl-2 ratio together with an elevation of the apoptosis rate in the group with higher rSncb concentrations presume other effects of Sncb on BMECs. This suspects additional and multiple effects of differential concentrated rSncb on BMECs. The data are consistent with neuroprotective effects on BMECs mediated by exposure to lower rSncb, while higher concentrations align proapoptotic response. These data confirm a recent study that documented higher amounts of SCNB in CSF of patients with neurodegenerative diseases compared to control. 24
These findings contradict the previously observed and generally accepted neuroprotective properties of Sncb. However, Sncb may have different properties in CNS, including the promotion of BBB breakdown and pathophysiological processes in the brain.
P53 signaling is proapoptotic and its activation leads to the transcriptional activation of different proapoptotic genes and other processes in the cell. In contrast to this, Akt signaling has prosurvival properties. 27 Different physiological stimuli may lead to the induction of Akt activation through the phosphatidylinositide 3-OH kinase activation or through its overexpression. 27 –29 Recent studies showed the crosstalk between p53 and Akt, indicating that Akt inhibition leads to the inactivation of MDM2 and p53 activation, resulting in irreversible apoptotic cell death 27 . The increase in p53 levels, observed in this study, together with the increase in the activated pAkt presume that Sncb does not inhibit Akt activity. In summary, the data presume an Akt-independent apoptosis within rSncb-exposed BMECs. The increase in pAkt and its mediated prosurvival function presume a role as contrary and secondary regulation related to the activation of proapoptotic p53. The obvious difficulties to quantitatively assess immunofluorescence images and to assume an increase in p53 staining on BMECs exposed to higher concentrations of rSncb and are confirmed with the performed protein expression which only marginally fits to a significantly increase in a p53-mediated by the response of BMECs to higher concentrated rSncb. However, the proapoptotic properties mediated by Sncb seem to be independent of activated Akt.
MDM2 translocates between the cytoplasm and nucleus and promotes p53 degradation via the proteasome pathway. 30 –34 The results obtained here reveal a decrease in Mdm2 levels in the cytoplasm following the treatment of BMECs with the exogenous rSncb, which suggests that p53 activation is mediated by Mdm2 inhibition. Moreover, Sncb treatment-related increase in p19(Arf) expression was observed, and this protein was shown to be involved in the stabilization of p53 by inhibiting nucleocytoplasmic shuttling of Mdm2, 33 which was supported here as well.
Redistribution of PLD2 from the plasma membrane to secretory granules and then to exosomes occurs during cell stimulation in neutrophils or fibroblasts. 35 The results showing an increase in Sncb levels agree with the observations showing that Pld1 and Pld2 mediate the stabilization of p53, which results in prosurvival signaling. 36 A recent study suggested that the increase in the PLD activity does not stimulate Pi3K/Akt survival pathway. 36 The observed activation of Akt in rSncb-treated BMECs agrees with the results of the studies reporting that the Akt pathway is independent of the PLD activity 36 . We suggest that the Sncb-related activation of Pld2 may result in the Mdm2 inhibition-mediated p53 activation and in the Pld2-independent Akt activation.
Furthermore, we demonstrated an anti-inflammatory response to rSncb treatment, through an increase in Hmox levels and the inhibition of Nox4 expression. A recent study indicated that Hmox is involved in the maintenance and establishment of the vascular bed, as it is involved in the protection of vessels from oxidative injury. 37 Increased susceptibility to lipid-induced oxidative cell injuries in vascular endothelial and smooth muscle cells was detected in the Hmox1 knockout mice. 38 Moreover, the upregulation of Hmox1 and its metabolite, carbon monoxide, was shown to stimulate angiogenesis/vasculogenesis through the increased synthesis of proangiogenic factors 39,40 . Therefore, we demonstrated the antioxidative role of Sncb in BMECs.
Nox4 is an important inducible modulator of redox signaling in many cell types, such as vascular walls, vascular smooth muscle cells, fibroblasts, and endothelial cells. In contrast to other Nox enzymes, Nox4 is constitutively active, and it was reported to be expressed in the adult heart, as a part of the adaptive stress response to pathophysiological insult. 41,42 Moreover, Nox4 expression was shown to increase in stress-induced monocyte priming and dysfunction, which is associated with accelerated atherosclerosis and the progression of atherosclerotic plaques. 43 Nox4 was reported to be involved in the development of age-related cardiovascular diseases, 44 and although it contributes to oxidative stress injuries, compelling evidence from Nox4−/− mice indicates that endogenous Nox4 protects the vasculature during ischemic or inflammatory stress. 42 We showed the downregulation of Nox4 expression in BMECs exposed to lower concentrations of rSncb. The downregulation of Nox4 activity due to the induction of Hmox may be mediated by carbon monoxide generated during the heme degradation process. Hmox together with Gclc, is involved in the redox protection and acts as the target of the integrated stress response. 45 The missing downregulation of Nox4 in BMECs exposed to higher concentrations of rSncb may be attributed to induced cellular stress related to Sncb, and hence to activation of NOX4 expression. We did not observe any changes in Gclc expression, indicating that rSncb-induced stress response may result in the Hmox overexpression and is not related with Nox4 or Gclc expression alterations.
Finally, we demonstrated that the knockdown of Sncb expression leads to a decrease in BMEC apoptosis and the downregulation of Snca expression.
Conclusions
The data obtained in this study are consistent with a variety of roles of Sncb in BMECs in vitro. Protective effects on cells exposed to lower concentrations of rSncb used in this study may reflect the potential role of Sncb within the neurovascular unit in both physiological aging and neurodegeneration. Assuming an overexpression and/or accumulation of SNCB in ongoing pathophysiological conditions, the observed effects on BMECs exposed to higher concentrations of rSncb presume its stress-related properties in neurodegenerative diseases. However, we suggest that Sncb-induced increase in p53-mediated and Akt-independent apoptosis may induce the increase in apoptosis of BMECs in the neurovascular unit. Hmox and Nox4 expression level changes indicate the activation of stress-related response to rSncb treatment. Further studies of the molecular mechanisms underlying the age- and dose-dependent role of Sncb may help understand the contribution of synucleins to neurodegenerative diseases.
Supplementary Material
Supplemental Material, Table_2_Suppl - Age-related Beta-synuclein Alters the p53/Mdm2 Pathway and Induces the Apoptosis of Brain Microvascular Endothelial Cells In Vitro
Supplemental Material, Table_2_Suppl for Age-related Beta-synuclein Alters the p53/Mdm2 Pathway and Induces the Apoptosis of Brain Microvascular Endothelial Cells In Vitro by Katrin Brockhaus, Michael R. R. Böhm, Harutyun Melkonyan and Solon Thanos in Cell Transplantation
Footnotes
Authors’ Note
Katrin Brockhaus and Michael R. R. Böhm contributed equally to this manuscript.
Acknowledgments
The authors thank Mechthild Wissing and Mechthild Langkamp-Flock for their skillful technical assistance, Ronja Sommer for typing of the manuscript, and Editage by Cactus (Wolters Kluwer) for native linguistic editing of the manuscript.
Ethical Approval
This study was approved by our institutional review board. (LANUV, NRW, Germany: Permission No.: 84-02.05.20.13.128 from November 26th, 2013).
Statement of Human and Animal Rights
The use of material of animals was justified by the local review board of the government.
Statement of Informed Consent
There are no human subjects in this article and informed consent is not applicable.
Declaration of Conflicting Interests
The author(s) declared no potential conflicts of interest with respect to the research, authorship, and/or publication of this article.
Funding
The author(s) disclosed receipt of the following financial support for the research, authorship, and/or publication of this article: This study was supported by the Innovative Medical Research (IMF) grant awarded by the School of Medicine, Westfalian Wilhelms-University of Münster (I-Bo 221307 to MRRB), and a German Research Foundation (DFG) grant (BO 4556/1 -1 to MRRB and Th 386/20 -1 to ST).
Supplementary Material
Supplementary material for this article is available online.
References
Supplementary Material
Please find the following supplemental material available below.
For Open Access articles published under a Creative Commons License, all supplemental material carries the same license as the article it is associated with.
For non-Open Access articles published, all supplemental material carries a non-exclusive license, and permission requests for re-use of supplemental material or any part of supplemental material shall be sent directly to the copyright owner as specified in the copyright notice associated with the article.