
Abstract
Introduction
The consumption of vegetables is a key route for increasing the content of potentially toxic heavy metals in the food chain. This article aimed to quantify the concentrations of As, Se, Cd, Cr, Co, Cu, Ni, and Pb in different parts of vegetables harvested from Erbil city.
Methodology
The total concentrations of As, Cd, Cr, Co, Cu, Ni, and Pb in various vegetable parts were pursued by ICP-MS analysis.
Results
The values of heavy metals in different parts of the analyzed vegetables ranged from 0.052 to 2.106 mg/kg for As, 0.024 to 5.899 mg/kg for Se, 0.014 to 0.753 mg/kg for Cd, 0.441 to 89.400 mg/kg for Cr, 0.052 to 2.693 mg/kg for Co, 0.737 to 39.120 mg/kg for Cu, 0.301 to 63.880 mg/kg for Ni, and 0.032 to 1.782 mg/kg for Pb. The Hazard Quotient (HQ) values for As, Cr, Cu, and Ni in the edible parts of most vegetables exceeded one, while those for Se, Co, Cd, and Pb were below one.
Discussion
In contrast to Se, Co, Cd, and Pb, the HQ values for As, Cr, and Pb indicate a potential health risk when consuming these edible parts of the vegetables. The Hazard Index (HI) for all edible parts of the analyzed vegetable samples exceeded one. The cancer risk (CR) of As, Cd, Cr and Ni were higher than 1.0 × 10⁻⁴ which indicating carcinogenic risk. As a result, regular consumption of these vegetables is regarded as unsafe and not advisable.
Introduction
Vegetables form a major part of the daily diet for the majority of the global population. 1 Although the consumption of leaved vegetation has increased in public areas, 2 these vegetables are often contaminated by heavy metals including As, Se, Cd, Cr, Co, Cu, Ni, and Pb.3–9 The environmental exposure to trace elements induces risks to human well-being. It is widely acknowledged that the presence of heavy metals significantly affects mankind’s diet chain, especially vegetation.10–12,13
The movement of pollutant metals through soil and water raises significant concerns regarding public health, agricultural productivity, and ecological stability.14,15,10 The movement of heavy metals from soil to plants is largely influenced by many parameters, such as the types of sources, seasonal variations, application rates, soil pH, temperature, moisture, redox potential, texture, organic content, different forms of available metals, nutritional content, various plant species and the total concentration of metals present.16–19
As is one of many carcinogens that cause serious diseases, compromising the structure of human cells and genetic components after being exposed. A wide range of health issues, including cancers, cardiovascular problems, pulmonary, immune, and endocrine dysfunctions, reproductive system concerns, nervous system disorder, hepatic dysfunction, digestive tract issues, genetic toxicity, chronic As toxicity, and skin diseases, have been linked to inorganic As poisoning.20–22 Excessive Cd levels can lead to complications in the respiratory system, as well as cardiac and kidney issues. High exposure to Cr can result in various health problems, including kidney tubular damage, skin irritation, lung carcinoma, and nasal septum hole. However, Cr also plays a role in certain biochemical processes, including insulin secretion control and animal lipid metabolism. 23 Co is used to treat anemia in women in pregnancy by promoting erythropoiesis. A deficiency in Co can lead to severe anemia, extreme tiredness, breathlessness, and underactive thyroid. However, excessive cobalt Co exposure may cause adverse effects such as congestive heart failure, respiratory conditions, cardiovascular muscle disorder, erythrocytosis, and skin inflammation. 24 Excessive bioaccumulation of Pb can lead to high blood pressure and chronic damage to the cerebrum and renal organs25,26,27,28 This work aimed to evaluate the levels of heavy metals in different parts of vegetables and assess the potential health risks associated with their everyday consumption.
Material and Methods
Sample collection
Thirteen different vegetable samples, including roots, stems, leaves, pods, and more, were collected from local agricultural farms in Erbil city between March-April 2024 which is a suitable season of the year for farming vegetables. Supplemental Table 1 shows the specifics of the analyzed vegetables. Vegetable samples were collected from different farms in Erbil city, Northern Iraq, and categorized into two groups: wild vegetables and cultivated ones. The wild vegetables were gathered from four distinct remote areas where they grew naturally. In contrast, seven cultivated vegetables (Raphanus sativus, Solanum tuberosum, spinach, Lepidium sativum , Allium kurrat. schweinf, Apium graveolens, Allium fistulosum, Beta vulgaris subsp, Mentha longifolia) were collected from a single farm near the municipal area of Erbil city, while the Vicia Faba sample was obtained from an individual farm. Milli-Q water was used to rinse the vegetable specimens and kept in a plastic container. After harvesting, the vegetable samples were divided into roots and leaves then they were frozen in freezer set at −20°C for 12 hours, then transferred to freeze-drying equipment for 48 hours at −40°C. The dehydrated compartments of vegetable specimens were milled into a fine powder with a particle size of 180 µm. The grounded products were then kept in sealable plastic bags at ambient temperature until examined.
Digestion procedure for dry vegetable samples
The vegetable samples were subjected to acid digestion using a Mars Xpress microwave lab station (CEM, Matthews, NC, USA) using 100 mL Teflon vessels with Teflon covers. 0.25 g of dried vegetable compartments (root, stem, leaf, pod, etc.) were weighted in triplicate and transferred into individual Teflon tubes. Next, 5 mL of HNO3 (70%, Merck, Darmstadt, Germany) and 2 mL of H2O2 (30%, Sigma Chemicals, UK) were introduced, and the containers were closed. The samples were subsequently digested for a total duration of 43 minutes at 1600 W. In the first step of digestion, the temperature was gradually raised to 160°C over 15 minutes and maintained at that temperature for an additional 5 minutes. During the second step, the temperature was raised from 160°C to 200°C in 8 minutes and held at 200°C for 15 minutes. The Teflon reaction vessels were allowed to cool to room temperature following digesting. Following digestion, the samples were gently moved into pre-rinsed 25 mL volumetric flasks and diluted to 25 mL with 2% (v/v) HNO3, prepared with Milli-Q water. In and Ir (final content of 10 μgl-1) were added to the solution as internal reference materials.21,29,30 Blank samples were prepared following the same procedure as the sample preparation, but without the inclusion of the target analytes.
Stock solutions, concentration range of calibration curves
Standardized calibration solutions of As, Se, Cd, Cr, Cu, Co, Ni, and Pb were denoted using a stock solution of a multi-element which is purchased from CPI Internationals (USA) using 2% HNO3. The calibration curve values were selected to align with the expected contents of all metals in the different compartments of the vegetable specimens analyzed using ICP-MS. The calibration standards were made by diluting the stock solution of multi-elements to the following concentrations: 5, 10, 20, 50, and 200 µg L-1.
Instrumentation
The ICP-MS analysis was performed using an Agilent 7500 instrument (USA) for measuring the total content of As, Se, Cd, Cr, Co, Cu, Ni and Pb in various dried parts of edible vegetables, with the operating conditions provided in Supplemental Table 2. The mass spectrometer was configured to measure the counts per second using the Peak transition setting for the analyzed masses: 75As, 78Se, 112Cd, 52Cr, 59Co, 65Cu, 60Ni, and 208Pb.
Limit of detection
The Limit of Detection (LOD) of the instrument was evaluated using equation (1), by dividing the three times standard deviation (SD) of six blank (b) absorbance replicates by the slope (m) of the calibration curve. The LOD values for ICP-MS (in mg/kg) were: As (0.01), Se (0.002), Cd (0.002), Co (0.01), Cr (0.01), Cu (0.001), Ni (0.02), and Pb (0.01), all of which are appropriate for measuring minor minerals in various parts of the vegetable.

Statistical analysis
Using the SPSS program, a one-way ANOVA analysis was performed on the data. 31 The results include means and standard error, using descriptive statistics. Duncan’s test was performed to identify significant differences between the various parts of analysed vegetables at 0.05 levels. 32 The two certified reference materials (CRMs) including GBW10015-spinach and Pine Needles 1575a were analysed using One-sample T-test comparison and the Allium kurrat. Schweinf was analysed using Independent-samples T-test.
Quality control of method
The ICP-MS instrument was calibrated with standard solutions while the analysis was being conducted to ensure procedure quality control used for determining heavy metals in vegetables. A triplicate of each sample were analysed. In and Ir (10 µg L-1) accounted for instrument deviation (due to factors like sample viscosity, mass transport, etc.) during the measurement process using ICP-MS. The method’s accuracy for detecting As, Se, Cd, Co, Cr, Cu, Ni, and Pb in various parts of vegetable species was validated using CRMs: GBW10015-spinach (Institute of Geophysical and Geochemical Exploration, Langfang, China) and Pine Needles 1575a (National Institute of Standards and Technology, NIST, USA). Supplemental Table 3 presents the digestion results of the total levels of As, Se, Cd, Co, Cr, Cu, Ni, and Pb in the analyzed CRMs. The digestion efficacy ranged between 90 and 111 % and 89 and 111 for GBW10015-spinach and Pine Needles 1575a, respectively. The mineral values acquired from the trial were in good agreements with the certified values for both CRMs namely GBW10015 spinach and Pine Needle 1575a.
Health risk assessment
To assess the health risks of heavy metals in individuals from the consumption of different compartments of various vegetables in Erbil city, this study evaluated the EDI, HQ, and HI.
EDI
EDI is a measure of the quantity of a specific heavy metal that a person ingests daily through food, water, or other environmental sources. It is usually expressed in mg/kg body weight/day. The amount of EDI was determined using the subsequent formula33,34

HQ
HQ is the quantitative assessment of the possible non-cancerous impacts of specific toxic metals.
36
HQ is used to measure the promise impacts of individual heavy metals on humans due to prolonged exposure through vegetable consumption and estimated as the ratio of EDI to the reference dose (RfD) using the subsequent formula
37
:

The RfD for As, Se, Cd, Cr, Co, Cu, Ni, and Pb are 0.0003, 0.005, 0.001, 0.003, 0.02, 0.0371, 0.02, and 0.004 mg/kg body weight/day, sequentially.38–41
HI
The HI is computed based on the daily mean vegetable ingestion for individuals (adults) to assess the possible harmful or negative health impacts due to the combined presence of chemical metals in the vegetables. HI is computed as the summation of HQ of each individual metal in vegetables utilizing the subsequent relationship42,34:-


If the HI value is below 1, the exposure dose is considered lower than the level that could trigger harmful effects; however, if the HI exceeds 1, there is a potential risk that toxic metals may adversely impact human health. 36
CR
The CR associated with the ingestion of each heavy metal can be estimated using the following formula
4
:

Results and discussion
Heavy metals in different organs of studied vegetable
Concentrations of As, Se, Cd, Cr, Co, Cu, Ni, and Pb on dry mass scale (mg/kg) in different parts of Raphanus sativus, Solanum tuberosum, Malva parviflora, Arum spp, Spinacia oleracea, Gundelia tournefortii, Lepidium sativum, Allium kurrat. Schweinf, Apium graveolens, Allium fistulosum, Beta vulgaris subsp, Vicia Faba and Mentha longifolia using ICP-MS.

Raphanus sativus
The concentrations of As, Se, and Cr in the Raphanus sativus followed similar descending trends: root > core > skin > stem > leaf (Table 1). Specifically, the concentrations were as follows: for As, root (0.746 mg/kg) > core (0.678 mg/kg) > skin (0.404 mg/kg) > stem (0.346 mg/kg) > leaf (0.260 mg/kg); for Se, root (0.192 mg/kg) > core (0.181 mg/kg) > skin (0.167 mg/kg) > stem (0.102 mg/kg) > leaf (0.085 mg/kg); and for Cr, root (0.147 mg/kg) > core (0.151 mg/kg) > skin (0.118 mg/kg) > stem (0.116 mg/kg) > leaf (0.095 mg/kg), respectively. The concentration of Cr in various compartments of Raphanus sativus was: stem (6.139 mg/kg) > leaf (5.505 mg/kg) > skin (2.811 mg/kg) > core (2.807 mg/kg) > root (2.802 mg/kg). For Co, the levels were: skin (0.868 mg/kg) > root (0.841 mg/kg) > core (0.793 mg/kg) > stem (0.678 mg/kg) > leaf (0.549 mg/kg). The Cu contents were: core (3.547 mg/kg) > root (3.413 mg/kg) > skin (2.962 mg/kg) > stem (2.836 mg/kg) > leaf (2.203 mg/kg). For Ni, the order was: skin (6.442 mg/kg) > stem (5.598 mg/kg) > leaf (4.652 mg/kg) > core (4.578 mg/kg) > root (4.652 mg/kg). Lastly, Pb concentrations were: root (0.179 mg/kg) > stem (0.163 mg/kg) > leaf (0.143 mg/kg) = core (0.143 mg/kg) > skin (0.139 mg/kg).
The contents of Cd (0.147 mg/kg), Cr (2.802 mg/kg), Cu (3.413 mg/kg), Ni (4.448 mg/kg), and Pb (0.179 mg/kg) in Raphanus sativus roots were lower than those reported in literature, which found levels of 0.45, 5.73, 35.8, 8.25 and 19.4 mg/kg, respectively. On the other hand, the concentrations of Cd and Pb in the stem of Raphanus sativus were lower than the values obtained by the work which were 0.19 mg/kg for Cd and 1.88 mg/kg for Pb. However, the values of Cr (6.139 mg/kg), Cu (2.836 mg/kg) and Ni (5.598 mg/kg) in the root of Raphanus sativus of this study were higher compared to the same heavy metals which were 0.28 mg/kg for Cr, 1.91 mg/kg for Cu, and 0.84 mg/kg for Ni. 45
Solanum tuberosum
The concentration of As in different parts of the Solanum tuberosum in the following manner: stem (0.303 mg/kg) > leaf (0.223 mg/kg) > skin (0.178 mg/kg) > root (0.152 mg/kg) > core (0.052 mg/kg) (Table 1). The concentrations of Se and Ni in the Solanum tuberosum followed similar descending patterns: leaf > stem > root > skin > core. Specifically, the concentrations were Se: leaf (0.122 mg/kg) > stem (0.102 mg/kg) > root (0.079 mg/kg) > skin (0.052 mg/kg) > core (0.024 mg/kg), and Ni: leaf (7.515 mg/kg) > stem (5.502 mg/kg) > root (5.392 mg/kg) > skin (1.242 mg/kg) > core (0.428 mg/kg). The concentrations of Cd, Cr, Co, and Pb in the Solanum tuberosum followed a corresponding descending arrangement: leaf > root > stem > skin > core. The values were as follows: Cd: 0.123 mg/kg, 0.100 mg/kg, 0.095 mg/kg, 0.085 mg/kg, and 0.047 mg/kg; Cr: 3.866 mg/kg, 3.111 mg/kg, 2.552 mg/kg, 1.369 mg/kg, and 0.441 mg/kg; Co: 1.831 mg/kg, 1.318 mg/kg, 0.764 mg/kg, 0.179 mg/kg, and 0.052 mg/kg; Cu: 6.986 mg/kg, 4.965 mg/kg, 2.403 mg/kg, 2.093 mg/kg, and 0.737 mg/kg, sequentially. Finally, the levels of Pb were as the following arrangement: leaf (0.160 mg/kg) > stem (0.138 mg/kg) > skin (0.131 mg/kg) > root (0.126 mg/kg) > core (0.032 mg/kg). The contents of As (0.052 mg/kg), Cd (0.047 mg/kg), Cr (0.441 mg/kg), Cu (0.737 mg/kg) and Pb (0.032 mg/kg) in this study are within the range of literature values which are 0.01–0.25, 0.001–0.048, 0.008–0.802, 0.022–29.894 and 0.006 to 0.215 mg/kg, respectively and the Ni concentration (0.428 mg/kg) also exceeded the reported value of 0.006–0.419 mg/kg. 46
Malva parviflora
The quantities of As, Se, Cd, Cr, Co, Cu, Ni, and Pb in Malva parviflora were compartmentalized into two distinct patterns across various organs of the plant (Table 1). The first descending pattern was leaf > stem > root, with the following values: As: 0.540 mg/kg, 0.265 mg/kg, and 0.144 mg/kg; Se: 0.073 mg/kg, 0.030 mg/kg, and 0.026 mg/kg; Cd: 0.753 mg/kg, 0.038 mg/kg, and 0.029 mg/kg, respectively. The second descending pattern followed leaf > root > stem with the following values: Cr: 1.906 mg/kg, 1.854 mg/kg, and 1.449 mg/kg; Co: 0.223 mg/kg, 0.194 mg/kg, and 0.144 mg/kg; Cu: 10.170 mg/kg, 3.971 mg/kg, and 2.694 mg/kg; Ni: 1.845 mg/kg, 1.726 mg/kg, and 1.242 mg/kg; Pb: 1.408 mg/kg, 0.226 mg/kg, and 0.174 mg/kg, sequentially.
The concentrations of As (0.144 mg/kg), Cr (1.854 mg/kg), and Ni (1.726 mg/kg) in Malva parviflora root from this study fell within the ranges reported in the literature, which were 0.05-0.38 mg/kg, 0.58-2.17 mg/kg, and 0.75-2.67 mg/kg, respectively. Additionally, the levels of Cd, Co, and Pb in the Malva parviflora root from this study were lower than the values documented in the literature, which ranged from 40.83-123.33 mg/kg, 1.25-4.17 mg/kg, and 257.5-681.67 mg/kg, respectively. In contrast, the Cu concentration was higher than the reported range of 0.42-1.83 mg/kg. The concentration of As (0.540 mg/kg) in the Malva parviflora leaves from this study exceeded the reported range of 0.03-0.43 mg/kg found in the literature. Conversely, the levels of Cd (0.753 mg/kg), Co (0.223 mg/kg), and Pb (1.408 mg/kg) in the Malva parviflora leaves from this study were lower than the documented values, which ranged from 5.42-91.67 mg/kg, 0.83-2.67 mg/kg, and 11.67-583.33 mg/kg, respectively. On the other hand, the Cu content was higher than the reported range of 0.5-3 mg/kg.
Arum spp
The concentrations of heavy metals are presented in Table 1. As, Cd, and Co in the Arum spp followed a similar descending trend: stem > root > leaf, with the values: As: 0.365 mg/kg, 0.269 mg/kg, and 0.194 mg/kg; Cd: 0.026 mg/kg, 0.022 mg/kg, and 0.021 mg/kg; Co: 0.846 mg/kg, 0.413 mg/kg, and 0.406 mg/kg, respectively. The Se concentration in different parts of Arum spp followed leaf > root > stem with values of 0.098 mg/kg, 0.057 mg/kg, and 0.039 mg/kg, respectively. The quantities of Cr, Cu, and Ni in Arum spp followed a similar descending trend: stem > leaf > root, with the values as follows: Cr: 23.210 mg/kg, 5.545 mg/kg, and 3.603 mg/kg; Cu: 39.120 mg/kg, 7.997 mg/kg, and 3.689 mg/kg; Ni: 12.070 mg/kg, 4.338 mg/kg, and 3.605 mg/kg, respectively. Lastly, the order of Pb was: leaf (0.382 mg/kg) > stem (0.379 mg/kg) > root (0.162 mg/kg).
The concentration of As in the stem of Arum spp from this study was lower than the documented range of 0.048-0.201 mg/kg, while the levels of Cd and Pb fell within the ranges reported in the literature, which were 0.023-1.458 mg/kg and 0.0003-0.919 mg/kg, respectively. The average concentrations of As and Pb in the leaf and root of Arum spp from this study were within the ranges reported in the literature, specifically 0.053-0.373 mg/kg and 0.039-0.357 mg/kg for As, and 0.181-1.234 mg/kg and 0.042-2.992 mg/kg for Pb, respectively. However, the concentrations of Cd in the leaf and root of Arum spp from this study were lower than the reported ranges of 0.024-0.733 mg/kg and 0.023-1.011 mg/kg, respectively. 47 Furthermore, the concentration of Cu in the leaves of Arum spp from this study fell within the reported range of 6.10-25.04 mg/kg, while the level of Cr was lower than the documented range of 0.78-1.12 mg/kg found in the literature. 48
Spinach
As, Cr, and Pb in spinach exhibited a similar descending trend: stem > root > leaf, with the following values: As: 0.581 mg/kg, 0.288 mg/kg, and 0.175 mg/kg; Cr: 18.660 mg/kg, 5.735 mg/kg, and 2.489 mg/kg; Pb: 0.704 mg/kg, 0.263 mg/kg, and 0.258 mg/kg, sequentially. The concentrations of Se, Co, and Ni in spinach followed a similar descending pattern: stem > leaf > root, with the values as follows: Se: 0.312 mg/kg, 0.240 mg/kg, and 0.192 mg/kg; Co: 1.472 mg/kg, 0.423 mg/kg, and 0.405 mg/kg; Ni: 13.170 mg/kg, 2.754 mg/kg, and 0.301 mg/kg, sequentially. Lastly, the quantities of Cd and Cu in spinach followed a similar pattern across compartments, with levels decreasing in the order of leaf > root > stem. The values were as follows: Cd: 0.237 mg/kg, 0.160 mg/kg, 0.126 mg/kg; Cu: 8.258 mg/kg, 7.421 mg/kg, 7.024 mg/kg, respectively.
The levels of Cd (0.160 mg/kg), Cr (5.735 mg/kg), Co (0.405 mg/kg), Cu (7.421 mg/kg), Ni (0.301 mg/kg), and Pb (0.263 mg/kg) in the roots of spinach from this study were lower than the values reported in the literature, which were 0.3, 10, 3, 15, 4, and 3 mg/kg, respectively. Additionally, the concentrations of Cd (0.273 mg/kg), Cu (8.258 mg/kg), and Ni (2.754 mg/kg) in the spinach leaves from this study were higher than the documented values of 0.2, 7, and 2 mg/kg, respectively. On the other hand, the Cr (2.489 mg/kg), Co (0.423 mg/kg), and Pb (0.258 mg/kg) contents in the spinach leaves were lower than the reported values in the literature, which were 4, 1, and 0.5 mg/kg, respectively. 49
Gundelia tournefortii
As, Cd, Cr, Co, Cu, Ni, and Pb in Gundelia tournefortii. displayed a similar decreasing trend: root > stem > leaf, with the following concentrations: As: 0.500 mg/kg, 0.267 mg/kg, and 0.093 mg/kg; Cd: 0.085 mg/kg, 0.053 mg/kg, and 0.014 mg/kg; Cr: 9.180 mg/kg, 4.220 mg/kg, and 3.431 mg/kg; Co: 1.313 mg/kg, 0.503 mg/kg, and 0.177 mg/kg; Cu: 17.010 mg/kg, 8.002 mg/kg, and 5.701 mg/kg; Ni: 9.793 mg/kg, 4.272 mg/kg, and 2.234 mg/kg; Pb: 0.640 mg/kg, 0.357 mg/kg, and 0.167 mg/kg, respectively. However, Se followed a different pattern: stem (0.193 mg/kg) > root (0.172 mg/kg) > leaf (0.125 mg/kg).
Lepidium sativum
As, Cd, and Ni in Lepidium sativum exhibited a similar decreasing trend: root > stem > leaf, with the following concentrations: As: 0.399 mg/kg, 0.278 mg/kg, and 0.229 mg/kg; Cd: 0.248 mg/kg, 0.228 mg/kg, and 0.218 mg/kg; Ni: 5.281 mg/kg, 4.302 mg/kg, and 4.236 mg/kg, respectively. The concentrations of Se and Cr in Lepidium sativum followed a similar descending pattern: stem > root > leaf, with values of Se: 0.149 mg/kg, 0.116 mg/kg, and 0.103 mg/kg; Cr: 4.544 mg/kg, 3.780 mg/kg, and 1.944 mg/kg, respectively. The concentrations of Co and Cu in Lepidium sativum followed a similar descending pattern: root > leaf > stem, with values of Co: 0.319 mg/kg, 0.310 mg/kg, and 0.251 mg/kg; Cu: 4.804 mg/kg, 4.589 mg/kg, and 3.458 mg/kg, respectively. Finally, Pb followed a different trend: leaf (0.8 mg/kg) > root (0.288 mg/kg) > stem (0.195 mg/kg).
The levels of As, Cd, Pb, Co, and Ni in the edible parts of Lepidium sativum from this study exceeded the reported values in the literature, which were 0.165 mg/kg, below the limit of quantification to 0.041 mg/kg, 0.154 mg/kg, 50 0.13 mg/kg and 0.22 mg/kg, 51 respectively. On the other hand, the concentrations of Cd, Cr, Cu, and Pb in the edible parts of these vegetables from this study were lower than the documented values in the literature, which were 0.65 mg/kg, 7.50 mg/kg, 8.51 mg/kg, and 13.11 mg/kg, respectively. 52
Allium kurrat. schweinf
The concentrations of As (1.753 mg/kg), Cd (0.079 mg/kg), Cr (10.870 mg/kg), Co (1.641 mg/kg), Ni (10.030 mg/kg), and Pb (0.368 mg/kg) in the leaf of Allium kurrat. schweinf were higher than those in the root for the same metals (As: 0.286 mg/kg, Cd: 0.038 mg/kg, Cr: 2.915 mg/kg, Co: 0.406 mg/kg, Ni: 2.836 mg/kg, and Pb: 0.331 mg/kg). However, the levels of Se (0.1 mg/kg) and Cu (9.892 mg/kg) were higher in the root compared to the leaf (Se: 0.057 mg/kg and Cu: 9.766 mg/kg).
The levels of Cu and Pb in the root and leaf of Allium kurrat. schweinf from this study exceeded the values reported in other studies, which were 0.34 mg/kg and 0.71 mg/kg for Cu, and 0.03 mg/kg and 0.16 mg/kg for Pb, respectively. 53 On the other hand, the concentrations of Cd and Cu in the edible parts of Allium kurrat. schweinf from this study were higher than the values reported by other researchers, which were 0.54 mg/kg and 2.82 mg/kg, respectively. Similarly, the levels of Cu and Ni were also higher, with reported values of 39.21 mg/kg and 6.25 mg/kg, respectively. 54
Apium graveolens
The distribution of As, Cd, Cr, Cu, and Ni in Apium graveolens followed a similar decreasing trend: root > stem > leaf, with the concentrations as follows: As: 0.322 mg/kg, 0.220 mg/kg, and 0.108 mg/kg; Cd: 0.300 mg/kg, 0.196 mg/kg, and 0.108 mg/kg; Cr: 10.580 mg/kg, 5.986 mg/kg, and 1.807 mg/kg; Cu: 13.930 mg/kg, 9.501 mg/kg, and 9.210 mg/kg; Ni: 6.837 mg/kg, 5.464 mg/kg, and 4.499 mg/kg, sequentially. Se in Apium graveolens followed a different order: stem (0.157 mg/kg) > leaf (0.089 mg/kg) > root (0.068 mg/kg). Finally, Co and Pb exhibited a similar descending pattern: stem > root > leaf, with Co concentrations of 0.656 mg/kg, 0.651 mg/kg, and 0.266 mg/kg, and Pb concentrations of 1.782 mg/kg, 0.502 mg/kg, and 0.275 mg/kg, sequentially.
The concentrations of As and Cu in the edible parts of Apium graveolens in this study were lower than the values reported in other studies, which were 0.300-0.307 mg/kg 55 and 14 mg/kg, 56 respectively. However, the levels of Cd, Cr, Pb, and Ni were higher than those found in the literature, which ranged from 0.003-0.007 mg/kg, 0.027-0.033 mg/kg, 0.153-0.167 mg/kg 55 and 4.075 mg/kg, 56 respectively.
Allium fistulosum
The order of distribution for As, Se, Cd, Cr, Co, and Pb in Allium fistulosum was as follows: As: root (2.064 mg/kg) > leaf (0.770 mg/kg) > stem (0.693 mg/kg) > bulb (0.151 mg/kg); Se: root (1.564 mg/kg) > stem (0.951 mg/kg) > bulb (0.273 mg/kg) > leaf (0.105 mg/kg); Cd: root (0.126 mg/kg) > stem (0.056 mg/kg) > leaf (0.053 mg/kg) > bulb (0.042 mg/kg); Cr: leaf (89.4 mg/kg) > stem (25.460 mg/kg) > root (9.584 mg/kg) > bulb (1.736 mg/kg); Co: stem (2.693 mg/kg) > root (1.593 mg/kg) > leaf (1.513 mg/kg) > bulb (0.180 mg/kg); Pb: leaf (1.440 mg/kg) > root (0.610 mg/kg) > stem (0.443 mg/kg) > bulb (0.319 mg/kg). Finally, Cu and Ni followed a similar decreasing pattern: stem > leaf > root > bulb. The concentrations of Cu were 12.160 mg/kg, 7.586 mg/kg, 6.822 mg/kg, and 5.992 mg/kg, and for Ni, the concentrations were 63.880 mg/kg, 24.160 mg/kg, 9.349 mg/kg, and 2.532 mg/kg, respectively.
The concentrations of As, Se, Cu, Ni, and Pb in the bulb of Allium fistulosum exceeded those reported in a previous study, which ranged between 3.07 and 3.88, 0.44-0.62, 10.66-15.64, 7.38-7.98, and 5.00-5.95 mg/kg, respectively, for the same part. 57 In comparison, the Co level was lower than the documented value of 0.92 mg/kg. 58 The levels of Cd (0.053 mg/kg) and Pb (1.440 mg/kg) in the leaves of Allium fistulosum from this study were lower than those reported in another study, where Cd was 0.824 mg/kg and Pb was 6.599 mg/kg However, the Cr content was higher, measuring 6.058 mg/kg compared to the value in the previous study. 59
Beta vulgaris subsp
The distribution of As, Cr, Co, and Ni in Beta vulgaris subsp followed a similar decreasing trend: root > stem > leaf, with the concentrations of As at 0.575 mg/kg, 0.388 mg/kg, and 0.192 mg/kg; Cr at 7.324 mg/kg, 6.517 mg/kg, and 2.360 mg/kg; Co at 1.011 mg/kg, 0.833 mg/kg, and 0.637 mg/kg; and Ni at 5.987 mg/kg, 4.083 mg/kg, and 2.654 mg/kg. The concentrations of Se, Cd, and Pb followed a different decreasing trend: root > leaf > stem, with Se at 5.899 mg/kg, 2.754 mg/kg, and 0.274 mg/kg; Cd at 0.060 mg/kg, 0.057 mg/kg, and 0.051 mg/kg; and Pb at 0.624 mg/kg, 0.587 mg/kg, and 0.533 mg/kg, respectively. However, Cu showed a different pattern, with similar concentrations across the Beta vulgaris subsp: stem (8.992 mg/kg) > root (8.399 mg/kg) > leaf (8.074 mg/kg).
The concentrations of Cd, Cr, Ni, and Pb in the edible portions of Beta vulgaris subsp in this study were higher than those reported in previous literature, which were 0.8, 12.38, 10.7, and 87.00 mg/kg, respectively. However, the values of Co and Cu were lower than the reported values which were 0.21 60 and 5.19 mg/kg respectively. 61
Vicia Faba
The level of As in various parts of the Vicia Faba was as follows: root (2.106 mg/kg) > stem (0.427 mg/kg) > leaf (0.397 mg/kg) > pods (0.266 mg/kg) > beans (0.145 mg/kg). The Se content in different parts of the Vicia Faba was: leaf (0.085 mg/kg) > bean (0.072 mg/kg) > pods (0.060 mg/kg) > root (0.056 mg/kg) > stem (0.037 mg/kg). The quantities of Cd, Cr, and Co in different parts of the Vicia Fabas followed similar descending patterns: root > leaf > stem > pods > beans. The specific concentrations were as follows: Cd: 0.076 mg/kg, 0.025 mg/kg, 0.022 mg/kg, 0.017 mg/kg, and 0.016 mg/kg; Cr: 10.090 mg/kg, 4.567 mg/kg, 4.191 mg/kg, 1.809 mg/kg, and 0.787 mg/kg; Co: 1.530 mg/kg, 1.015 mg/kg, 0.679 mg/kg, 0.588 mg/kg, and 0.527 mg/kg, respectively. The content of Cu showed a reverse trend compared to the previous heavy metals across all parts of the Vicia Faba, with the following values: beans (27.05 mg/kg) > pods (13.820 mg/kg) > leaf (12.080 mg/kg) > root (9.280 mg/kg) > stem (6.494 mg/kg). The Ni quantities in different organs of the Vicia Faba followed this descending order: root (10.040 mg/kg), beans (9.851 mg/kg), pods (8.561 mg/kg), leaf (7.015 mg/kg), and stem (5.251 mg/kg). Finally, the Pb concentrations across the Vicia Faba parts (leaf, root, stem, pods, and beans) were: leaf (0.479 mg/kg) > root (0.341 mg/kg) > stem (0.300 mg/kg) > pods (0.146 mg/kg) > beans (0.062 mg/kg).
The concentrations of Cd and Pb in the pods and beans from this study were lower than the reported values, which ranged from 0.18-6 mg/kg and 5-7 mg/kg in the pods, and 1.5-5 mg/kg and 9-9.32 mg/kg in the beans for both heavy metals, respectively. The concentration of As in the Vicia Faba from this study (0.145 mg/kg) was lower than the reported values, which ranged between 26 and 112 mg/kg. 62
Mentha longifolia
When compared to other compartments, it is astounding that the majority of the heavy metals under investigation were deposited in the root of Mentha longifolias. As, Se, Cu, Ni, and Pb in Mentha longifolia displayed a similar decreasing trend: root > leaf >stem, with the following concentrations: As: 0.867 mg/kg, 0.378 mg/kg, and 0.299 mg/kg; Se: 0.091 mg/kg, 0.077 mg/kg, and 0.046 mg/kg; Cu: 14.780 mg/kg, 12.750 mg/kg, and 11.660 mg/kg; Ni: 14.120 mg/kg, 7.041 mg/kg, and 6.617 mg/kg; Pb: 0.921 mg/kg, 0.833 mg/kg, and 0.620 mg/kg, respectively. As, Se, Cu, Ni, and Pb in Mentha longifolia followed a similar descending trend: root > leaf > stem, with the following concentrations: As: 0.867 mg/kg, 0.378 mg/kg, and 0.299 mg/kg; Se: 0.091 mg/kg, 0.077 mg/kg, and 0.046 mg/kg; Cu: 14.780 mg/kg, 12.750 mg/kg, and 11.660 mg/kg; Ni: 14.120 mg/kg, 7.041 mg/kg, and 6.617 mg/kg; Pb: 0.921 mg/kg, 0.833 mg/kg, and 0.620 mg/kg, respectively. However, Cd, Cr and Co followed a different descending pattern, root > stem > leaf with the following levels: Cd: 0.059 mg/kg, 0.021 mg/kg, and 0.020 mg/kg; Cr: 20.620 mg/kg, 9.297 mg/kg, and 7.552 mg/kg; Co: 1.757 mg/kg, 0.782 mg/kg, and 0.688 mg/kg, sequentially. The concentrations of Cd, Co, and Pb in the edible parts of Mentha longifolia from this study surpassed the previously recorded levels of 0.2, 0.89, and 1.80, respectively. Additionally, the Cu content in this study was higher than the previously reported value of 6.22 mg/kg. 58
This study had several limitations. Firstly, the concentrations of the selected heavy metals were not analyzed in the soils and water used for cultivation, making it difficult to fully understand how these metals are distributed within different parts of the vegetables. This challenge was partly due to the fact that some of the vegetables grow naturally, making it hard to collect irrigation water samples. Secondly, the article focused on only eight heavy metals: As, Se, Cd, Cr, Co, Cu, Ni, and Pb. The potential presence of other toxic heavy metals, which were not measured, could also influence the study’s results.
Health risk assessment
EDI (mg/kg body weight/day) of As, Se, Cd, Cr, Co, Cu, Ni, and Pb in consumers via the ingestion of different parts of Raphanus sativus, Solanum tuberosum, Malva parviflora, Arum spp, Spinacia oleracea, Gundelia tournefortii, Lepidium sativum, Allium kurrat. Schweinf, Apium graveolens, Allium fistulosum, Beta vulgaris subsp, Vicia Faba and Mentha longifolia.
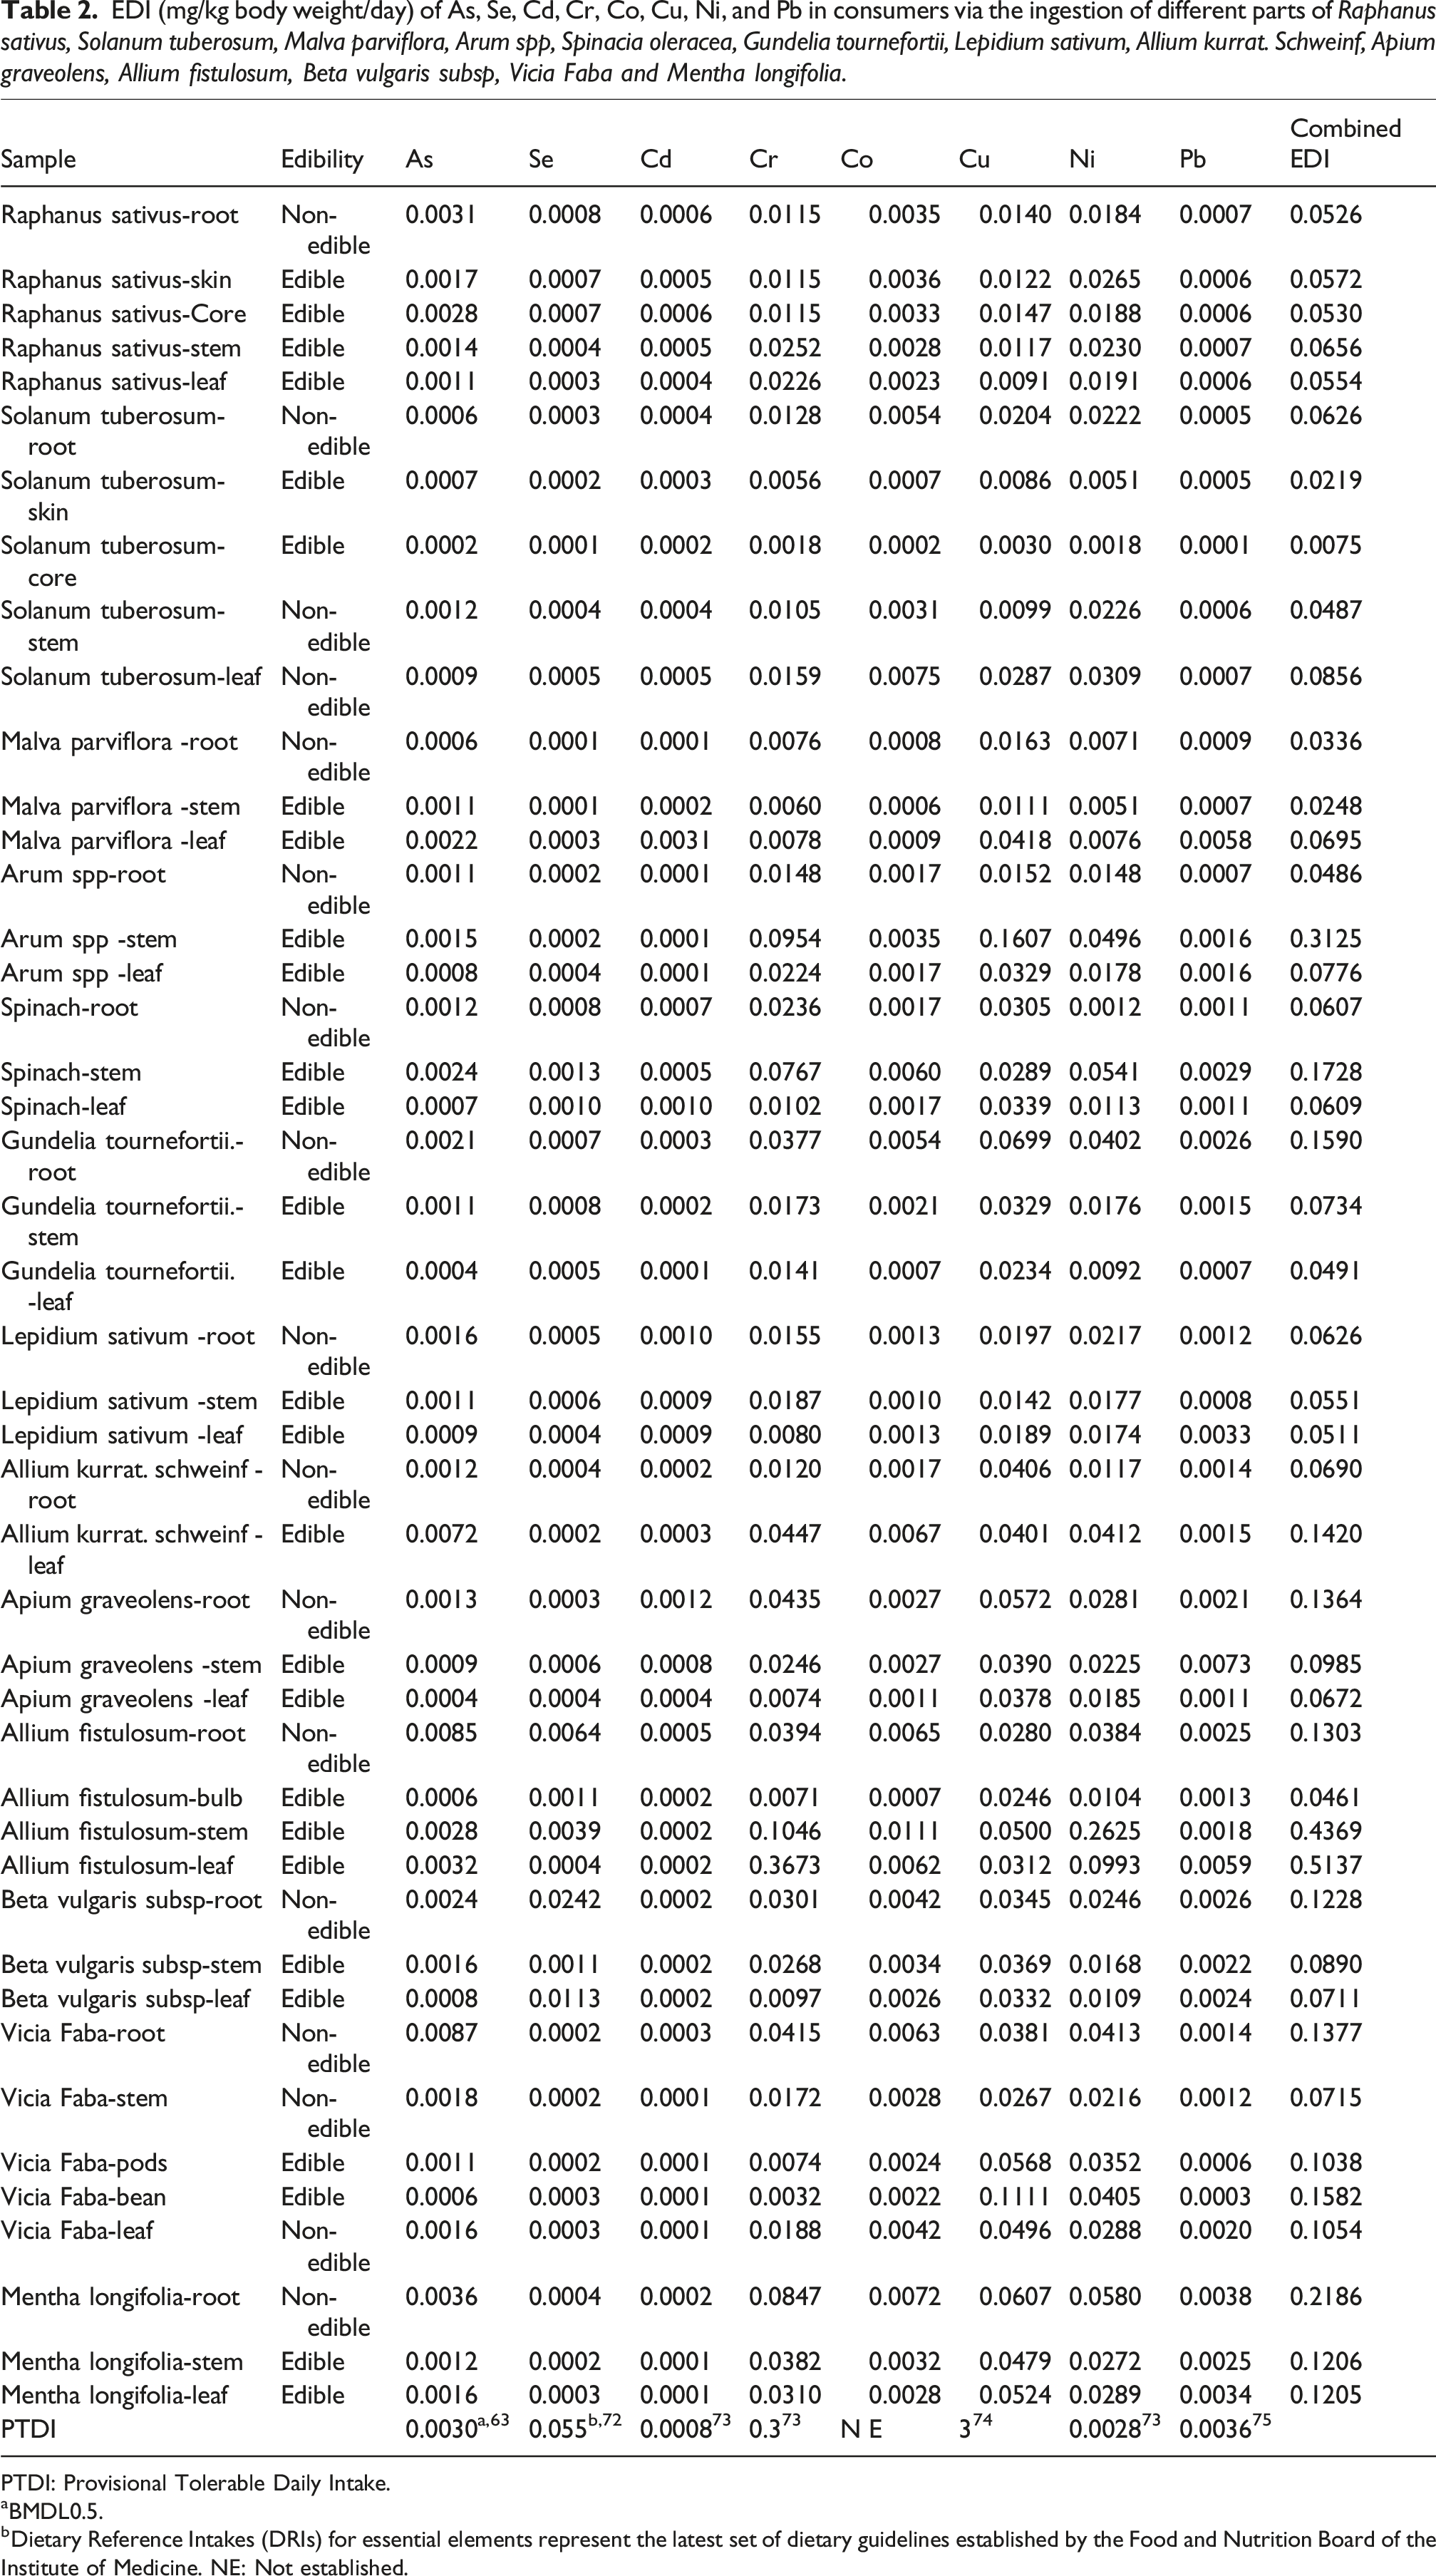
PTDI: Provisional Tolerable Daily Intake.
aBMDL0.5.
bDietary Reference Intakes (DRIs) for essential elements represent the latest set of dietary guidelines established by the Food and Nutrition Board of the Institute of Medicine. NE: Not established.
HQ results for non-cancer risk assessment of As, Se, Cd, Cr, Co, Cu, Ni, and Pb through consuming various parts of Raphanus sativus, Solanum tuberosum, Malva parviflora, Arum spp, Spinacia oleracea, Gundelia tournefortii, Lepidium sativum, Allium kurrat. Schweinf, Apium graveolens, Allium fistulosum, Beta vulgaris subsp, Vicia Faba and Mentha longifolia.

The HI was calculated to evaluate the combined effects of multiple metals using equation (4), as presented in Table 3. The high HI values for heavy metals under study in different parts of the analysed vegetables of this study mainly due to high concentrations of As, Cd, Cr, Cu, Ni, and Pb. The potential health risk may be amplified when considering the cumulative impacts of all the metals. In this study, the HI for all analyzed edible parts of the vegetable samples exceeded one (5.35-140.82), indicating potential non-cancer health impact risks from consuming the tested vegetables for adults. As a result, frequent consumption of these vegetables may pose a health risk, and it is not recommended. Therefore, consumers are at significant risk from these metals, which may cause non-carcinogenic effects.
CR results for cancer risk assessment of As, Cd, Cr, Ni, and Pb through consuming various parts of Raphanus sativus, Solanum tuberosum, Malva parviflora, Arum spp, Spinacia oleracea, Gundelia tournefortii, Lepidium sativum, Allium kurrat. Schweinf, Apium graveolens, Allium fistulosum, Beta vulgaris subsp, Vicia Faba and Mentha longifolia.

Conclusions
In this work, the quantities of heavy metals in various parts of commonly consumed vegetables grown in Erbil city, northern Iraq, were measured, and the related health hazards to the local population were evaluated. The concentrations of heavy metals like As, Cr, and Pb in most edible parts of various vegetables exceed the maximum limits set by the WHO and European agencies. In contrast, the levels of Se, Cd, Co, Cu, and Ni were found to be below the recommended thresholds established by these organizations.
From the health point of view, the HQ results of As, Cr, Cu and Ni in majority various parts of vegetables were greater than one. However, the outcomes revealed that the HQ values of Se, Co, Cd, and Pb in majority of different parts of vegetables were smaller than one, this suggests that consumption of these vegetables is unlikely to pose any negative health consequence. In this study, the HI for all analyzed edible parts of the vegetable samples exceeded one, suggesting the possibility of non-tumorigenic health risks from consuming the tested vegetables for adults. Based on the total CR values, the carcinogenic risk from As, Cd, Cr, and Ni exceeded 1.0 × 10⁻⁴, indicating a potential health risk associated with consuming these vegetables. Therefore, consumers are at significant risk from these metals, which may cause non-carcinogenic effects. The results suggest that vegetables produced in the south Erbil city using municipal water for agriculture practice are unsuitable for fresh consumption. Policymakers, and agricultural regulators in Erbil city have to address the risks associated with vegetable production in the area. This should also include implementing risk mitigation strategies such as applying improved farming practices to reduce contamination, enhancing monitoring of environmental pollutants especially risks associated with high levels of As, Cr and Ni.
Supplemental Material
Supplemental Material - Human health risk assessment of heavy metals in different compartments of vegetables from Erbil City-Iraq
Supplemental Material for Human health risk assessment of heavy metals in different compartments of vegetables from Erbil City-Iraq by Bashdar Abuzed Sadee in Human & Experimental Toxicology
Footnotes
Acknowledgment
The author gratefully acknowledges Salahaddin University, Erbil-Iraq for financial support.
Ethical statement
This study did not involve human participants or animals. Vegetables were collected from local farms and wild areas with landowners’ or authorities’ knowledge and verbal permission. Therefore, no ethical approval was required. The research complied with national and institutional guidelines for environmental sample collection
Author contributions
Bashdar Abuzed Sadee contributed substantially to the conception and design of the study, as well as to data acquisition, analysis, and interpretation. He also contributed in drafting the work, critically reviewing it for important intellectual content, and providing final approval for the version to be published.
Funding
The author(s) received no financial support for the research, authorship, and/or publication of this article.
Declaration of conflicting interests
The author(s) declared no potential conflicts of interest with respect to the research, authorship, and/or publication of this article.
Data Availability Statement
Raw data available upon request.
Explicitly state
No AI-generated content was used in writing or analysis.
Supplemental Material
Supplemental material for this article is available online.
References
Supplementary Material
Please find the following supplemental material available below.
For Open Access articles published under a Creative Commons License, all supplemental material carries the same license as the article it is associated with.
For non-Open Access articles published, all supplemental material carries a non-exclusive license, and permission requests for re-use of supplemental material or any part of supplemental material shall be sent directly to the copyright owner as specified in the copyright notice associated with the article.