
Abstract
In this study, the level of arsenic (As), lead (Pb) and cadmium (Cd) and also essential elements in beer samples consumed in Turkey were investigated using the inductively coupled plasma mass spectrometry (ICP-MS) method. The heavy metal-induced non-carcinogenic and carcinogenic risks were calculated. For essential elements, the calculated estimated daily intake of iron (Fe), copper (Cu), selenium (Se) and cobalt (Co) from beer consumption were compared with their toxicity reference values. Tukey post-hoc test showed that As was found at a significantly higher level when compared to Pb. Also, a significant correlation was found between As level and alcohol by volume percent. All samples had a hazard quotient and hazard index <1, indicating no non-carcinogenic risk from exposure to single or multiple heavy metals. Some samples exceeded the threshold limit of acceptable cancer risk for As in the high beer consumer group. This assessment showed that in addition to health implications based on the alcohol content of beer, there might be a carcinogenic risk associated with the heavy metals content of these beverages.
Keywords
Introduction
Beer is the most consumed alcoholic beverage and is the third most popular beverage after water and tea in the world. According to Researchandmarkets.com, Europe is in the lead in consuming alcoholic beverages, and beer accounts for approximately 40% of total alcohol sales in Europe. In a report between the years 2004 and 2015, beer constituted more than half of the consumed beverages in Turkey, and the range for per capita consumption was 1.31 and 1.55 liters of pure alcohol in 2005 and 2012, respectively. 1
Heavy metals in the soil, water and air may contaminate nutrients and drinking water. Thus, they are absorbed into the human body by these means. In addition, they tend to accumulate in the body and intake above certain levels may have adverse health effects and prevent the organism from sustaining its vital functions. Elements are divided into two groups as follows: essential elements that play pivotal roles in various biochemical and physiological mechanisms such as Iron (Fe), Copper (Cu), Zinc (Zn), Selenium (Se) and Cobalt (Co) and the second group, heavy metals which are known as toxic elements like Lead (Pb), Arsenic (As) and Cadmium (Cd), which may cause severe problems for human health even in low levels. It should be noted that even those elements considered as essential, can be toxic if present in excess levels. 2,3
The major sources of Pb contamination for the general population are food and water. 4 Pb is a highly toxic metal affecting almost every organ in the body. Its toxicity comes from its ability to mimic biologically significant elements, such as calcium, Fe and Zn. Pb impairs various enzyme systems necessary for certain biological processes, including heme biosynthesis, cell maturation and skeletal growth. 5,6
As is a toxic metalloid that is widely distributed in nature. As is found in water, air, food and soil. As exerts its toxicity by inactivating up to 200 enzymes, including those involved in cellular energy pathways, DNA synthesis and repair. As is known as an ATP production disrupter. Chronic exposure to As results in multisystem dysfunction, and it is a well-documented human carcinogen affecting many organs. 7
Cd is another element that has no biological role in the human body. This toxic element accumulates in many plants from the soil and subsequently animal tissues, especially liver and kidney, which can contain a high level of it. Chronic exposure to Cd through the air, water, soil, and food may lead to cancer and organ toxicity, such as skeletal, urinary, reproductive, cardiovascular, central and peripheral nervous, and respiratory system toxicities. 8 Cd in beer and other alcoholic beverages could be due to raw material contamination and/or technological processes. 9
As an essential element, Co has a biological role as a constituent of vitamin B12. However, excessive exposure to Co has been shown to induce various adverse health effects. The toxicity potential of Co was first discovered in the 1960s when heavy beer drinkers presented with symptoms of cardiomyopathy, which was attributed to the use of cobalt salts as a foam stabilizer in beer. Symptoms of thyroid dysfunction have also been reported when excess Co was consumed accidentally as a contaminant of beer. 10
Metals in beer can be sourced from natural components used for beer production including cereals, water, yeasts and barleys. 11 Hops, bases, acids, silica gel flavoring agents, stabilizers and additives are also potential sources of metal contamination in the brewing process. 12 Pesticides containing heavy metals used in agriculture are another source of toxic elements in beers. 13 Recent studies have found that food-grade diatomaceous earth used to filter out alcoholic beverages may increase toxic element levels, such as As, in beverages. 14
Metals are sometimes present in beer at rather high concentrations. Studies from different parts of Africa, Asia, Europe, and North America revealed concentrations of up to 245, 68, and 58 mg/L of Fe, Zn and Cu, respectively. Alcoholic beverages in Tanzania can have up to twice the World Health Organization recommended maximum for Zn in drinking water. 12
Although some studies have measured toxic and essential element concentrations in alcoholic beverages, none of them have focused on the human health risk assessment associated with these element content in beer. Thus, this study aims (1) to determine three toxic elements (As, Cd and Pb) and four essential elements (Co, Cu, Fe and Se) concentrations in beer samples marketed in Turkey, (2) to evaluate risk assessment for human health associated to these elements’ exposure via beer consumption.
Materials and methods
Reagents
All aqueous solutions were prepared with deionized water obtained by using an ultra-pure water system (Aqua Nova Hepta Distillated, resistivity 0.34 MΩ-cm, Kristianstad, Sweden). HNO3 (65%) and H2O2 (30%) from Merck supra-pure grade (Darmstadt, Germany) were used for the digestion of the samples and dilution. Plastic bottles, autosampler cups, Teflon vessels, vials for collecting samples and glassware were cleaned by soaking in HNO3 (10% v/v) for a day, rinsing four times with ultra-pure water and drying in an oven at 40°C. All prepared solutions were stored in high-density polypropylene bottles. Stock standard solutions of analytes (1 g/L each) were obtained from Merck. Mixed standard solutions were freshly prepared by diluting the stock standard solutions to the desired calibration ranges in 0.2% HNO3.
Apparatus
An inductively coupled plasma mass spectrometry (ICP-MS) method with a Thermo Scientific ICAP Q Series (Bremen, Germany) was used for the analysis of heavy metal and essential elements. Digestion was carried out using Milestone Ethos Up, High Performance Microwave Digestion System (Serisole, Italy).
Analytical procedures
The samples were analyzed using an in-house validated and accredited method based on ICP-MS using microwave acid digestion. Briefly, 1 mL of each sample was taken into Teflon vessel and digested with 4 mL 65% HNO3 and 1 mL 30% H2O2. Digestion conditions for microwave system were applied as 15 min 200°C rising (max power), 15 min 200°C waiting (max power) and 15 min cooling to 80°C. Digested samples were introduced to ICP-MS for element determination. The operation parameters for the investigated elements were set as recommended by the manufacturer (Table 1).
Instrument operating parameters.
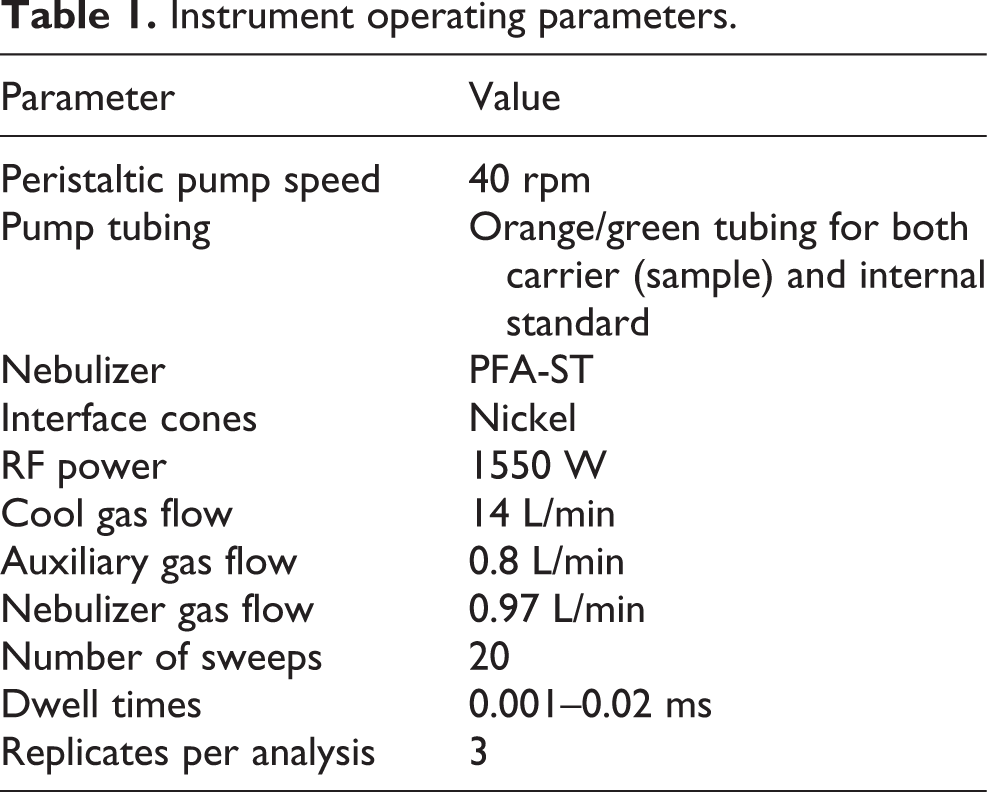
A solution of mixed internal standards (IS), Fe, Cu, Se, Co, As, Cd, Pb was used for calibration procedures. Detection limits of analyzed elements were 3.1 ng/L for Fe, 1.2 ng/L for Cu, 1.9 ng/L for Se, 0.4 ng/L for Co, 2.0 ng/L for As, 3.7 ng/L for Cd and 0.8 ng/L for Pb.
Sample collection
In this study, 10 samples of canned beer were analyzed. Different brands, representing the most widely accepted and most frequently consumed beers in Turkey, were selected for testing. Beer cans that were not exposed to direct sunlight, stored at temperatures below 12°C, were not damaged and had a similar production date were bought from the same market.
List of beers analyzed for toxic and essential elements, their origins, types, their raw materials from which they are brewed and the final alcohol by volume percent (ABV%) is summarized in Table 2.
List of beers analyzed for toxic and essential elements.

Risk assessment for consumers
In this study, EDI and non-carcinogenic risks of toxic elements in beer were estimated using the following equations. 4,15 –17


Where EDI is the estimated daily intake (mg/kg/day); C is the metal concentration in beer samples (mg/L), IR is the daily intake rate of beer (L/day), EF is exposure frequency (365 days/year), ED is the exposure duration (52 years, 18–70 years old), BW is the body weight (70 kg); AT is the averaging time in days (ED x EF); HQ is the hazard quotient and RfD is the reference oral dose in mg/kg/day (3 × 10⁻⁴ for As and 4 × 10⁻³ for Pb). 17
In this study, the risk assessment was evaluated with two different IR scenarios; one standard size beer (0.5 L)/day as a normal and five standard size beers (2.5 L)/day as a high beer consumer.
Since the exposure to two or more pollutants may result in additive effects, the total hazard quotient (HI) was also calculated as the arithmetic sum of each HQ values.

The risk of cancer was estimated as the probability of an individual to develop cancer over lifetime, as result of exposure to potential carcinogens. 15 According to The International Agency for Research on Cancer (IARC), As has been classified as a known (group 1) and Pb as a probable (group 2A) human carcinogens. 4
The incremental lifetime cancer risk (ILCR) was calculated by multiplying the EDI by the cancer slope factor (CSF) derived by response-dose curve for toxicant ingestion, following the formula:

Oral CSF for inorganic As and Pb is 1.5 and 8.5 × 10⁻³ per mg/kg/day, respectively. 18
For essential elements, the risk assessment was performed by comparing the estimated daily intake of Fe, Cu, Se and Co from beer consumption with recommended toxicological safe guideline levels; Tolerable Daily Intake (TDI), Provisional Tolerable Daily Intake (PMTDI), Reference Dose (RfD) or Tolerable Upper Intake Level (UL).
Statistical analysis
All analyses were performed using SPSS software version 21.0. Analysis of toxic and essential elements were presented as mean and standard deviation. The analysis of variance (ANOVA) and Tukey’s post-hoc HSD test were performed to find differences between the means of each toxic element species. Pearson’s R was computed to measure the relationship between the variables. A p < 0.05 was considered statistically significant.
Results and discussion
Heavy metals concentration
Heavy metal content per sample is presented in Table 3. Cd concentration in all investigated samples was below the detection limit of 3.7 ng/L. The average As level was 2.74 ± 0.95 µg/L (1.10–4.49 µg/L) and Pb was 0.89 ± 0.20 µg/L (0.60–1.95 µg/L). Tukey post-hoc test indicated that As was at a significantly high level (p Ë‚ 0.05), but not Pb (Figure 1). This observation can be attributed to the Diatomaceous earth (DE), which is used in the filtering stage of beer. It has been shown in recent studies that As in beer samples is likely to pass through DE. DE has the ability to remove particles from beer and, at the same time, do not affect the color and flavor of the product. Redan et al. 14 identified As in three kinds of food-grade DE. Authors also reported 3.7 to 7.9 times more As content in filtered beer and wine samples compared to the unfiltered ones. Furthermore, a significant correlation at the 0.021 level (Pearson’s R = 0.712) was found between As level and ABV%. Similarly, Donadini et al. 19 reported significant higher As content but not Pb and also a positive correlation between As concentration and ABV%, in beers from the Italian market. The fermentation time and the amount of sugar added during this period are two main parameters that determine the amount of alcohol in beer. The grains, such as barley, rye, oats and wheat, are the source of the sugar. Grains used in brewing procedure absorb elements from the soil. Therefore, it is predicted that the sugar sources, which are used more to increase the alcohol concentration, can also increase the concentration of toxic elements in beer. 13
As and Pb concentrations (µg/L) in beer samples (mean ± SD).


Comparison of As and Pb levels in beer samples (mean ± SD). p ≤ 0.05 versus Pb level.
Non-carcinogenic risk assessment
EDI for As and Pb via consumption of beer is summarized in Table 4. HQ was calculated to evaluate the risk of chronic systemic toxicity posed by exposure to the respective toxic element. The HQ is a ratio of measured concentrations and RfD, which is the highest acceptable dose that is assumed to be without adverse health impact in humans, the length and frequency of exposure, the amount ingested, and body weight. When, the HQ value for an element is higher than 1, it can be considered as an element with health risk and it means that HQ is higher than the maximum permitted RfD. If HQ ≤ 1, adverse effects are not likely and it means that the exposed population is assumed to be safe. 20
EDI of As and Pb via the consumption of beer samples (mg/kg/day).

IR: intake rate (L/day). EDI: estimated daily intake. EDI was calculated considering a weight of 70 kg in the age range of 18–70 years.
HQ of the investigated elements through the consumption of beer was determined and is presented in Table 5.
Estimated HQ for As and Pb caused by the consumption of investigated beer samples.
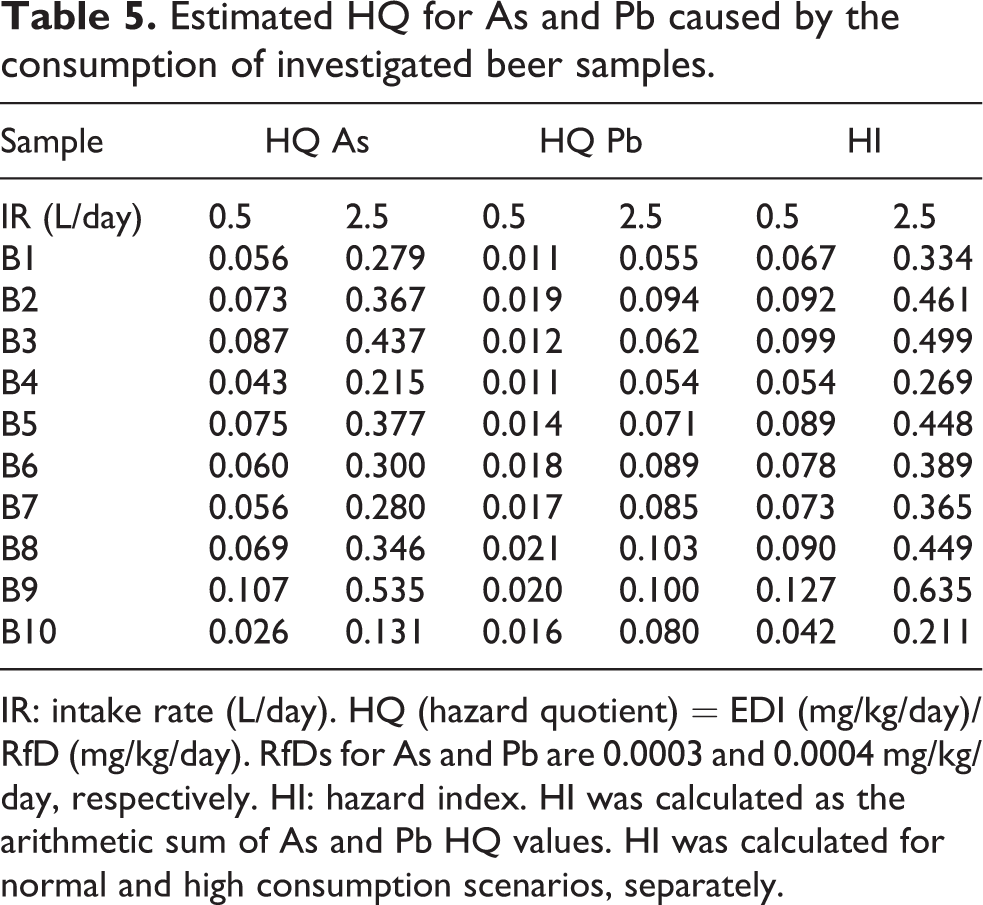
IR: intake rate (L/day). HQ (hazard quotient) = EDI (mg/kg/day)/RfD (mg/kg/day). RfDs for As and Pb are 0.0003 and 0.0004 mg/kg/day, respectively. HI: hazard index. HI was calculated as the arithmetic sum of As and Pb HQ values. HI was calculated for normal and high consumption scenarios, separately.
For both ingestion rate scenarios, HQ values were below the level of risk (HQ < 1) for As and Pb, suggesting no non-cancer risk for the consumers. Iwegbue et al. 21 estimated HQ value in some traditional alcoholic beverages in Nigeria. Similar to our results, the HQ for Pb from consumption of one 250 ml glass per day was less than 1.
Potential cumulative hazard from both As and Pb exposure was also evaluated and is illustrated in Table 5. HI for normal and high beer consumers was in the range of 0.042–0.127 and 0.211–0.635, respectively. HI was lower than the limit value of 1 for all investigated samples.
Carcinogenic risk assessment
The carcinogenic risk for As and Pb via the consumption of beer for both ingestion rate scenarios was determined and is presented in Table 6. To our knowledge, this is the only study that estimated the carcinogenic risk for toxic elements from the consumption of alcoholic beverages. The carcinogenic risk assessment was based on the CSF values of As (1.5 per mg/kg/day) and Pb (8.5 × 10⁻³ per mg/kg/day). The CSF is a toxicity value that quantitatively defines the relationship between dose and response. 22
ILCR for As and Pb analyzed in beer samples.

IR: intake rate (L/day). ILCR: incremental lifetime cancer risk. ILCR = EDI × CSF.
ILCR values of <10− 6 represent safe limit, values >10−4 demonstrate threshold risk and >10− 3 indicate considerable cancer risk for the consumers. 15 For Pb, ILCR values were lower than the safe limit of 10− 6 for both normal and high beer consumers (Table 6). For As, as shown in Table 6, in the high beer consumer group, all samples except B4 and B10, exceeded the limit of 10− 4, indicating threshold cancer risk for the consumers. However, it should be noted that the As concentrations measured in this study are total As rather than inorganic As. It is unlikely that the entire As content of samples is inorganic. Thus, the risk presented is likely to be overestimated in this study.
Concentration of essential elements
The concentrations of essential elements in beer may vary widely, as shown by the concentrations of Fe and Cu are summarized in Table 7. The concentration of Fe, Cu, Se and Co was in the range of 392.27–1454.14; 14.99–137.94; 4.69–9.80 and 0.21–0.44 µg/L, respectively (Table 7).
Essential element concentrations (µg/L) in beer samples (mean ± SD).

Fe deficiency is the most common nutritional deficiency worldwide, mostly affects infants and pregnant women. The main manifestations of Fe deficiency are anemia, impaired intellectual performance, decreased resistance to infections and adverse pregnancy outcomes. On the other hand, excess intake of Fe via the diet is one of the basic ways in which excessive amounts of Fe can accumulate in the body. Increased body Fe may play a role in the development of cardiovascular disease and different types of malignancies. 23
The concentrations of Fe ranged from 392.27 to 1454.14 µg/L. Franklin 24 reported Fe level in the sampled canned beers from Nigeria varied between 0.23 and 0.56 µg/mL, which was far below the levels detected in this study. A wide concentration range of Fe in alcoholic beverages has been reported in the previous studies. 25,26 Kostic et al. 25 reported Fe concentrations of Serbian and Ethiopian wines in the range of 2.93–36.2 and 1.42–3.16 mg/L, respectively. Raw materials, brewing equipment, DE, contamination during harvesting, transportation, and processing are the possible origins of Fe in beer. Also, it is well known that Fe and Cu in high concentrations may affect beer quality. Natural substances of beer, such as proteins, tannins, amino acids and resins, are capable of entering into chemical combinations with Fe and Cu. 27 Fe concentrations in this study were below the level of 10 mg/L, which is known to create insoluble suspension with tannin and phosphates. 28
The physiological roles of Cu are the presence in the functional center of metalloenzymes, such as cytochrome c-oxidase, which is a key enzyme in energy metabolism. Also, Cu/Zn superoxide dismutase protects the cells from oxygen toxicity by reducing superoxide radicals to hydrogen peroxide. On the other hand, an excess amount of Cu may produce hepatic necrosis and even death. 23 The concentrations of Cu in examined samples ranged from 14.99 to 137.940 µg/L. The permissible limit of Cu in wine is set at 1 mg/L by the international organization for grapes and wine. 21 In this study, the levels of Cu in beer samples were below the permissible limit. Our results were also similar to Cu levels (0.05–0.10 mg/L) found in canned beers marketed in Nigeria. 29 The residues of copper-based pesticides and transport from the soil are possible sources of Cu contamination in alcoholic beverages. 30
Se is an essential element found in selenoproteins, which are significant for their actions in the antioxidant system. Keshan disease and Kashin-Beck disease are the two most extensively documented diseases related to Se deficiency. Se is also toxic and high doses may cause chronic Se toxicity (selenosis). The main manifestations of selenosis are dermal and neurological symptoms, including hair and fingernail loss, numbness and paralysis. Foods are a good source of Se, and grains accumulate Se from the soil. 23 Se levels in food are highly variable and depend on the soil in which they were grown. 31 Oklo et al. 31 investigated Se content in bottled beers marketed in Nigeria by UV-visible spectrophotometry. In that study, the Se concentrations were in the range of 0.32–1.98 mg/L, which were above the permissible limit (0.05 mg/L) of Se in drinking water established by USEPA. 32 In our study, the mean concentrations of Se ranged from 4.69 to 9.80 µg/L. Se content of all investigated canned beer samples in this study was below the permissible limit of 0.05 mg/L.
The levels of Co in these beers were in the range of 0.21–0.44 µg/L. Co is an essential element, in small amounts, and a critical component of the vitamin B12. Cardiomyopathy has been reported with high Co intake (>10 mg/day), particularly from drinking beer to which Co was added as a foaming agent (Liu et al.). 23 In the only study investigated Co content of beer samples, concentrations of 0.07–0.1 mg/L were recorded in canned beer marketed in Nigeria. 29 The concentrations of Co reported in our study were far lower than the results of that study.
Risk assessment of essential elements
For risk assessment of essential elements, the calculated EDI of Fe, Cu, Se and Co from beer consumption were compared with their toxicity reference values, TDI, PMTDI, UL or the equivalent RfD. 33 As shown in Table 8, the average EDI for essential elements in high beer consumers represented very low percentages of the toxicological reference values (from 0.02% to 7.2% for a person weighting 70 kg). Hence, it is unlikely that the intake of Fe, Cu, Se and Co through even five standard size beers would involve any risk for the average consumers.
Comparison of the EDI of Fe, Cu, Se and Co through five standard size beers/day consumption and toxicological parameters.

* Arithmetic mean of samples B1–B10. EDI was calculated as mg/day considering a weight of 70 kg in the age range of 18–70 years. PMTDI: provisional maximum tolerable daily intake; RfD: reference dose; TDI: tolerable daily intake; UL: tolerable upper intake level. N/A: not available. a IOM/FNB 34 , b Olmedo et al. 33 , c Kumar et al. 35
Conclusion
In this study, levels of toxic and essential elements in beer samples were measured and health risks were estimated. The health risk assessment indicated no considerable non-carcinogenic lifelong health concerns associated with toxic and essential elements via the consumption of beer. On the other hand, ILCR for As showed values above 10− 4 in the high beer consumer group. Our study showed that in addition to health implications based on the alcohol content of beer, there might be a carcinogenic risk associated with the toxic elements content of these beverages. Hence, the public should be warned against the possible health risks from the frequent consumption of these beverages also related to the metal content of alcoholic beverages.
Footnotes
Acknowledgements
The authors showed their gratitude to Gülşah Selin Akyüz and Dr. Mehmet Engin Celep for their kind assists in the study.
Declaration of conflicting interests
The author(s) declared no potential conflicts of interest with respect to the research, authorship, and/or publication of this article.
Funding
The author(s) received no financial support for the research, authorship, and/or publication of this article.