
Abstract
Introduction
Glyphosate (GLP) is one of the most widely used herbicides in the world. However, its underlying effects on the liver remain unclear. This study aims to investigate the toxic effects and the gut microbiome– and serum metabolite–related mechanisms of GLP on the liver in mice.
Methods
16S rDNA sequencing and UPLC-Q-TOF-MS/MS were used to investigate the mechanisms of GLP toxicity in mice administered with 0, 50, 250 and 500 mg/kg/day GLP for 30 days.
Results
GLP induced hepatocyte edema and ballooning as well as inflammatory cell infiltration. Exposure to GLP resulted in increased levels of serum ALT, TBIL, DBIL, and GLU. Microbiota analysis at the phylum level demonstrated that the proportions of Patescibacteria decreased in the GLP-treated group. The genus-level analysis identified 11 different genera, with eight decreased and three increased in the GLP-exposed group. Metabolomics analysis of serum showed 42 differential metabolites between the GLP and control groups. The metabolic pathway enrichment analysis revealed that the pentose phosphate pathway (PPP) and pyrimidine metabolism were significantly activated. Spearman analysis showed that the changes in the differential metabolites of the PPP and pyrimidine metabolism and gut microbiota were strongly associated with the biochemical index.
Discussion
In conclusion, GLP exposure induces hepatic injury through alterations in the gut microbiome and metabolic pathways, particularly by activating the pentose phosphate pathway and pyrimidine metabolism.
Keywords
Introduction
Glyphosate (GLP) is one of the most widely used herbicides in the world. It blocks the shikimate pathway by inhibiting the enzyme five-enolpyruvylshikimate-3-phosphate synthase, leading to plant death. 1 With the widespread use of glyphosate, humans are inevitably exposed to GLP through dermal, inhalation and dietary routes, resulting in increased body burden.2,3 Recent studies have reported that GLP exposure impairs liver and kidney functions, disturbs intestinal flora, exerts reproductive toxicity and increases cancer risk.4,5 Concerns about the health hazards of GLP have led to a series of initiatives in several countries or regions around the world, such as Sri Lanka, Brazil, Germany, France, Thailand and the U.S. to restrict or even ban the use of GLP to minimize its potential hazards.
Accumulating evidence indicated that exposure to GLP is associated with liver damage. A population-based study described that childhood exposure to GLP may increase the risk of liver metabolic disorders in early adulthood and may lead to serious illness later in life. 6 Exposure to GLP in rats has been demonstrated to induce hepatic pathological changes with reduced antioxidant capacity and DNA damage. 7 GLP also induced an upregulation of the cytokine TNF-α, which in turn caused steatosis, non-alcoholic steatohepatitis and cirrhosis. 4 In our previous study, GLP exposure induced oxidative stress in the mouse liver, leading to pathological changes in hepatic mitochondrial damage and hepatic inflammatory cell infiltration. 5 In this sense, the liver is a major target organ of GLP in population and rodent animals.
Over the past few years, a growing number of studies have been conducted on the relationship between gut microbiology and host health.8,9 Xenobiotic compounds directly or indirectly induce intestinal microbiota to form a series of metabolites that can influence the health of organisms.10–13 Those compounds can adjust the intestinal microbiota composition and their metabolites, whereas, by the influence of intestinal bacteria, xenobiotic compounds can be converted to non-toxic or highly toxic substances. 14 Given that the metabolites of gut microorganisms need to be transported to distal target organs via the bloodstream, serum metabolomics can well illustrate the correlation of gut flora with organs and pathways. Previous studies have indicated that the combination of metabolomics and gut microbiology can adequately analyze the targets and mechanisms of the toxic effects of drugs and chemicals.15,16
In this study, we applied the integrated analysis of gut flora and serum metabolomics to assess the hepatoxicity and the changes in gut bacteria and serum metabolites induced by GLP comprehensively.
Methods and materials
Animals and treatment
Forty SPF male Kunming mice (7-week-old) were housed in plastic cages (5 animals per cage) with a normal diet and water. The mice were fed in experimental conditions with a temperature of 22 ± 2°C, relative humidity of 50 ± 10%, and a cycle of 12h-light/12h-dark. The mice were allowed to acclimate for 1 week before treatment. All animal care and experimental procedures in this study were approved by the Qiqihar Medical University Ethic Committee on the Use of Animal (QMU-AECC-2022-139).
The mice were randomly divided into four groups (n = 10 per group) based on body weight: Control group (NC, GLP: 0 mg/kg/day), low-dose GLP group (LG, GLP: 50 mg/kg/day), medium-dose GLP group (MG, GLP: 250 mg/kg/day), and high-dose GLP group (HG, GLP: 500 mg/kg/day). The mice in LG, MG and HG groups were gavaged with a commercial formulation of Roundup® (containing 41% isopropylamine salt of GLP, Monsanto, St Louis, MO, USA) dissolved in distilled water, and the controls were given an equal amount of saline. The dose of the HG group was based on 1/20 of the GLP LD50 (oral LD50 = 10,000 mg/kg in mice) 17 and a no-observed adverse effect level (NOAEL) of Roundup 500 mg/kg/day obtained in the sub-chronic and chronic toxicity studies in mice.18,19 The dose in MG and LG groups was 1/2 and 1/10 of the dose in HG groups, respectively. Mice were administered daily by gavage for 30 consecutive days. The dietary intake was recorded every 2 days and the weight was recorded every 3 days. By the end of the experiment, the mice were euthanized under anesthesia using sodium pentobarbital. Blood, liver, and fecal samples were obtained from each group of mice for further analysis.
Histopathological examination
For hepatic histological observation, the formalin-fixed liver samples were embedded in paraffin, stained with hematoxylin and eosin (H&E) and examined under light microscopy.
Serum biochemical index
The concentrations of Alanine aminotransferase (ALT), aspartate aminotransferase (AST), total bilirubin (TBILI), direct bilirubin (DBILI), glucose (GLU), and total triglycerides (TG) in serum were determined with a commercial kit according to the supplier`s instructions (Jiancheng Bio-Technology Co., Ltd (Nanjing, China).
16S rDNA sequencing
Six individual cecum samples from the NC and HG groups were randomly selected for 16S rDNA sequencing, conducted by Biotree Biotech (Shanghai, China). Briefly, microbial DNA extraction was utilized with the QIAamp Fast DNA Stool Mini Kit (Qiagen, CA, United States). The hypervariable V3-V4 region of the 16S-rDNA gene was amplified using primers 341F: 5′-CCTACGGGNGGCWGCAG-3'; 805R: 5′-GACTACHVGGGTATCTAATCC-3′, followed by purification and quantification. Purified amplicons were sequenced on the Illumina NovaSeq platform for further analysis of the data.
Serum metabolomics analysis
Metabolite extraction, UHPLC-MS analysis annotation and data preprocessing were carried out by Biotree Biomedical Technology Co., Ltd (Shanghai, China) as previously reported. 20 In brief, six individual serum samples were randomly selected from the NC and HG groups for metabolomics analysis. The sample was pretreated and determined by the UHPLC system coupled with a Q-Exactive HFX mass spectrometer (Thermo Fisher Scientific). The raw data were converted to mzXML format using Proteowizard and processed with R package XCMS for peak detection, extraction, alignment, and integration. The final dataset was imported into the SIMCA16.0.2 software (Sartorius Stedim Data Analytics AB, Umea, Sweden) for partial least-squares discriminant analysis (PLS-DA), and conducted 200 times permutation tests to verify the reliability of the model. The differential metabolites were screened by t test and the variable importance in projection (VIP) value (p < .05 and VIP >1). Metabolic pathways analysis was performed using the Kyoto Encyclopedia of Genes and Genomes databases (KEGG, https://www.genome.jp/kegg/).
Data analysis
Data were presented as mean ± standard deviation (SD) and statistical analysis was performed using SPSS 17.0 (Beijing Stats Data Mining, China). Repeated measure ANOVA was applied to compare the body weight of each group at different time points. Two-tailed t-tests were used for comparisons between two groups, and one-way ANOVA followed by Tukey`s post hoc test was used for comparison among groups. Spearman correlation analysis was used to evaluate correlations between serum metabolites and the gut microbiota. p < .05 was considered statistically significant.
Results
Effect of GLP on general toxicological indicators
During the 30 days of the gavage trial, no significant difference in body weight was observed between mice treated with and without GLP (Figure 1(a)). The liver weight (supplemental Figure S1) and liver viscera coefficients (Figure 1(b)) were not significantly different between groups. H&E staining showed that in the NC and LG groups, the hepatic lobules were structurally intact and hepatic cords were neatly arranged. However, mild hepatic lobular and cord structural disturbances and hepatomegaly were observed in the MG group. In the HG group, markedly disorganized hepatic cord arrangement, numerous hepatocyte edema and ballooning, and inflammatory cell infiltration were observed (Figure 1(c)). The effect of GLP exposure on body weight, liver viscera coefficients, and liver histopathology in mice. (a), body weight; (b), liver viscera coefficients; (c), liver histopathology.
Effects of GLP on serum biochemical index
The effect of GLP exposure on the serum biochemical index (n = 10, means ± standard deviation).
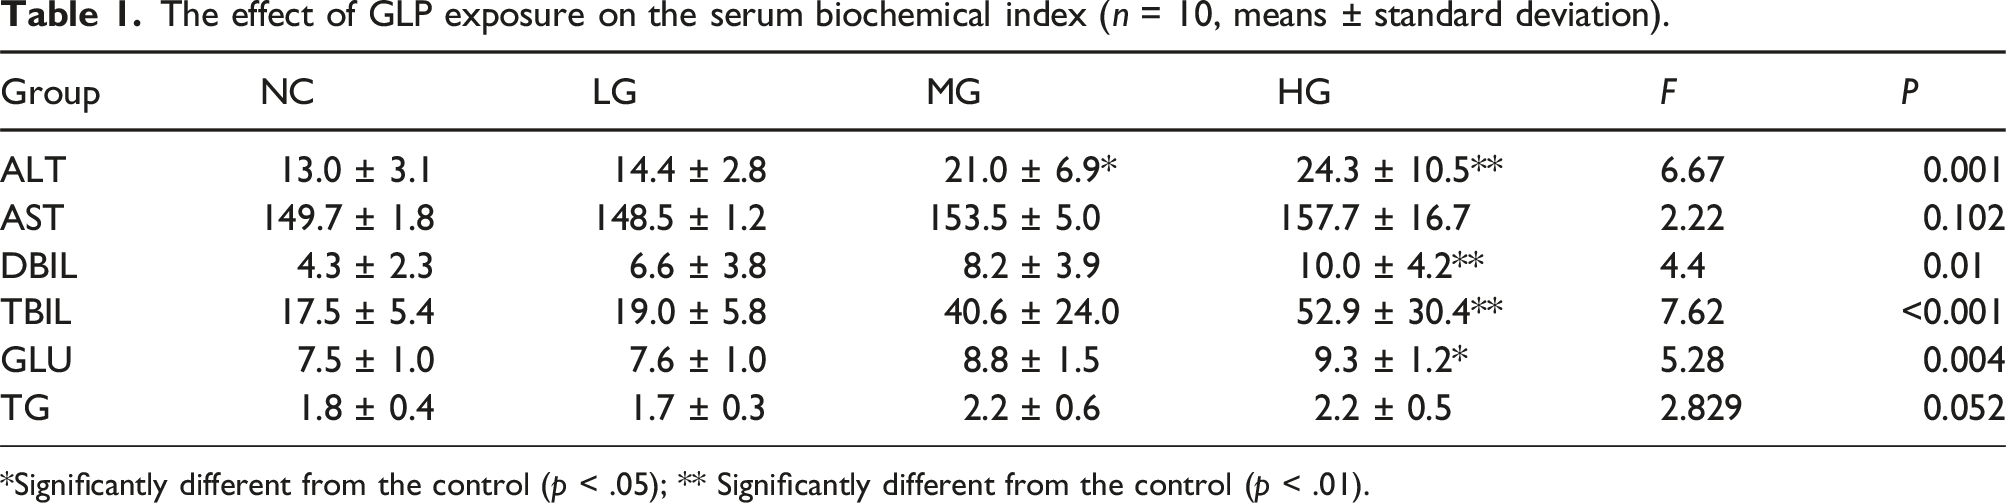
*Significantly different from the control (p < .05); ** Significantly different from the control (p < .01).
Effect of GLP on gut microbiota
The gut microbiota in the NC and HG groups were characterized by bacterial 16S rDNA gene sequencing. After removing low-quality sequences, the raw reads were denoised and clustered by using DADA2 and generating a table with amplicon sequence variants (ASVs) per sample. A total of 4650 ASV were detected. The HG and NC groups had 909 ASV in common. A total of 2062 and 1679 ASV were unique to the NC and HG groups, respectively (Figure 2(a)). α-Diversity analysis revealed that the abundance of observed_otus, Chao1, and Shannon was slightly decreased in the HG group compared with the NC group, but those differences were not statistically significant (Wilcoxon signed-rank test, p > .05, Figure 2(b)–(d)). Second, β-diversity analysis, involving principal component analysis (PCA, Figure 2(e)) and principal coordinate analysis (PCoA, Figure 2(F)), was further conducted on the two groups. The distribution of the two groups on the PCA and PCoA plots showed that the HG group did not separate from the NC group, suggesting that alteration in β-diversity in the HG group was minor relative to that in the NC group. Moreover, no significant differences in the microbial community composition were assessed using ANOSIM (p = .15, Supplemental Table S1) and permutational multivariate ANOVA (also known as Adonis, p = .36, Supplemental Table S2). Diversity analysis of gut microbiota. (a), shared and unique ASV in the gut microbiome in GLP and NC groups. Observation Otus (b), Chao one index (c), and Shannon index (d) of the two groups. (e), PCA analysis; (f), PCoA based on bray_curtis distance score plot of gut microbiota.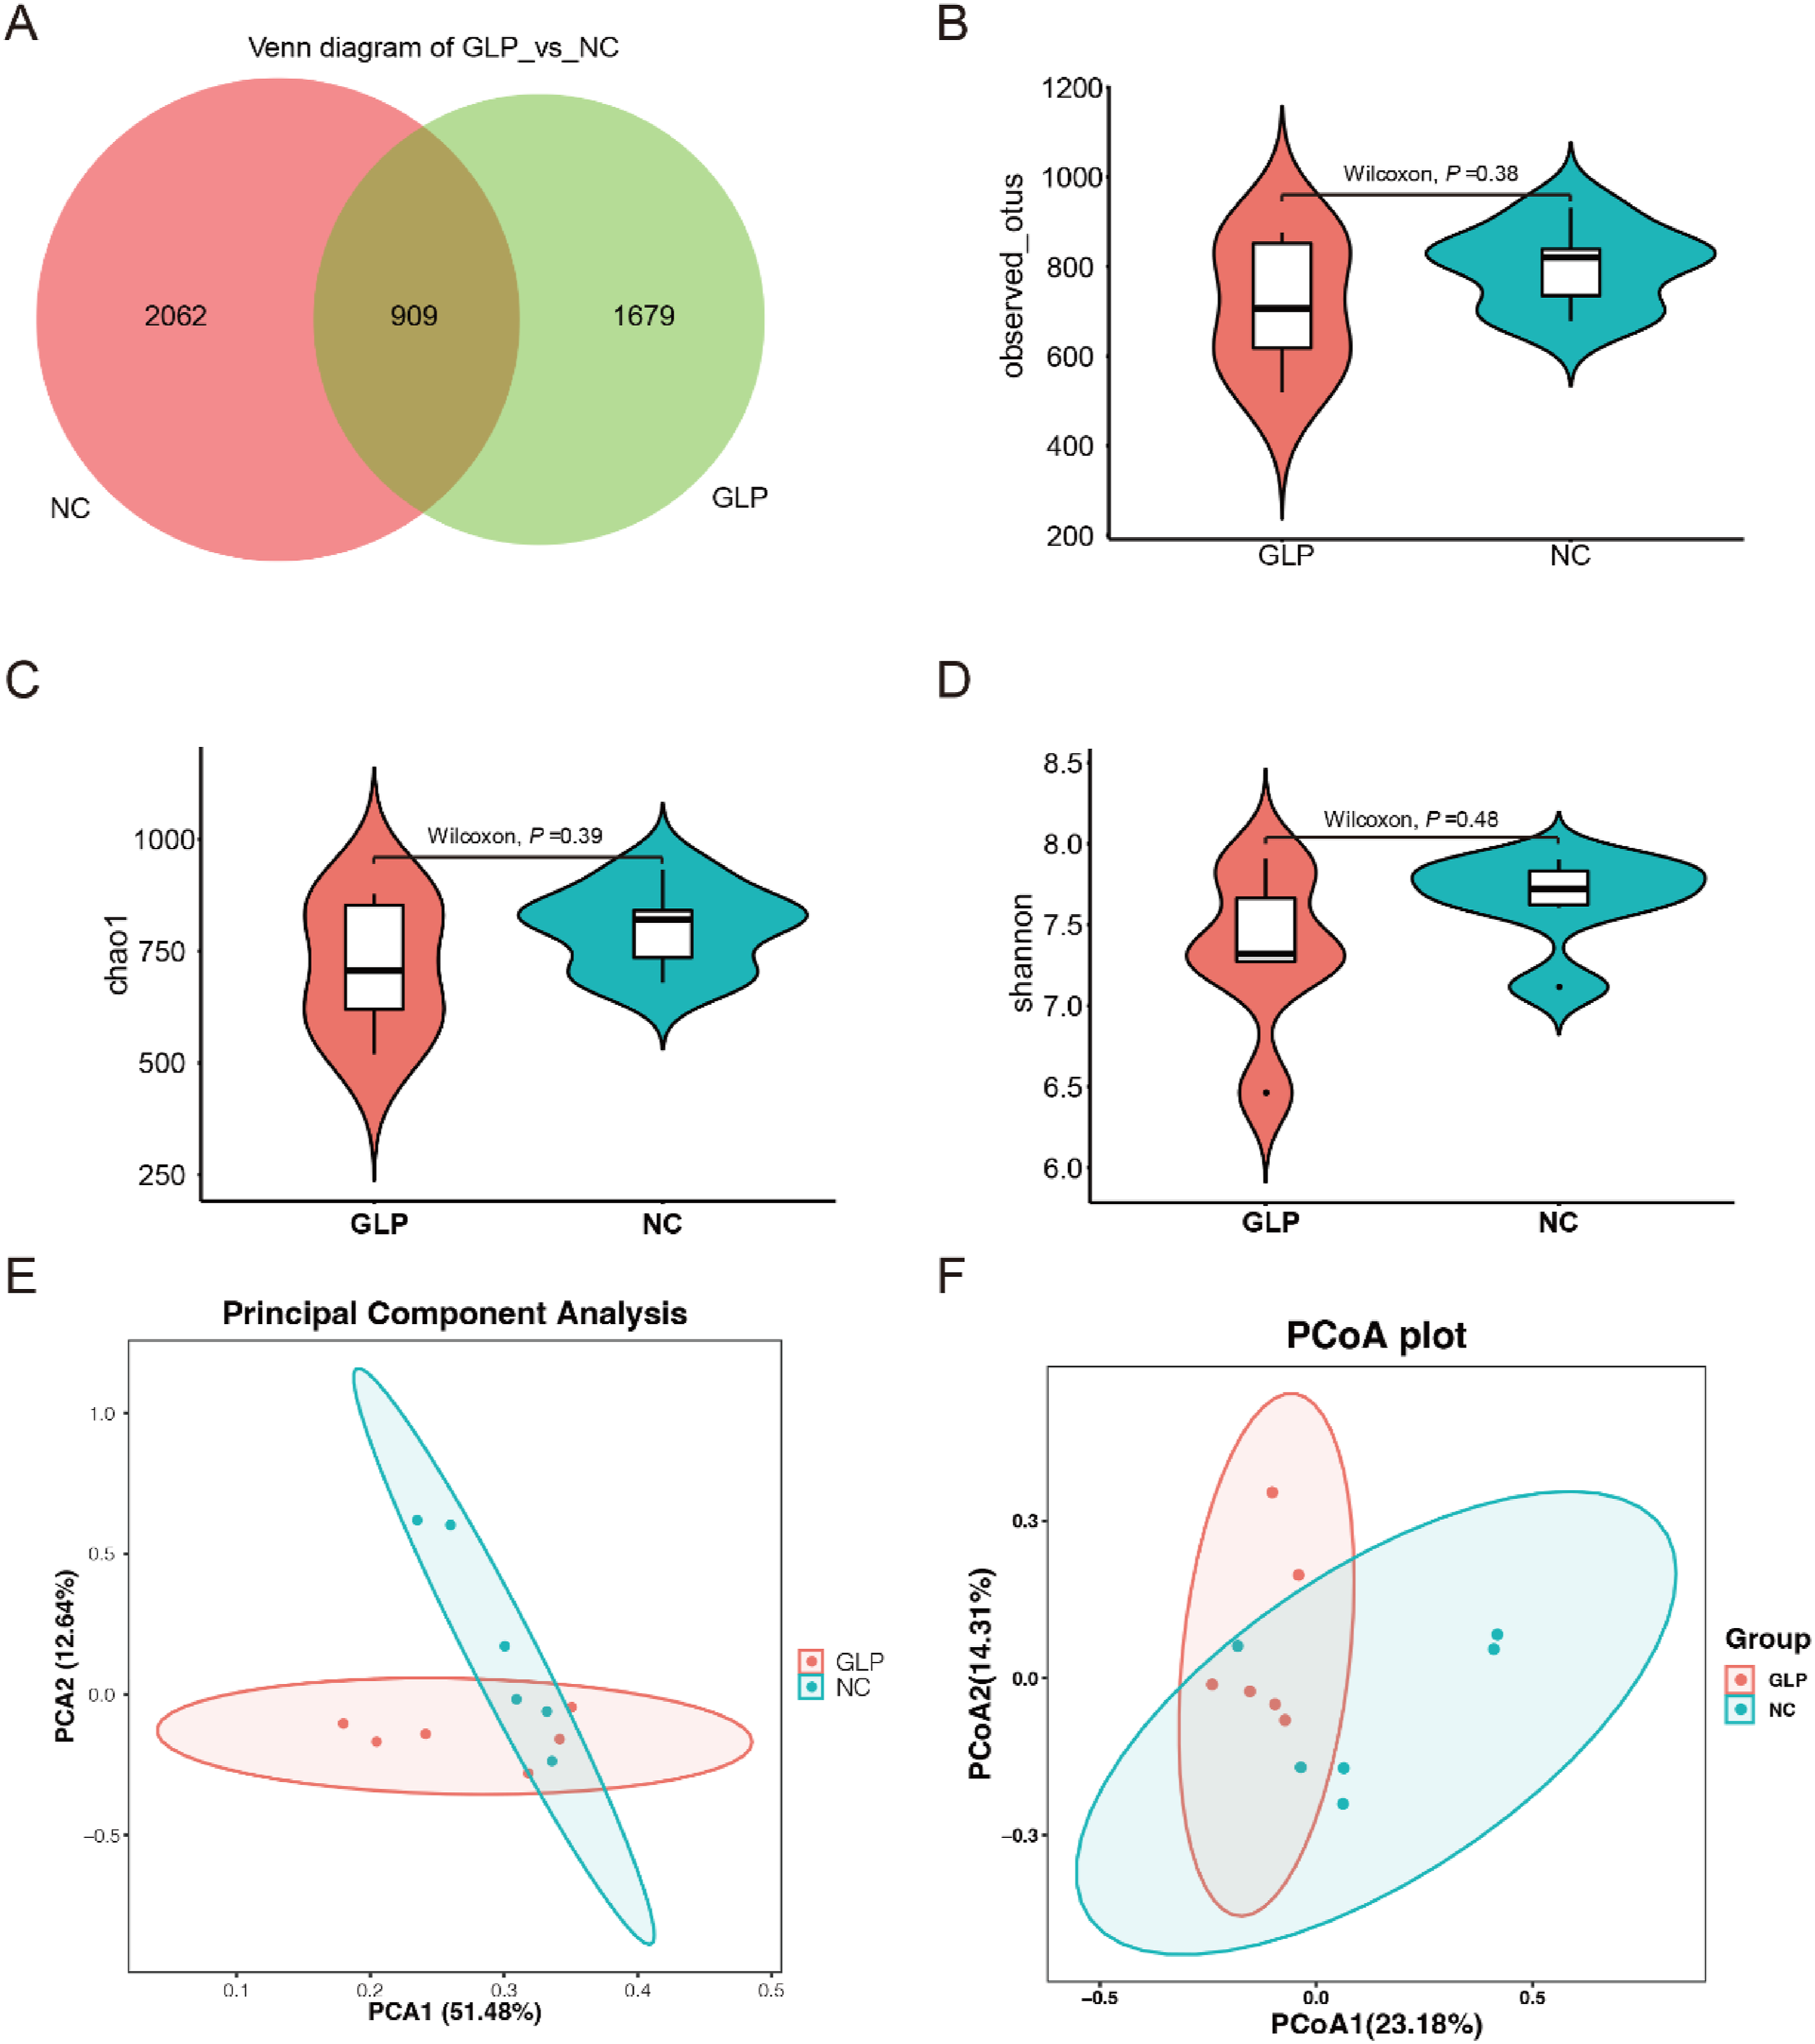
GLP affects the composition of gut microbiota
Phylum-level analysis showed that Firmicutes and Bacteroidota were most abundant (Figure 3(a)). At the phylum level, the proportions of Patescibacteria decreased in the HG group compared to the NC group (supplemental Figure S2). Genus-level analysis revealed that Muribaculaceae and Lachnospiraceae were most abundant presented in the total microbiota (Figure 3(b)). We found 11 different genera in the gut microbiota between the HG and NC groups (p < .05). As shown in Figure 3(c), there was a decrease in HG group for the proportions of Adlercreutzia, Clostridia_UCG-014_unclassified, Acutalibacter, Candidatus_Saccharimonas, Defluviitaleaceae_UCG-011, RF39_unclassified, UBA1819, Candidatus_Arthromitus decreased, whereas those of UCG-010_unclassified, Eisenbergiella, and Butyricimonas increased. Linear discriminant analysis effective size (LEfSe) was shown in Figure 4(a), where there were identified 34 biomarkers between the two groups (LDA score log10 > 3, p < .05). The cladogram showed that the biomarkers in the NC group were assigned to Adlercreutzia, RF39, Clostridia, Acutalibacter and Candidatus. In the HG group, Butyticimonas, Eisenbergiella and UGC_010 dominated at the genus level (Figure 4(b)). Effects of GLP on the structure and function of the fecal microbial community (n = 6). (a), community abundance of gut microbiota at the phylum level. (b), community abundance of gut microbiota at the genus level. (c), the effect of GLP on the relative abundance of gut microbiota at the genus level. Different structures of gut microbiota in the NC and HG groups, according to the LEfSe analysis. (a), linear discriminant analysis. Genera meeting a LDA score threshold >3. (b), cladogram plot of the biomarkers. Red indicates clades enriched in the GLP group, and green indicates clades enriched in the NC group.

Effects of GLP on global metabolomics profiling in serum
The PLS-DA plot demonstrated a complete separation between the NC and HG groups (Figure 5(a)). The permutation test results with 200 iterations suggested that the OPLS-DA model was stable without over-fitting (Figure 5(b)). By combining the fold change [FC; FC >2 (upregulation) or FC <0.5 (downregulation)] and the VIP (VIP >1) in the OPLS-DA model, a total of 42 differential metabolites were screened between groups, 37 of which were upregulated and five were downregulated (Figure 5(c), Supplemental Table S3). The matchstick diagram showed the FC in the expression of differential metabolites between the two groups (Figure 5(d)). Twenty-eight of 42 differential metabolites have KEGG information (Supplemental Table S3). The Differential Abundance Score (DA score) was used to further identify differential metabolic pathways in mice serum after GLP exposure. As shown in Figure 5(e), three metabolic pathways were identified (p < .05), with two being upregulated, which include pyrimidine metabolism and pentose phosphate pathway (PPP). Furthermore, pathway enrichment analysis revealed that PPP, pyrimidine metabolism, and taurine and hypotaurine metabolism were significantly enriched (Figure 5(f) and supplemental Table S4). The effects of GLP exposure on global metabolomics profiles in the serum. (a), PLS-DA score plot of metabolomic features between groups; (b), permutation test results for OPLS-Da models. (c), volcano plot of differential metabolites (GLP vs. NC, n = 6). Red and blue represented upregulated and downregulated metabolites, respectively. Gray, no differential expression. (d), the matchstick diagram showed the top 20 significantly changed metabolites in metabolomics analysis based on fold change. (e), differential abundance score for group GLP versus NC. (f), bubble plot for significantly changed pathway based on KEGG.
Correlations among gut microbiota, metabolites and biochemical indexes
To further examine the potential relationships among the intestinal microbial communities, serum metabolites, and biochemical index, spearman`s correlation analyses were performed. We noticed that several bacteria have strong correlations with a variety of metabolites (supplemental Table S5). The metabolites were significantly correlated with various bacteria are listed in Supplemental Table S6. As shown in Supplemental Figure S3, the result revealed that most gut microbiota and serum metabolites were significantly correlated with the serum biochemical indexes. Further screening found that there were 173 items with correlation among the three indicators, as shown in Supplemental Figure S3, and the detailed correlation coefficients are in Supplemental Table S7. For example, serum ALT concentration was positively correlated with the intensity of the metabolite Oleamide (r = 0.760, p = .004) and negatively correlated with gut microbiota Candidatus_Saccharimonas (r = -0.606, p = .037). In addition, Oleamide was negatively correlated with Candidatus_Saccharimonas (r = −0.741, p = .008). Serum DBIL concentration was positively correlated with Eisenbergiella (r = 0.619, p = .032) and Gluconic acid (r = 0.662, p = .019), and the relationship between Eisenbergiella and Gluconic acid was significantly positive (r = 0.908, p < .001). The concentration of GLU was significantly positively correlated with Eisenbergiella (r = 0.800, p = .002) and D-Ribose (r = 0.643, p = .028), and there was also a significant positive correlation between Eisenbergiella and D-Ribose (r = 0.769, p = .003). To visualise the correlation between differential microbes and metabolites, pathway enrichment analysis revealed that PPP and pyrimidine metabolism were significantly enriched, and we extracted representative differential metabolites from the two metabolic pathways, further, the bacteria with significant correlation were integrated, as shown in Figure 6. GLP exposure causes alterations in the pentose phosphate pathway and pyrimidine metabolism and is associated with altered intestinal communities.
Discussion
The widespread application of GLP increases the risk of human exposure, which raises concern regarding potential toxicity hazards to human health. Our previous results and other studies have shown that GLP can cause hepatotoxicity in the rodents.5,21 In the present study, 16S rDNA analysis of gut microbiota and serum metabolomics were performed to reveal the potential mechanisms of GLP-induced hepatotoxicity.
Recent studies have revealed the gut-liver axis may play a crucial role in liver diseases.22–24 However, no study has investigated whether the hepatotoxicity caused by GLP is associated with gut microbiota. The results in this study indicated that although GLP could not dramatically alter the bacterial diversity of fecal microbiota, the structural composition of gut microbiota at the phylum and genus levels showed remarkable changes.
Previous studies shown that Candidatus_Saccharimonas has anti-inflammatory properties and protective effects of colitis.25,26 In this study, GLP decreased the abundance of Candidatus_Saccharimonas, which has a negative correlation with ALT. These findings indicates that GLP-induced liver injury may be related to the reduced anti-inflammatory capacity of gut microbiota.
Eisenbergiella is a rod-shaped, non-proteolytic, non-motile anaerobic bacterium belonging to the Lachnospiraceae. During fermentation, Eisenbergiella produces succinate, lactate, butyrate and acetate. 27 This study found that GLP increased the abundance of Eisenbergiella which has a positive correlation with DBIL, suggesting that Eisenbergiella may involved in GLP-induced hepatotoxicity.
The liver plays an essential role in maintaining glucose homeostasis, especially the production of glucose in the fasting state, mainly through glycogenolysis and glucose production. In this study, we found an increase in serum GLU, which was positively correlated with Eisenbergiella and negative correlated with Candidatus_Saccharimonas, both of which regulate insulin sensitivity. The result indicated that the gut microbiota plays an important role in the glucose metabolism disorder caused by GLP.
The PPP is a way of GLU oxidation and breakdown, as well as a key anabolic pathway that produces ribose-5-phosphate for nucleotide synthesis. 28 This study found that the PPP pathway was activated in GLP-administrate rats, suggesting GLP disturbed the metabolism of nucleotide. Previous studies found that PPP downstream products uracil and pseudouridine accumulation are associated with liver function impairment.29,30 In this study, the serum concentrations of uridine, uracil and pseudouridine were significantly elevated, indicating that GLP may through disturbing the pyrimidine metabolic pathway and impair liver function.
In the present study, Candidatus_Saccharimonas, Adlercreutzia, and Clostridia_UCG_014_unclassified, which have anti-inflammatory effects,31,32 were negatively correlated with the PPP and pyrimidine metabolism. These results suggest that GLP may through disrupting PPP and pyrimidine metabolism and the homeostasis of the intestinal floras further reducing anti-inflammatory effects and triggering liver injury.
Although the present study revealed a strong link between microbes, metabolites, and biochemical indexes, we could not elucidate the causal relationship between microbiota and metabolites. Future studies, including gut microbiota transplantation and metabolic pathway inhibition, to clarify the underlying mechanisms of GLP-induced hepatotoxicity.
Conclusion
This study provides a comprehensive description of the disordered patterns of gut microbiota and serum metabolites in GLP-exposed mice. GLP induced hepatic injury, which may be related to the activation of the PPP and pyrimidine metabolism and dysbiosis of gut microbiota. Extensive research is still needed to explore gut microbiota–based strategies for alleviating GLP-induced hepatotoxicity.
Supplemental Material
Supplemental Material - Integrated gut microbiota and serum metabolomics reveal glyphosate-induced hepatic injury in mice
Supplemental Material for Integrated gut microbiota and serum metabolomics reveal glyphosate-induced hepatic injury in mice by Gang Li, Yu Cheng, Xiaolei Yang, Zijun Chai, Zhihui Mu, Hong Chao, Hongjie Li, Yanbo Qi, Lei Qi, and Jicheng Liu in Human & Experimental Toxicology
Footnotes
Author contributions
All authors involved in reviewing and editing the manuscript, and the decision to submit for publication. G.L.: Conceptualization, Investigation, Methodology, Data curation, Formal analysis, Writing- original draft. Y.C., Z.C., Z.M., Y.Q., H.L.: Investigation, Methodology, Data curation. H.C., X.Y.: Methodology, Visualization, Funding acquisition. L.Q. and J.L.: Conceptualization, Supervision, Funding acquisition.
Declaration of conflicting interests
The author(s) declared no potential conflicts of interest with respect to the research, authorship, and/or publication of this article.
Funding
The author(s) disclosed receipt of the following financial support for the research, authorship, and/or publication of this article: This work was supported by the Project of Qiqihar Academy of Medical Sciences Grant No. (QMSI2019M-23), No. (QMSI2023B-13), No. (2024-ZDPY-003), No. (QMSI2019M-05), Technology Plan Joint Guidance Project of Qiqihar Grant No. (LSFGG-2024100), Heilongjiang Provincial Postdoctoral Funding Project No. (LBH-Z24306), National Natural Science Foundation of China No. (82103869) and Fundamental Research Funds for the Department of Education in Heilongjiang Province No. (2020-KYYWF-0037) and No. (2019-KYYWF-1277).
Ethical statement
Supplemental Material
Supplemental material for this article is available online.
References
Supplementary Material
Please find the following supplemental material available below.
For Open Access articles published under a Creative Commons License, all supplemental material carries the same license as the article it is associated with.
For non-Open Access articles published, all supplemental material carries a non-exclusive license, and permission requests for re-use of supplemental material or any part of supplemental material shall be sent directly to the copyright owner as specified in the copyright notice associated with the article.