
Abstract
Pyrazinamide (PYZ)—an essential component of primary drug regimen used for the treatment and management of multidrug resistant or latent tuberculosis—is well known for its hepatoxicity. However, the mechanism of PYZ-induced hepatotoxicity is still unknown to researchers. Studies have shown that the drug is metabolized in the liver to pyrazinoic acid (PA) and 5-hydroxy pyrazinoic acid (5-OHPA) which individually may cause different degrees of hepatotoxicity. To evaluate this hypothesis, PYZ, PA, and 5-OHPA were administered to albino Wistar rats orally (respectively, at 250, 125, and 125 mg kg−1 for 28 days). Compared to normal rats, PYZ and its metabolic products decreased the weights of dosed rats and induced liver injury and a status of oxidative stress as assessed by combined histopathological and biochemical analysis. Compared to normal controls, the biochemical and morphological changes were more aberrant in PA- and 5-OHPA-dosed rats with respect to those dosed with PYZ. Finally, the serum metabolic profiles of rats dosed with PYZ, PA, and 5-OHPA were measured and compared with those of normal control rats. With respect to normal control rats, the rats dosed with PYZ and 5-OHPA showed most aberrant metabolic perturbations in their sera as compared to those dosed with PA. Altogether, the study suggests that PYZ-induced hepatotoxicity might be associated with its metabolized products, where 5-OHPA contributes to a higher degree in its overall toxicity than PA.
Introduction
Drug-induced hepatotoxicity is a crucial healthcare issue and one of the leading causes of morbidity and mortality around the world. 1 Individuals suffering from drug-induced liver injury exhibit a wide range of manifestations clinically, biochemically, and histologically including acute liver failure with severe encephalopathy, acute hepatitis with or without jaundice, and so on. 2 Therefore, it is necessary to assess drug-induced hepatotoxicity for the design of safer and better therapeutic agents. Within this framework, the recent study was performed to evaluate the mechanism of toxicity of pyrazinamide (PYZ) using albino Wistar rats.
PYZ, an amide derivative of pyrazine-2-carboxylic acid, is an essential component of the first-line drug for the treatment and management of multidrug resistant or latent tuberculosis (TB). 3 The drug is usually given in combination with isoniazid, rifampicin, mainly as an antibiotic course for a period of 6 months to TB patients as a standard treatment regimen. 4 Hepatotoxicity is the most serious complication arising from the first-line treatment of TB. 5,6 Previous studies unveiled that anti-TB drug-induced hepatotoxicity was more pronounced with PYZ than any other tubercular medication. 7 PYZ is reported to possess various side effects such as skin rashes, malaise, dysosmia, anemia, anorexia, gastrointestinal upset, arthralgia, photosensitivity, and hypersensitivity reactions. 8 –10 However, the major side effect associated with PYZ is hepatotoxicity which can be severe to lethal if not diagnosed properly in time. The mechanism of hepatic injury by PYZ is not known, but the drug is extensively metabolized by cytochrome 2E1, 3A4 in liver to pyrazinoic acid (PA), and 5-hydroxy pyrazinoic acid (5-OHPA), and injury may be caused either by the drug itself or its metabolites. 11,12 A recent investigation suggested that both these metabolites were toxic to normal human hepatocytes (Hep-G2 cells) in vitro. 13,14 No further in vivo investigations had been yet performed to evaluate whether PYZ or its metabolites (PA and 5-OHPA) cause the hepatotoxicity. To get the answer, PYZ and its main metabolites (PA and 5-OHPA) were administered orally (respectively, at 250 and 125 mg kg−1 day−1 of body weight) for 28 days to albino Wistar rats. First, we measured the various liver injury and oxidative stress–related parameters in liver and plasma to evaluate the comparative effect of PYZ and its metabolites. Reduced glutathione (GSH), catalase (CAT), superoxide dismutase (SOD), protein carbonyl (PC), malonaldehyde (MDA), bilirubin and biliverdin in liver tissues, and aspartate aminotransferase (AST) and alanine aminotransferase (ALT) in plasma were measured to evaluate the comparative effect of PYZ and its metabolites. Scanning electron microscopic (SEM) and histopathological studies of the liver tissues were also performed to evaluate the morphological changes. Like PYZ, the PA and 5-OHPA increased liver enzyme concentrations in plasma, decreased CAT, SOD, and GSH in liver tissues, and caused aberrant morphological changes of liver tissue as well compared to controls. Likewise, MDA, PC formation, and conjugated bilirubin and biliverdin deposition in liver were also increased in the similar experiment. Next, we employed nuclear magnetic resonance (NMR)-based metabolomics approach in combination with multivariate statistical analysis to evaluate the toxicity potential of PYZ and its metabolic products. Particularly, we performed serum metabolomics analysis to identify the biochemical perturbations induced by the parent drug PYZ and its metabolic product PA and 5-OHPA. To the best of our knowledge, in the present study, we report for the first time using NMR-based metabolomics that metabolites of PYZ might be responsible for its in vivo hepatotoxicity.
Materials and method
Animals
Male albino Wistar rats (80–100 g, of the same age group) were used for this experiment, and the prior protocol approval was taken from Institutional Animal Ethical Committee (Approval No. SDCOP&VS/AH/CPCSE01/017/R3). The animals were housed under standard laboratory conditions of temperature (25 ± 1°C) with a light/dark cycle of 12 h with free access to commercial pellet diet and water ad libitum. Animals were acclimatized to laboratory conditions for 1 week before the experiment.
Experimental design
All animals were randomly divided into four groups of six animals each. Drugs were suspended in 0.25% carboxy methyl cellulose (CMC), subjected to 28-day treatment orally. As reported previously, the PYZ administered at a dose of 250 mg kg−1 body weight causes substantial hepatotoxicity. It might be assumed that 50% of the PYZ is converted to PA and 5-OHPA after metabolism, thus we included the half dose (125 mg kg−1 body weight) for PA and 5-OHPA in the present study. Overall, the four groups were divided as follows: group I (normal control (NC)): 0.25% CMC (2 mL kg−1), group II: PYZ (250 mg kg−1), group III: PA (125 mg kg−1), and group IV: 5-OHPA (125 mg kg−1). The procedure was adopted from the literature by Zhang et al., 15 where it is shown that PYZ produced toxicity potential at 250 mg kg−1 dose for 28 days in liver of albino Wistar rats. After 28 days, rats were killed and blood samples were collected by heart puncture in sterile centrifuge tubes and kept at 37°C for 30 min, centrifuged at 2000 r min−1 for 10 min, and the pale yellow color supernatant was collected in a sterile microcentrifuge tube. The serum obtained was frozen immediately at −80°C prior to NMR spectroscopic analysis. Further, livers were dissected out and rinsed with ice cold saline and stored at −80°C for further studies.
Biochemical estimations
Plasma AST and ALT
Liver function biomarkers such as AST and ALT were estimated in plasma using commercially available kit from Transia Biomedicals Ltd., Baddi, Himachal Pradesh, India. 16 According to the manufacturer’s protocol, 100 µL of plasma samples was added to 1 mL of the working reagent and the absorbance at 340 nm was measured at regular intervals of 1 min for 3 min.

Tissue bilirubin and biliverdin
Bilirubin in the liver was measured as per the following procedure published earlier in the literature 17 with slight modifications (see the supplementary material, annexure I).
Determination of oxidative stress parameters
MDA, 18 PC, 19 and thiobarbituric acid reactive substances (TBARS) 18 were evaluated in the liver. In pancreatic tissue, other oxidative parameters such as tissue CAT, 18 reduced GSH, 20 and SOD 16 levels were measured in the similar experiment. The total protein content of each sample was measured using the Bradford reagent and bovine serum albumin was used as a standard. For detailed information on these experimental assays, see the annexure II of the supplementary material.
Histopathology and SEM analyses
Histopathological studies were also performed to find out the morphological changes of liver cells after PYZ and its metabolites (PA and 5-OHPA) administration. 21 Liver tissues from each group were assessed for their morphological changes using hematoxylin and eosin staining. The tissues were preserved in 10% formalin overnight. Next day, the cells again were superseded by 70% isopropanol overnight. Later, the tissues were exposed to isopropanol at various concentrations (70, 90, and 100%) and dehydrated by 100% xylene. The tissue samples were then embedded in bees wax and 5 μM sections were prepared by using microtome. Then, the tissues were succeeded by hematoxylin and eosin staining and observed under microscope (magnification 40×).
For SEM analysis, liver tissue samples were collected (2–4 mm) and fixed in 2.5% glutaraldehyde for 2–6 h at 4°C for primary fixation. Then, the samples were washed with 0.1 M phosphate buffer for 15 min at 4°C. After that, 1% osmium tetroxide was used as a post-fixation for 2 h at 4°C. Again, the samples were washed in 0.1 M phosphate buffer for three times at 15-min interval and kept at 4°C. Later, these samples were dehydrated with acetone at various concentrations (30%, 50%, 70%, 90%, 95%, and 100%). After that, all specimens were air dried at room temperature and critical point drying (31.5°C at 1100 psi). Finally, samples were mounted on to the aluminum stubs with adhesive tape and observed for the morphological changes using SEM (JEOL JSM-6490LV).
1H NMR-based metabolomics method
Sample preparation
The stored serum samples were thawed and 250µL of serum was mixed with 250 µL 0.9% saline sodium-phosphate buffer (20 mM, pH 7.4) in D2O. The samples were then centrifuged at 10,000 r min−1 for 5 min at 4°C to remove any precipitates, before acquiring the NMR data. A total 400 µL of the supernatant was used in 5 mm NMR tubes (Wilmad Glass, USA) for data acquisition with a coaxial insert containing 0.1% TSP (sodium salt of 3-trimethylsilyl-(2,2,3,3-d4)-propionic acid) as an external standard reference to aid metabolite quantification via the NMR experiment. Deuterium oxide (D2O; as a cosolvent and to provide a deuterium field/frequency lock) and sodium salt of trimethylsilylpropionic acid-d4 (TSP) were purchased from Sigma-Aldrich (Rhode Island, USA).
NMR measurements
NMR spectra were recorded at Bruker Biospin Avance-III 800 MHz NMR spectrometer, running at a proton frequency of 800.21 MHz. The NMR instrument was equipped with CryoProbe with shielded maximum gradient strength output of 53 G cm−1. The raw NMR data were acquired on Topspin-V2.1 (Bruker Biospin Software). For each serum sample, transverse relaxation-edited Carr–Purcell–Meiboom–Gill (CPMG) NMR spectra were acquired using the standard Bruker’s pulse program library sequence (cpmgpr1d) with presaturation of the water peak through irradiating it continuously during the recycle delay (RD) of 5 s. Each spectrum consisted of the accumulation of 128 scans and lasted for approximately 15 min. A total spin–spin relaxation time of 60 ms (n = 300 and 2τ = 200 δs) was applied to remove broad signals from triglycerides, proteins, cholesterols, and phospholipids. Each free induction decay (FID) was zero filled and Fourier-transformed to 64 K data points following manual phase and baseline correction using Bruker NMR data Processing Software Topspin-V3.0. A line broadening factor of 0.3 Hz and a sine–bell apodization function were employed to FIDs before Fourier transformation (FT). After FT, the chemical shifts were referenced internally to methyl peak of lactate (at δ = 1.33 ppm). To obtain spectra with signals only from lipids or lipoproteins, the diffusion-edited (DE) 1D 1H NMR spectra were recorded using the standard Bruker’s pulse program library parameters (ledbpgp2s1d i.e. 1-dimensional longitudinal eddy current bipolar gradient pulse presaturation with two stimulated echoes). The spectra were measured using sine-shaped gradient pulses of strength 30% and a duration of 1.5 ms followed by a delay of 200 μs to allow for the decay of eddy current, a diffusion time of 120 ms, and an eddy current decay time of 5 ms. The relaxation delay was 4 s and water peak irradiation was applied during the RD and the delay after the first BPP. A line broadening factor of 1 Hz was applied to FIDs before Fourier transformation. The FIDs were processed using exponential line broadening of 1.0 Hz; spectra were recorded with 128 scans and zero filled to 64K points before Fourier transformation. All recorded spectra were visually monitored for acceptability and subjected to multivariate statistical analysis to discriminate the altered metabolic patterns.
Spectral assignment
For the assignment of various peaks in the 1D 1H CPMG and DE NMR spectra, chemical shifts were identified and assigned by comparing them with the chemical shifts available with the software Chenomx 8.1 (Chenomx Inc., Edmonton, Canada). The remaining peaks in the CPMG 1H NMR spectra were assigned by adopting previously reported NMR assignments of metabolites, and data obtained from BMRB database (Biological Magnetic Resonance Data Bank) and HMDB (The Human Metabolome Database) 22 –24 for DE 1H NMR spectra assignment were done using previously reported assignments of metabolites in literature. 25 –27
Multivariate statistical analysis
Before multivariate data analysis, all the NMR spectra were manually phased and baseline corrected using TopSpin3.0 (Bruker NMR data Processing Software). For multivariate analysis, the CPMG δ(8.5–0.5) ppm and DE δ(6.0–0.5) ppm spectra were binned and integrated automatically using AMIX package (version 3.8.7; Bruker, BioSpin). To be noted here is that the 1HCPMG spectra contain signals both from low-molecular-weight (MW) metabolites and lipid metabolites. The quantitative difference of lipid signals may understate the discriminatory importance of metabolites present in less abundant; therefore, by excluding them from the analysis allows better quantitative comparison of low MW metabolites and surmounts their discriminatory importance as well. Therefore, excluding the lipid signals from the data matrix has been employed here to explore the metabolic alterations for the metabolites other than lipids/fatty acids. The spectral regions corresponding to water and lipids excluded from the CPMG data set were δ(5.505–4.705), δ(5.505–3.575), δ(3.35–3.33), δ(3.225–3.055), δ(2.705–2.655), δ(2.565–2.525), δ(1.405–1.075), and δ(0.9–0.5), whereas for DE spectra, the spectral region δ(5.0–4.7) ppm distorted due to water was excluded. Finally, the selected regions were reduced to spectral bins of δ(0.01) ppm and δ(0.05) ppm, respectively, for CPMG and DE spectra, and each spectral bin is further normalized using the total spectral intensity to eliminate the dilution effect among samples and to give the same total integration value for each spectra.
The binned data both from CPMG and DE experiments were subjected to multivariate data analysis using web-based tools available with open access server MetaboAnalyst (version 3, from the University of Alberta, Canada). 28 –30 For each data set, NMR variables were Pareto scaled and subsequently subjected to unsupervised principal component analysis (PCA) for an initial overview of the grouping trend, which displays the internal structure of data sets in an unbiased way and reduces the dimensionality of data (i.e. intrinsic clustering) and outliers within the data set. Next, the data were modeled with the supervised method of partial least squares discriminant analysis (PLS-DA) to reveal class separations between the groups and to further identify the metabolites responsible for class separation. The PLS-DA models were cross-validated by a permutation analysis (100 times), and the resulting cross-validation parameters R 2 and Q 2 were used to assess the quality of the PLS-DA models, that is, the goodness-of fit parameter by R 2 (also referred to as explained variance) and the goodness of prediction parameter by Q 2 (or the predictive capability of the model). The PLS-DA model was further used to identify the metabolites responsible for the discrimination based on their higher values of variable importance on projection (VIP) scores 31 and exhibiting statistical significance as evaluated based on 0.05 level of probability, that is, p-value < 0.05 (calculated using Mann–Whitney test for pair wise comparisons). The VIP score represents a weighted sum of squares of the PLS loadings and takes into account the amount of explained Y-variation in each dimension to measure the impact of each metabolite in the model. Generally, metabolites with high impact have VIP values higher than one. In this study, the VIP score cut-off value ≥2 for CPMG and ≥1 for DE data were used for discriminatory significance. The box plot representation (evaluated through univariate analysis) was used to visualize the variation in the levels of significantly altered metabolites, identified in the multivariate analysis.
Results
Biochemical parameters
Plasma AST and ALT
According to Table 1, both ALT and AST levels in plasma were increased in all treatment groups with respect to the control. It was observed that the levels of these enzymes were dramatically increased (twice than NC) after oral administration of PYZ and it metabolites. Both enzyme levels were more increased for PA and 5-OHPA than PYZ.
Biochemical parameters determined to evaluate the liver toxicity effects produced by PYZ, PA, and 5-OHPA after oral administration for 28 days.a

ALT: alanine aminotransferase; AST: aspartate aminotransferase; PYZ: pyrazinamide; PA: pyrazinoic acid; 5-OHPA: 5-hydroxy pyrazinoic acid; SOD: superoxide dismutase; CAT: catalase; PC: protein carbonyl; MDA: malonaldehyde; ANOVA: analysis of variance.
aData are represented as mean ± SD (n = 6). Parameters in rows 5–9 represent the oxidative stress parameters in the liver after oral administration for 28 days. Statistically significant differences were observed between the control and test groups (one-way ANOVA followed by the Bonferroni multiple comparison test).
b p < 0.01.
c p < 0.05.
d p < 0.001.
Liver bilirubin and biliverdin
Measurement of conjugated bilirubin and biliverdin was the important parameter for hepatotoxicity. We observed that both bilirubin and biliverdin levels were increased in toxicant groups. As shown in Table 1, bilirubin level was increased three times for both PA (approximately 85 ng dL−1) and 5-OHPA (approximately 116 ng dL−1) than NC (approximately 34 ng dL−1). PYZ demonstrated similar result like normal. Similar trend was observed for biliverdin where we found that biliverdin level also slightly increased for both PA and 5-OHPA than NC.
Determination of oxidative stress parameters
We also observed various oxidative stress parameters in the liver to evaluate the toxicity potential of PYZ and its metabolites. Various oxidative stress parameters such as SOD, CAT, GSH, TBARS, and PC in liver were also measured in the similar experiment. We observed that there was a dramatic reduction of reduced GSH in both PA (approximately 0.56 µM) and 5-OHPA (approximately 2.02 µM) than NC (approximately 11 µM). There was a slight reduction of GSH level for PYZ (approximately 7.75 µM) (Table 1).
Similar trend was observed for SOD, where we also found that SOD level decreased to 20–30% both for PA and 5-OHPA as compared to the normal group. 5-OHPA revealed highest toxicity than other toxicants. Similar observation was observed for CAT assay where we found that this enzyme activity was lower for both PA and 5-OHPA than NC (Table 1).
Separately, we measured tissue MDA and PC formation to evaluate the oxidative stress caused by toxicant. The MDA formation was double for both PA (approximately 119 nM) and 5-OHPA (approximately 101 nM) than normal (approximately 51 nM). Again, we observed that PC formation was higher for both PYZ metabolites (approximately 0.19 and 0.17 µM for PA and 5-OHPA) than NC (approximately 0.04 µM; Table 1).
Histopathology and SEM analysis of liver
According to Figure 1(a), we observed Kupffer (K) cells with normal architecture of nucleus. In both positive toxic control and treated samples, there was presence of degenerated nucleus (dN) in Kupffer cells (K) and also ruptured Kupffer cells (RC; Figure 1(b) to (d)). However, the RC was present more in metabolite-treated rats as compared to PYZ. The representative SEM images are shown in Figure 1(a′) to (d′). Consistent with histopathological analysis, SEM analysis also revealed that the rats dosed with PA and 5-OHPA exhibit more aberrant lesions in their liver than toxic control.

(a–d) Histopathology and (a′–d′) SEM analysis of liver: (a/a′) control, (b/b′) PYZ, (c/c′) PA, and (d/d′) 5-OHPA. Lesions were found in PYZ, PA, and 5-OHPA groups with respect to control (nucleus (N), Kupffer cell (K), degenerated nucleus (DN), ruptured hepatic cells (RC)). We observed prominent DN and RC in PYZ (toxic control) and 5-OHPA groups; these features was less prominent in PA group and absent in normal control group. As evident from SEM analysis, the hepatic lesions are increasingly prominent in PYZ, PA, and OHPA groups with respect to control. SEM: scanning electron microscope; PYZ: pyrazinamide; PY: pyrazinoic acid; 5-OHPA: 5-hydroxy pyrazinoic acid.
Serum metabolomics to assess the biochemical effects of PYZ and its metabolic products
The representative 1D 1H CPMG NMR spectra of rat serum samples obtained from different groups with the assigned resonances of relevant metabolites are shown in the supplementary material (Figure S1). No additional NMR signals were observed in the sera of treated rats compared to the NC rats suggesting that the sera of treated rats were either not containing any drug molecules or their concentrations in the sera were below the NMR detection range (i.e. <5 µM; see supplementary material, Figure S2 to S3). The NMR spectra showed signals mainly from lipids/lipoproteins (e.g. low-density lipoprotein (LDL), very low-density lipoprotein (VLDL), polyunsaturated fatty acids, etc.) and amino acids (AAs; e.g. alanine, valine, lysine, leucine, isoleucine, phenylalanine, histidine, tyrosine, glutamine, glutamate, proline, etc.). Other identified metabolites were glucose, choline, creatine, creatinine, pyruvate, acetoacetate, acetate, citrate, lactate, N-acetyl glycoproteins (NAG), and O-acetyl glycoproteins (OAG).
Multivariate data analysis
The PCA score plots revealed the differences and separation among the groups (Figure 2). A supervised PLS-DA model was further used to discover the difference among groups. The applied PLS-DA to the 1D 1H NMR data was helpful to determine the extent of differences between the groups, as shown in Figure 3, derived from the CPMG spectra (Figure 3(a) to (d)) and DE spectra (Figure 3(e) to (h)). The PLS-DA score plots of serum samples demonstrate a clear discrimination of PYZ, PA, 5-OHPA from the NC group (Figure 3). For determining the differences among the different classes, the pairwise PLS-DA analysis was also performed with respect to NC group and the resulted 2D score plots highlighting the metabolic differences induced by the treatments: PYZ, PA, and 5-OHPA are shown in Figure 3. As evident from the group separation in PLS-DA 2D score plots, the small serum metabolites are discriminating the groups more compared to lipid metabolites. As evaluated based on R 2 and Q 2 values, the discriminatory models were more robust for PYZ and 5-OHPA groups with respect to the controls than between PA and NC groups. In other words, the PYZ (dosed at 250 mg kg−1) and 5-OHPA (dosed at 125 mg kg−1) toxicity potential was higher than the PA as PA group is lying closer to NC group than the PYZ and 5-OHPA groups when compared with respect to the NCs (Figure 3). To further evaluate the toxic effects of aforementioned treatments, the PA and 5-OHPA groups were separately compared to PYZ positive toxic control group, as shown in Figure 4. Pairwise PCA and PLS-DA model analysis revealed that the PYZ and 5-OHPA overlapped to form an intermittent cluster, whereas PA formed an independent discriminant cluster further suggesting that the PYZ and 5-OHPA are causing the same degree of toxicity. This is in concordant to our assumption as well where we have assumed that PYZ is metabolized in the liver into PA and 5-OHPA. If 250 mg dose of PYZ is metabolized into 125 mg 5-OHPA and 125 mg PA, and if 5-OHPA is the main toxic component, its toxicity potential at 125 mg kg−1 dose should reach to that of PYZ at 250 mg kg−1 dose. As reported previously, 14 PA is also metabolized to 5-OHPA by the enzyme xanthine oxidase. Therefore, the observed toxicity of PA at 125 mg kg−1 dose (as inferred in SEM and histopathological analysis) might also be partly because of 5-OHPA (a common metabolite of PYZ/PA metabolism). The observed metabolic response as evaluated based on PLS-DA discriminant model parameters (including R 2, Q 2, see Figure 4) supports this hypothesis that the 125 mg kg−1 dose of 5-OHPA is almost producing the same effect as produced by 250 mg kg−1 dose of PYZ (i.e. toxic control group here), suggesting that the toxicity of PYZ could be mainly because of its metabolite 5-OHPA. The heat map analysis (supplementary material, Figure S6) further corroborated this conjecture where the upregulated and downregulated metabolite entities are visually following the same pattern in 5-OHPA sample PYZ, whereas these are distinctly different from the NC and PA groups.

PCA 2D scores plots derived from 1D 1H (a–d) CPMG and (e–h) DE, NMR spectra. The various groups compared are well evident from the figure. (a) and (e) represent the PLS-DA analysis involving all the four groups, whereas (b–d) and (f–h) DA represent the paired analysis. The shaded areas are the 95% confidence regions of each treatment as depicted by their respective colors. PCA: principal component analysis; DE: diffusion edited; NMR: nuclear magnetic resonance; PLS-DA: partial least squares discriminant analysis.
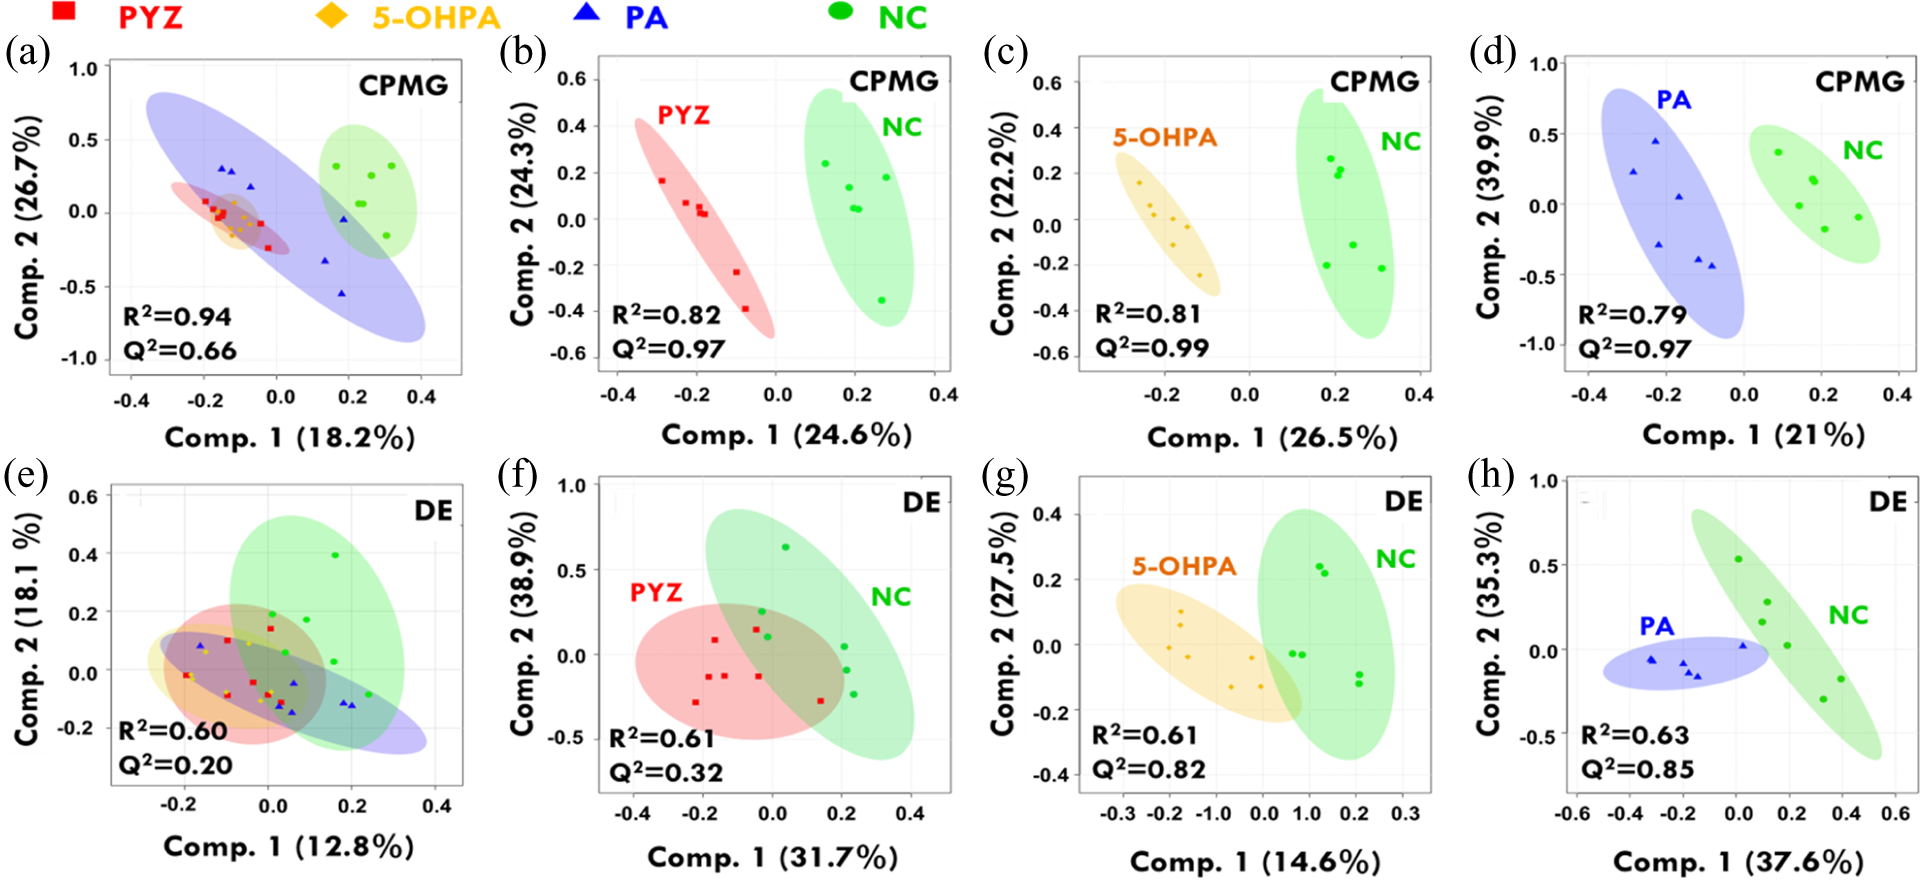
PLS-DA 2D scores plots derived from 1D 1H (a–d) CPMG and (e–h) DE, NMR spectra. The various groups compared are well evident from the figure. (a) and (e) represent the PLS-DA analysis involving all the four groups, whereas (b–d) and (f–h) DA represent the paired analysis. The shaded areas are the 95% confidence regions of each treatment as depicted by their respective colors. PCA: principal component analysis; DE: diffusion edited; NMR: nuclear magnetic resonance; PLS-DA: partial least squares discriminant analysis.

2-D scores plots derived from the PCA (a, d) and PLS-DA (b, e) analysis of 1D 1H CPMG NMR spectra. The treatment groups compared are well evident from the figure: (a, b) 5-OHPA vs. PYZ and (d, e) PA vs. PYZ. The shaded areas are the 95% confidence regions of each treatment as depicted by their respective colors. PCA: principal component analysis; PLS-DA: partial least squares discriminant analysis; CPMG: Carr–Purcell–Meiboom–Gill; NMR: nuclear magnetic resonance; 5-OHPA: 5-hydroxy pyrazinoic acid; PYZ: pyrazinamide; PA: pyrazinoic acid.
Metabolic perturbations induced by PYZ, PA, and 5-OHPA treatments
In order to evaluate the metabolic differences, the significantly altered metabolite entities were identified based on discriminant (PLS-DA) analysis of serum samples of NC and PYZ-dosed toxic control rats (PYZ) using criteria as described in “Multivariate statistical analysis” section. The perturbed metabolite entities responsible for class separation are mainly related to energy and lipid metabolism (Table 2; also see supporting information, Figures S4 to S7). Compared to NC rats, 19 serum metabolic markers were identified significantly perturbed in the PYZ group as listed in Table 2. The serum levels of membrane metabolites (choline/GPC), NAG, and OAG were found to be significantly elevated in PYZ-dosed rats, whereas the serum levels of lipid bound fatty acids and lipoproteins (LDL/VLDL) were decreased. These serum metabolic perturbations were relatively more predominant in rats dosed with 5-OHPA and PA compared to PYZ group (Figure 5 and Table 2). Other serum perturbations involved increased levels of glucose, glutamine, pyruvate, citrate, and TMAO, whereas the serum levels of lactate, glutamate, alanine, creatine/creatinine, and branched chain amino acids (leucine, valine, etc.) were significantly decreased in the PYZ group.
Details of metabolites best describing the variation between PYZ-, PA-, and 5-OHPA-administered group with respect to the control group.a

FHD/MHD: high PYZ-dosed female/male rats. PYZ: pyrazinamide; PA: pyrazinoic acid; 5-OHPA: 5-hydroxy pyrazinoic acid; NMR: nuclear magnetic resonance; NC: normal control; LDL: low-density lipoprotein; VLDL: very low-density lipoprotein; LpFA: lipid bound fatty acid; NAG: N-acetyl glycoproteins; OAG: O-acetyl glycoproteins.
aThe up (↑) and down (↓) arrows represent, respectively, increased and decreased metabolite levels. The metabolic changes have also been compared to previous studies reporting NMR-based serum metabolic biomarkers of hepatotoxicity. 32,33,34 “–” represents metabolite not significant in the group; the metabolites 1–15 belong to CPMG spectra and 15–19 belong to diffusion-edited spectra. For visualization interpretation, single (↑,↓), double (↑↑,↓↓), and triple (↑↑↑,↓↓↓) arrows are used to represent high, higher, and highest change in the mean value of the metabolite concentration (as seen in their respective box plots, Figure 5).
b p < 0.05.

Box–whisker plots of metabolites that were significantly perturbed across the groups derived from CPMG spectra. The open circles denote outliers in each group. CPMG: Carr–Purcell–Meiboom–Gill.
Discussion
Histopathological and oxidative stress–related parameters revealed PYZ-induced hepatotoxicity mechanism
The liver plays a prominent role in the lipid metabolism, dictating lipoprotein production, export, and clearance to and from the circulation. 35 The mechanism of hepatotoxicity induced by PYZ is still unknown to researcher. A recent research 14 assumed that both PA and 5-OHPA were the main metabolites that might be responsible for PYZ-induced hepatotoxicity. They observed the toxicity in in vitro cell line (HepG2 cells) and found that both metabolites were more toxic than parent PYZ. 14 Further investigation had not been performed yet to evaluate whether PYZ is toxic or its metabolites in in vivo. To evaluate the mechanism of hepatotoxicity, we estimated plasma AST and ALT levels of different groups. Our results collectively suggested that all the enzyme levels were higher for PA and 5-OHPA than PYZ and control. Both AST and ALT are the key enzymes of liver which are extracted out during liver damage. 18 Increase in these enzyme levels in plasma during metabolites treatment indicated the hepatic damage caused by PA and 5-OHPA. This was an indirect indication of liver damage. Therefore, we performed various biochemical estimations of the liver to evaluate the mechanism of toxicity. The PA- and 5-OHPA-treated rats depleted more GSH than PYZ and control groups. GSH is a tripeptide which is most abundant in all tissues including the liver. GSH has a major role in oxidation–reduction process, resulting in the formation of disulfide GSH 20 during oxidative damage. Reduction of GSH level by these two metabolites is an indication of oxidative stress–induced liver damage.
To prove the oxidative damage–induced hepatotoxicity, the tissue MDA levels were also measured. Oxidation of lipids is another important parameter to measure the oxidative stress in living body. 18 From the result, it was observed that the tissue MDA level was higher for PA- and 5-OHPA-treated groups. In order to find the relationship between oxidative stress and hepatotoxicity, PC assay was performed, where higher amount of PC was found among metabolite-treated groups. The carboxyl group of protein becomes oxidized due to the formation of reactive oxygen species 36 and converted to PC which is an important marker for oxidative stress. PA- and 5-OHPA-treated groups formed more PC than NC. Both PC and MDA assay signified that oxidative damage occurred to liver cells during metabolites treatment.
For further measurement of oxidative stress, we measured both CAT and SOD enzyme levels in the liver. The enzyme CAT is also most abundant in the liver which catalyzes the conversion of H2O2 to corresponding oxygen and water. This enzyme action is reduced due to the presence of peroxides and reactive oxygen species. 37,38 H2O2 levels were measured, and values were compared between various treated groups. Increase in the concentration of H2O2 in PA- and 5-OHPA-treated rats depicted that there were less amount of CAT enzyme available in the tissue to decompose the H2O2 with respect to the control and other treated groups. This assay indirectly indicated that oral administration of PA and 5-OHPA reduced the level of CAT enzyme in the liver. Separately, the estimation of SOD levels in the liver was performed. SOD is a free radical scavenging enzyme that neutralizes superoxide free radical in normal physiological situations. 39 Again, SOD levels were also decreased among the metabolite-treated rats, but this enzyme level became normal in PYZ-treated rats. Therefore, we concluded that both metabolites reduced these enzyme levels during oxidative damage in the liver which was less prominent during PYZ administration.
Bilirubin and biliverdin are the liver pigment whose concentrations were increased during liver damage. Rifampicin inhibited uptake and excretion of bilirubin in a dose-dependent manner and increased hyperbilirubinemia, due to blockade of uptake of plasma membrane of the hepatocytes. Bilirubin caused damage of liver cells via bleaching action. 40 When we administered PYZ and its metabolites, we observed that both metabolites increased the concentration of conjugated bilirubin in the liver. PA- and 5-OHPA-treated rats increased this concentration twice and thrice than NC, respectively, and produced hyperbilirubinemia and liver damage through bleaching action.
For direct evidence of liver damage, histopathology and SEM analyses of liver were performed. The results obtained from histopathological studies reflected the toxicity caused by PA and 5-OHPA and showed a remarkable damage of the architecture of liver cells. The present detected necrosis of the hepatic cells of rats treated with metabolites might be attributed to the formation of free radicals, which acted as a stimulator of lipid peroxidation and protein oxidation and simultaneously destruction of cell membrane. This action was less prominent in PYZ-treated rats. SEM analysis of liver tissue also supported our hypothesis, and we observed lesions in PA- and 5-OHPA-treated rats which were also less prominent in PYZ-treated groups.
Serum metabolic changes to get insights into PYZ-induced hepatotoxicity
Our investigation identified 19 metabolites that were perturbed in the treatment group as compared to the control. Consistent with previous NMR-based metabolomics studies involving rat serum, 32,33 the serum levels of choline/GPC, NAG, and OAG were found to be elevated, indicating an inflammatory mechanism prevailing in PYZ-dosed rats and so in the case of rats dosed with PYZ metabolites. The depleted level of the total lipid is caused by severity of the liver disease and has been reported in a number of studies associated with liver diseases such as nonalcoholic fatty liver disease (NAFLD), alcoholic liver disease, hepatitis C, hepatitis B, cholestatic liver disease, and cirrhosis. 41,42 Consistent with these reports, in our NMR study, we also found significantly decreased serum levels of apolipoproteins (LDL/VLDL) in PYZ, PA, and 5-OHPA groups compared to the control group, whereas choline was found to be elevated in the sera. Similar lipid dysregulation has also been found to be associated with a number of liver diseases and in cancer suggesting an altered lipid metabolism. 43,44 Cell toxicity may involve inflammation and oxidative stress further leading to lipid peroxidation. 45 The function of LDL/VLDL is to deliver cholesterol to cells, where it is used in the membrane synthesis. Choline, an important constituent of the cell membrane and phospholipid metabolism, is the breakdown product of phoshotidylcholine. Therefore, the increase in serum choline and phosphocholine concentrations, together with a decreased serum level of lipids and lipoproteins, demonstrates that the liver toxicity is related to significant disruption of the cell membrane and the increased lipid utilization in the synthesis of membrane metabolites (choline/GPC) to sustain the membrane repair.
A general comparison of the control group with PYZ, PA, and 5-OHPA groups also showed a significant increase in glucose accompanied by lactate, suggesting disturbed glucose metabolism with dampened aerobic glycolytic activity in liver toxicity. With respect to NCs, the most significant changes in energy metabolites were observed in PYZ and 5-OHPA compared to PA. Hyperglycemia results from oxidative stress, insulin resistance, glucose intolerance, and diabetes. 46 Oxidative stress results from structural and functional abnormalities affecting multiple metabolic pathways. During oxidative stress, the glucose metabolism shifts from aerobic to anaerobic pathway to meet its energy demands. However, the process being less efficient cannot keep up with the production and utilization of adenosine triphosphate (ATP), the intracellular concentration of ATP drops, and the depletion of cytosolic glucose. Hence, the metabolism switches from glycogenolysis to gluconeogenesis. Consistent with such physiological mechanisms, our results also indicated an increased level of tricarboxylic acid (TCA) cycle intermediates, that is, citrate and pyruvate in the sera of PYZ and 5-OHPA group. Citrate serves as a regulator of glycolysis and gluconeogenesis and thus regulates blood glucose levels. 47 Increased levels of citrate have also been reported in cirrhosis and hepatocellular carcinoma, attributed to a reduced capacity for citrate clearance in cirrhotic patients, 48,49 and also involved in the metabolic pathway of de novo lipid biosynthesis. 50 The relatively high levels of pyruvate in the serum might be attributed to energy metabolism alterations of the TCA cycle and glycolysis. Along with this, ketone bodies (acetone and acetate) were also found to be elevated. The high levels of ketone bodies reported in serum could be due to increased energy requirements. Liver plays a cardinal role in maintaining the serum glucose levels; excess glucose is converted into glycogen or fatty acids which are further processed and utilized by the body. 51,52 Due to impaired liver function, liver’s efficacy in removing the excess glucose from the serum is dampened. 53 The cumulative effects of all these pathologies seem to be frequently associated with alcoholic, NAFLD, cirrhosis, and hepatitis C virus (HCV). 54 –56 Alterations in glucose homeostasis have been associated with increased severity of liver disease and an elevated risk of liver carcinoma. 57 The upregulation of glucose in serum is also accompanied by a downregulation of glycerol that can be converted to glucose in the liver and provides energy for cellular metabolism, which suggested that the rates of glycogenolysis and glycolysis increased because of inhibited lipid metabolism in these animals. Serum creatine and creatinine levels were also significantly reduced. Creatine is synthesized primarily in the kidney, pancreas, and liver; a great deal of creatine present in the body is in the phosphorylated form of phosphocreatine in the muscles and acts as an instant source of energy. The discrepancy in creatine and creatinine levels accords well with the interplay between liver and renal dysfunction in liver disease. Moreover, creatine has antioxidant properties, and its diminished levels could be pertained to oxidative stress. 58 Along with this, guanidoacetate acid (GAA), which is a major constituent in the synthesis of creatine, was also found to be downregulated. GAA is readily converted to creatine in rat hepatocytes in collaboration with the kidney enzymatically. 59 The drug-induced toxicity to liver enzymes might be responsible for the decrease level of GAA and creatine.
AAs are the key metabolites involved in a number of chemical and physiological processes and play an impeccable role in catabolism and anabolism. 60 Not only to this but they are also equally important for protein biosynthesis as well as biosynthesis of several biogenic amines essential for survival in conditions of acute stress. 61 The disturbances of AAs reflect cellular needs for a higher turnover of structural proteins in maintaining energy homeostasis under hypoxic conditions. Under oxidative stress, the metabolism switches from aerobic to anaerobic pathway to carry out the vital cellular processes. The lipids and carbohydrates cannot be utilized as an energy source due to the limited supply of oxygenated blood in a hypoxic environment, and the reliance on alternative energy substrates (AAs) increases which can be oxidized anaerobically with a lower contribution to acidosis. Our results were consistent with these studies that leucine, valine, glutamate, proline, and alanine were markedly decreased in 5-OHPA-treated group. The levels of glucogenic amino and ketogenic AAs (glutamate, alanine, valine, and leucine) were found to be dampened. It is an important part for excretion of the nitrogenous waste and a key energy metabolite to be metabolized during oxidative stress condition. It is considered to be biologically very important for maintenance and promotion of cell function. The demands of the body for glutamate and glutamine are enormous during critical illness, and their blood concentration may rise and fall during the recovery phase. 62,63 Consistent with this, as reported in a number of studies, serum glutamine and glutamate ratio may be a useful method to estimate the pathophysiological state of patients with liver diseases. 64,65 Decreased level of proline suggests altered collagen metabolism as proline is the end product of collagen metabolism and excess AAs are stored in collagen; during oxidative stress, collagen is released and used to generate energy in the time of crisis. Proline metabolism is of particular importance in nutrient stress, as it is interchangeably converted into glutamate and glutamine. 66 The low serum levels of AAs have also been shown to be closely related to protein-energy wasting, inflammation, and oxidative stress. The up and downregulated metabolites thus suggest perturbed glycolysis and lipid metabolism in liver disease consistent with a number of studies. 67
Using 1H-NMR DE data from serum, the NAG and OAG were found to be elevated in the spectra of serum from the treatment group compared with the control group. The O-acetylated carbohydrate-bound protein resonance found in rat blood serum is an alternate “acute-phase” glycoproteins in animal models of human inflammatory conditions. 68 Acetyl-glycoproteins (both N and O) are acute phase proteins, acting as inflammatory mediators, and could be a response to tissue damage, and thus, the increased concentrations of serum NAG and OAG were likely to reflect an inflammatory response. Elevated levels of NAG and OAG in blood serum of oxidatively stressed animals are consistent with previous investigations of the metabolic response to stress. 69 The concentrations of serum “acute-phase” NAG are markedly elevated in a range of abnormal clinical conditions, including inflammatory disease, cancer, and certain liver diseases. 70 The present observations provide supportive evidence for systemic inflammation associated with liver injury, in agreement with the actions of other serum inflammatory markers. Thus, increased levels of NAG and OAG are likely to indicate hyperglycemia-induced inflammation in our study.
Biomedical relevance
An individual’s susceptibility to drug toxicity can be predicted from the metabolomic analysis of urine or serum samples of the individual before drug exposure. One of the major areas of research in pharmaceutical drug discovery is directed toward the identification of biomarkers of drug toxicity, efficacy, and selectivity that can be used in preclinical and clinical studies of drug. 71,72 There is a substantial need to identify and develop new diagnostic and prognostic biomarkers that can precisely anticipate toxicity in the preclinical development of chemical entities early in the drug development process. In this regard, the NMR-based metabolomics—involving biofluids collected through minimally invasive procedures—is currently the technique of choice for rapid screening of biochemical effects induced in response to a drug. The identified metabolic patterns may be used as early biomarkers of toxicity as well. 73 Therefore, we believe that the metabolic disturbances as evaluated here related to drug-induced liver injury (DILI) will be of potential biomedical relevance to guide the future clinical studies aiming to evaluate the efficacy and safety of new drug candidates.
Liver, being the principal site for the metabolism of the drugs, makes it primarily targeted sites of drug toxicity. The drug itself or its metabolic products can be toxic, making the organ susceptible to injury and may play an important role in the development of anti-TB DILI. There are no conventional road maps for the treatment and management of TB in correlation to the severity of liver disease. Identification of risk factors associated with DILI is important; as no specific treatment exists for the prevention or treatment of hepatotoxicity and also no specific early diagnostic biomarkers exists. However, the available ones such as microRNAs, cytokeratin-18 (CK18), and high-mobility group box protein-1 have not yet been approved for mundane clinical use. 74 A high risk of multidrug-resistant TB is another major issue due to prolonged and interrupted treatment. 75 Frequency of hepatotoxicity is increased in patients with liver dysfunction, frequently leading to severe liver failure culminating in death or liver transplantation. Henceforth, there is an utter need for novel diagnostic and prognostic biomarkers of early liver injury, for treatment monitoring and overall management of the drug therapy especially in endemic area for TB and liver disease. 76 The study revealed that the rats dosed with 5-OHPA showed most severe changes in liver histopathology as well as most prominent and aberrant metabolic changes similar to PYZ with respect to PA and NC rats. The major serum metabolic changes observed in rats dosed with 5-OHPA were increased levels of glucose, pyruvate, citrate, glutamine, NAG and OAG, and ketone bodies along with the decreased level of lipids, creatine/creatinine, and glucogenic AAs. The metabolic perturbations suggested energy deficit, oxidative stress, inflammation, and muscle degradation due to hypolipidemia associated with liver injury.
The possible reason for higher degree of hepatotoxicity associated with 5-OHPA could be its predominance existence in the keto form which imparts lipophilic nature to the metabolite and thus complications associated with PYZ. To confirm this hypothesis, future studies are required, which will compare the toxicity of PYZ/5-OHPA with 5-methyl-PYZ and 5-fluoro-PA.
Conclusions
Collectively, our observations suggested that the hepatotoxicity of PYZ might be due to its conversion of two metabolites namely PA and 5-OHPA where they produced oxidative stress–induced damage of liver. We administered PYZ and major metabolites (PA and 5-OHPA) to albino Wistar rats for the first time and investigated their toxicity potential in the liver together. All the biochemical estimation and histopathological studies revealed that both PA and 5-OHPA were more hepatotoxic than the parent PYZ.
The current study reveals that the drug PYZ itself is not responsible for the hepatotoxicity; however, two of its metabolic product PA and 5-OH-PA are the major culprit for the DILI, off which 5-OHPA is found to be the most toxic metabolic product of the drug PYZ. The metabolic product is found to induce liver injury due to oxidative stress and inflammation. Metabolic studies supported that the 5-OHPA is more toxic than the parent drug compound. The present study has implication in patient stratification, decision-making, and personalized medicine as DILI is a major complication associated with many treatment procedures in critical care and routine clinical management. NMR metabolomics enable the rapid and accurate measurements of many metabolites in a single run than by using any routine biochemical methods including detailed analysis of lipoproteins and many other metabolic parameters. It could be speculated that metabolomics might be helpful to improve the management and the decision-making process in patients with liver dysfunction or liver transplant susceptible to the drug-induced toxicity.
Based on various observations, we believe that the metabolic products of PYZ, that is, PA and 5-OHPA, might be responsible for free radical generation and followed by oxidative stress–induced liver damage and of which 5-OHPA may be the main culprit for PYZ-induced hepatotoxicity. Therefore, the final conclusion was that PYZ metabolites might be responsible for hepatotoxicity.
Supplementary Material
Supplemental Material, PYZ_Supplementary_R1_(3)_1802_final - Metabolomics approach discriminates toxicity index of pyrazinamide and its metabolic products, pyrazinoic acid and 5-hydroxy pyrazinoic acid
Supplemental Material, PYZ_Supplementary_R1_(3)_1802_final for Metabolomics approach discriminates toxicity index of pyrazinamide and its metabolic products, pyrazinoic acid and 5-hydroxy pyrazinoic acid by A Rawat, S Chaturvedi, AK Singh, A Guleria, D Dubey, AK Keshari, V Raj, A Rai, A Prakash, U Kumar, D Kumar and S Saha in Human & Experimental Toxicology
Footnotes
Author contributions
The contributions made by the authors are as follows: study concept: SS and DK; study protocol design: AR, SC, AKS, AKK, and SS; pharmacological screening: SC, VR, AR; performed NMR experiments: AR, DD, UK; NMR-based metabolomics data analysis and preparation of the figure: AR, AG, DK; manuscript preparation: AR, AP, AG, DK, SS; all the authors reviewed the manuscript. AR and SC are contributed equally.
Declaration of Conflicting Interests
The author(s) declared no potential conflicts of interest with respect to the research, authorship, and/or publication of this article.
Funding
The author(s) disclosed receipt of the following financial support for the research, authorship, and/or publication of this article: SS would like to express his thanks to the University Grants Commission (UGC), New Delhi, India, for providing UGC-MRP grant (project no. 42-680/2013(SR)) and Department of Science and Technology (DST), India (Ref. No. DST/SB/EMEQ-320/2014). DK would also like to acknowledge SERB DST, India, for providing him the research grant under EMR Scheme (registration number: EMR/2016/001756) and financial fellowship/support: AR: CSIR-SRF; DD and UK: ICMR-JRF.
Supplemental material
Supplementary material for this article is available online.
References
Supplementary Material
Please find the following supplemental material available below.
For Open Access articles published under a Creative Commons License, all supplemental material carries the same license as the article it is associated with.
For non-Open Access articles published, all supplemental material carries a non-exclusive license, and permission requests for re-use of supplemental material or any part of supplemental material shall be sent directly to the copyright owner as specified in the copyright notice associated with the article.