
Abstract
Background
One of the challenges to using some flavor chemicals in aerosol products is the lack of route of administration specific toxicology data.
Methods
Flavor chemicals (88) were divided into four different flavor mixtures based upon chemical compatibility and evaluated in 2-week dose-range-finding and subsequent 90-day nose-only rodent inhalation studies (OECD 413 and GLP compliant). Sprague-Dawley rats were exposed to vehicle control or one of three increasing concentrations of each flavor mixture.
Results
In the dose-range-range-finding studies, exposure to flavor mixture four resulted in adverse nasal histopathology in female rats at the high dose, resulting in this flavor mixture not being evaluated in a 90-day study. In the 90-day studies daily exposures to the three flavor mixtures did not induce biologically meaningful adverse effects (food consumption, body weights, respiratory physiology, serum chemistry, hematology, coagulation, urinalysis, bronchoalveolar lavage fluid analysis and terminal organ weights). All histopathology findings were observed in both vehicle control and flavor mixture exposed animals, with similar incidences and/or severities, and therefore were not considered flavor mixture related.
Conclusion
Based on the absence of adverse effects, the no-observed-adverse-effect concentration for each 90-day inhalation study was the highest dose tested, 2.5 mg/L of the aerosolized high dose of the three flavor mixtures.
Introduction
From an inhaled product development toxicology persepctive, one of the challenges to use of some flavor chemicals in aerosol products is the lack of route of administration specific data (e.g., inhalation), which has been cited by several authors for Electronic Nicotine Delivery System (ENDS) products.1–3 Typically, because flavor chemicals used in ENDS are Generally Recognized as Safe for use in food (U.S. Food Drug and Cosmetic Act, sections 201(s) and 409), there is some oral toxicology, mutagenicity and/or genotoxicity and sensitization data, but rarely inhalation data. A couple of recent articles have summarized in vitro and in vivo data on flavors used in ENDS products.2,4 There has also been some research that attempts to correlate toxicology data between oral and inhalation routes of exposure.5–9 Usually, these efforts result in application of a safety factor (also called assessment factor, correction factor, etc.) in the risk assessment process for route-to-route extrapolation (oral to inhalation). For example, Schroder et al., 9 recommended a safety factor of three compared to a safety factor of two that Schroder et al., 9 indicated was proposed by European Chemicals Agency. 10 The exception to the safety factor approach was Ford et al., 8 that found when comparing chemicals that had both oral and inhalation data, if local respiratory effects were ignored, the threshold of concern was similar between the two routes of exposure.
The limited published inhalation data using flavor chemicals, that have been used in ENDS products, can be grouped into three different testing strategies: product testing using either prototype or marketed ENDS products,11–13 single flavor ingredient studies,14–20 and mixtures of flavor chemicals studies.21,22 An example of an early ENDS prototype product being tested reported results of 90-day nose only inhalation study using prototype ENDS products with targeted dosing at 3.2, 9.6, and 32.0 mg/kg/day, with one prototype ENDS formulation containing 17.6% proprietary flavors. 11 The 90-day nose-only study was conducted in accordance with Organization for Economic Cooperation and Development (OECD) guideline 413 23 and consistent with U.S. Good Laboratory Practice requirements (21 CFR Part 58). The No Observed Effect Level for all formulations was 9.6 mg/kg/day due to body weight decreases (i.e. exceeding 10%). 11 An example of a single flavor ingredient study targeting a flavor ingredient used in ENDS products was a 28-day nose-only inhalation study using two-isopropyl-N,2,3-trimethylbutyramide (WS-23) in a mixture of propylene glycol and glycerin with the aerosol being generated from a commercial ENDS product. 19 The study was designed in accordance OECD guideline 403 and 41224,25 and found the No Observed Adverse Effect Level (NOAEL) to be at least 342.85 mg/m3, the highest dose tested. Finally, a mixture of flavor ingredients was tested21,22 utilizing a read across approach26–30 for 245 ENDS flavor chemicals by grouping them into 26 distinct chemical groups based on structural similarities and reported potential metabolic and biological effects. Flavors chemicals (chemically compatible) from each group that were predicted to show the highest toxicity were combined into a single formulation. 31 This mixture of 26 flavor chemicals with and without nicotine in a mixture of propylene glycol and glycerin at three exposure doses that were generated using a nebulizer was evaluated in a 90-day nose-only inhalation study. 21 The 90-day nose-only inhalation study used an OECD 413 compliant study design and was conducted consistent with OECD Good Laboratory Practices.23,32 Results of these exposures (using all standard OECD and novel systems toxicology endpoints) to the mixture of 26 flavor chemicals demonstrated no significant additive biological changes to those seen with a mixture of nicotine, propylene glycol, and glycerin. 21 The same flavor chemical mixture was used in a 5-week nose-only inhalation study using AJ mice. 22 A capillary aerosol generator was used to heat the formulations containing the flavor chemical mixture to 245°C–255°C for aerosol generation. Exposure to the heated mixture of flavors caused no notable lung inflammation and only minimal adaptive changes in the nose and larynx. 22 In the majority of these published ingredient studies, the flavor chemicals were tested as a mixture with the primary ENDS formulation chemicals (propylene glycol and glycerin), which addressed the concerns about reaction products between some flavor chemicals used in ENDS products and propylene glycol and glycerin.33,34
Each of the flavor chemical testing strategies has advantages/disadvantages and may reflect information needs during the different stages of product development. Testing a single or mixture of flavor chemicals in inhalation studies can provide toxicology information suitable for ENDS product formulation development, while product testing is usually performed on finished ENDS products. The advantage of finished ENDS product testing is that it uses the product intended for marketing with the potential disadvantage of elongating the time prior to marketing, which in the best case is the time required to plan, schedule, execute, and evaluate the data obtained from the inhalation study. The advantage of single ingredient testing is greater flexibility in dose range testing that represents a realistic ENDS product flavor load (percent of formulation i.e. flavor chemicals) and depending on the vehicle used, could provide a more direct evaluation of the effect of an individual ingredient. The disadvantage of single flavor ingredient testing is that it does not provide information on any complex ingredient interactions and requires more cautious interpretation when considering the acceptability for use in a multiple ENDS flavor formulation. The advantage of testing mixtures of flavor chemicals is that numerous flavor chemicals and their potential toxicological interactions (antagonistic or synergistic) can be evaluated simultaneously,21,22 however if there is an indication of toxicity, all tested flavors chemicals are implicated as there is no way to isolate the toxic response to a single or subset of tested flavor chemicals without additional studies. Additionally, because a mixture of flavor chemicals is tested, chemical compatibility and a narrower dose range for each flavor chemical can occur before the total product flavor load exceeds that normally found in ENDS products. The purpose of this inhalation work was to evaluate 88 flavor chemicals for potential use in ENDS products, which necessitated evaluation as four mixtures of flavor chemicals due to their chemical compatibility.
Materials and methods
Due to space limitations at the testing facility, this work was divided up into two separate inhalation study projects with each project evaluating two mixtures of flavor chemicals. A 2-week nose-only inhalation dose range finding study was performed for each of the four flavor chemical mixtures prior to conducting the 90-day nose only inhalation study for each of the four flavor chemical mixtures. The 2-week nose-only inhalation studies were performed to confirm that the target exposure concentration of 2.5 mg/L was appropriate for their subsequent 90-day nose-only inhalation study. The 90-day nose-only inhalation studies were conducted using the OECD guideline 413 35 study design (90-days [13-week] of exposure followed by 42-day [6-week] of recovery) and was conducted in compliance with U.S. Good Laboratory Practices (21 CFR Part 58) by a contract research organization (Charles River Laboratories, Ashland, Ashland, OH). Publication of this work is being done in accordance with the Animal Research: Reporting of In Vivo Experiments guidelines. 36
Animals
All studies used Sprague-Dawley rats (Crl:CD[SD]) and were performed at Charles River, Ashland, in facilities that were accredited by the Association for Assessment and Accreditation of Laboratory Animal Care International (AAALAC International). All animal experiments were approved by the Charles River Ashland Institutional Animal Care and Use Committee (review/approval numbers 1,324,173, 1,324,174, 1,324,192, and 1,324,193). The rats (male and nulliparous female) were bred under specific pathogen-free conditions and were obtained from a commercial supplier (Charles River Laboratories, Raleigh, NC). Animals were individually identified (subcutaneous transponders) and housed two to four animals (same sex and dosing group) per polycarbonate cage with Bed-o’ Cobs® bedding material (ScottPharma Solutions, Marlborough, MA) and enrichment items (e.g., gnawing device, treats and/or nesting material) during non-exposure periods. Certified rodent diet 5CR4 (PMI Nutrition International, LLC,) and fresh drinking water via automated watering system (reverse osmosis treated municipal tap water that was also ultraviolet irradiated) was supplied ad libitum to each cage. Animal rooms utilized a 12-hr. light/12-hr. Dark cycle and were supplied with fresh filtered conditioned laboratory air (20 °C–26°C; 30%–70% relative humidity). The animal husbandry was conducted in accordance with the Guide for the Care and Use of Laboratory Animals. 37 Animals were acclimated to laboratory conditions for a minimum 6 days for the 2-week dose-range-finding study and 7 days for the 90-day inhalation study. After acclimation to laboratory conditions, animals were subsequently acclimated over 4 days to the nose-only exposure tubes. Animals were placed in the nose-only exposure tubes for increasing amounts of time breathing laboratory air culminating in a six-hour period on day 4 of exposure tube acclimation. Animals did not have access to food or water during inhalation exposures. Animals were assigned to groups using a stratified randomization scheme designed to achieve similar group mean body weights (±20% of mean/sex) with males and females randomized separately. Animals were approximately 7 weeks of age at the beginning of 2-week dose-range-finding studies and 90-day inhalation studies.
Test article
Four flavor mixture formulations listing each neat flavor ingredient.

aSelected as the chemical marker for 6-week shelf-life study.
Two-week dose-range-finding studies
Inhalation study design for 2-week dose range finding and 90-day studies.
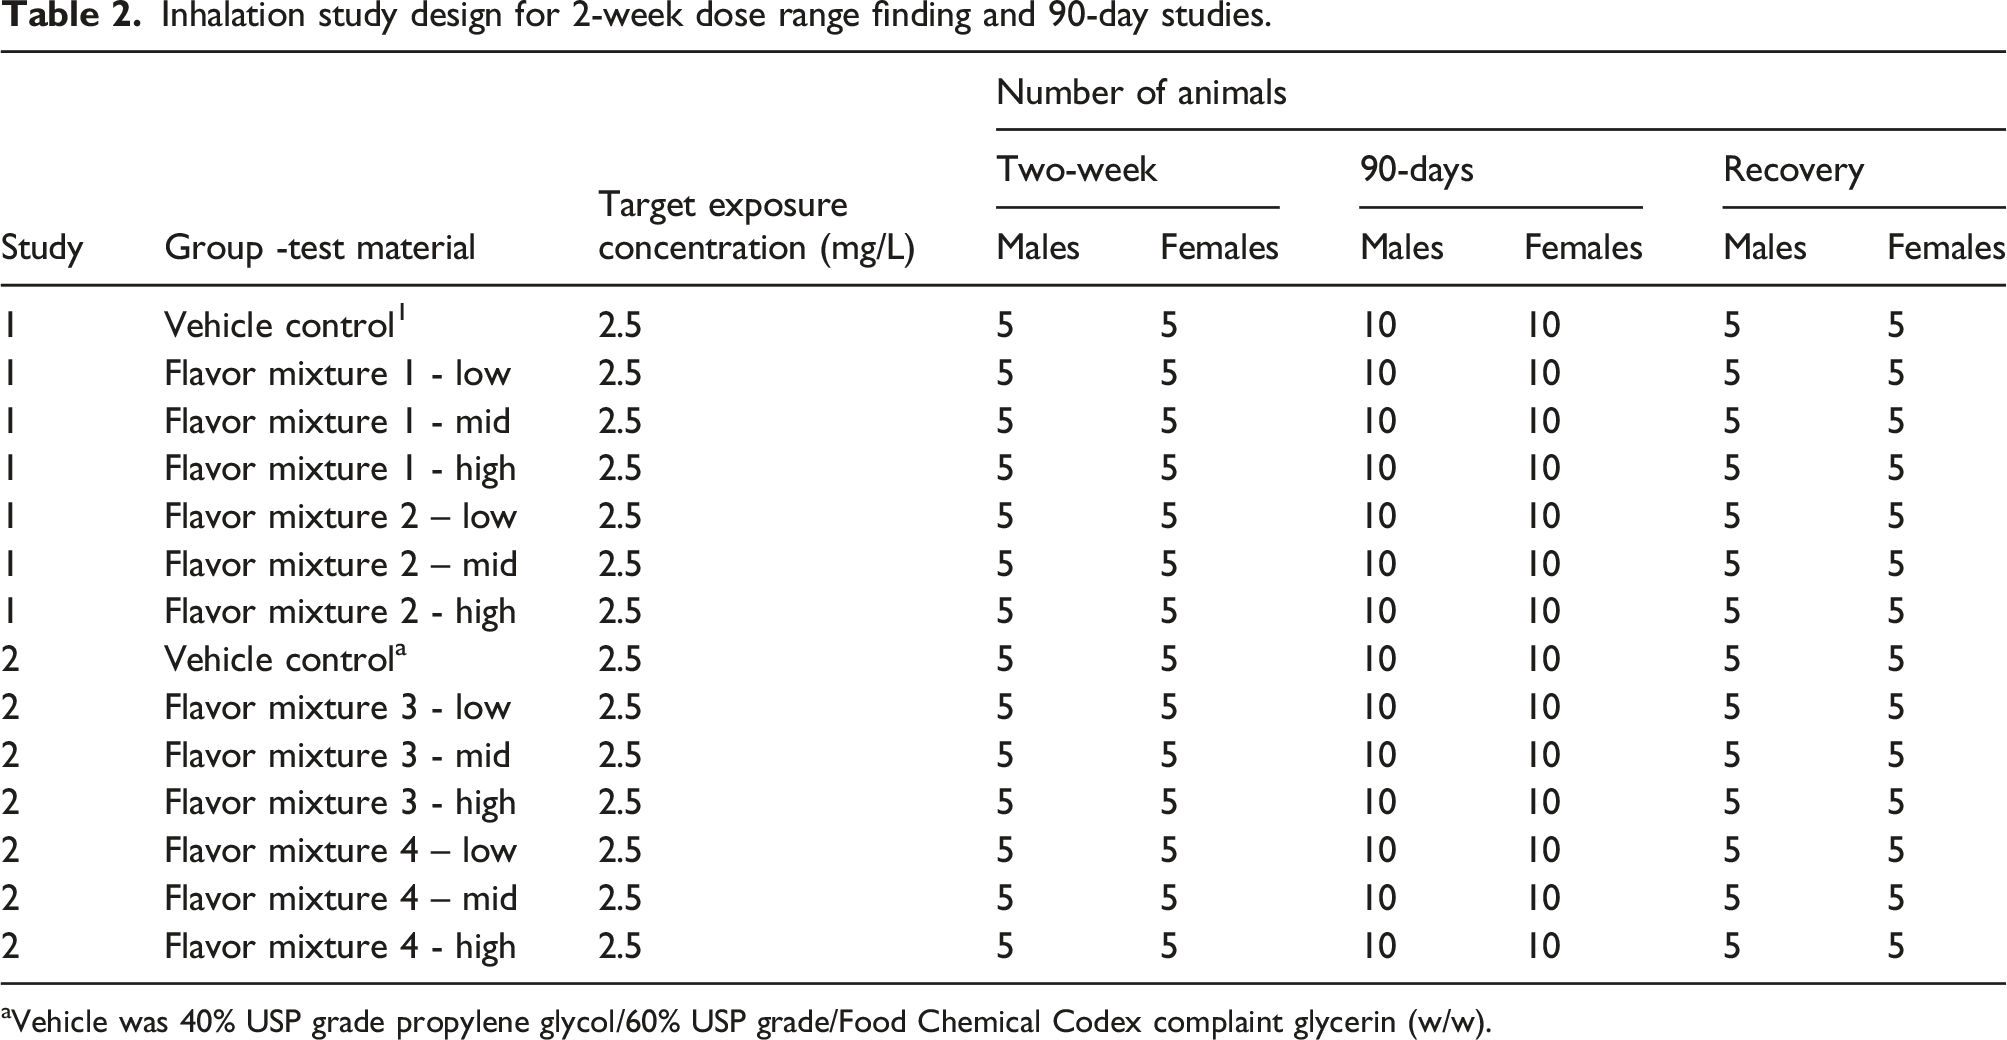
aVehicle was 40% USP grade propylene glycol/60% USP grade/Food Chemical Codex complaint glycerin (w/w).

Schematic of the aerosol generation and exposure system.
90-Day inhalation studies
The same study design was used for both 90-day inhalation studies (Table 2). Animals in both 90-day inhalation studies were exposed 6hr/d, 5 days/week for 13 weeks. To assess reversibility of any potential changes (e.g., hematology, clinical chemistry, histopathology, etc.), a 43-day post-inhalation period (recovery) was used for sub-groups of rats (Table 2). To accommodate necropsy capacity limitations for flavor mixtures 1 and 2, exposure initiation was staggered so that the necropsy after 90 days of exposure occurred on days 92, and 93 while the recovery necropsy occurred on day 134 of the study. The same nose-only exposure towers, aerosol generation and monitoring of the exposure atmospheres that was conducted for the 2-week dose range finding studies was also performed in the 90-day inhalation studies. However, due to the number of animals for flavor mixtures one and two in the first 90-day inhalation study separate exposure towers were used for males and females. In addition to the endpoints evaluated in the 2-week studies, respiratory physiology was measured near the end of the exposure period, urine was collected for analysis immediately prior to necropsy and histopathology evaluation was performed on additional organs/tissues (Supplemental Table 1).
Biological endpoints
Twice daily in-life observations (before and after exposure with animals in their cages) were performed on exposure days and once per day on non-exposure days in the dose range finding and 90-day inhalation studies. Detailed clinical observations were conducted weekly for all exposed animals. Body weights (non-fasted) and food consumption were measured every other day in the 2-week dose-range-finding studies through termination and weekly for each animal upon arrival through termination in the 90-day studies. In the 90-day inhalation studies, ophthalmic examinations were performed by a board-certified veterinary ophthalmologist prior to exposure, during week 4 and 13 of exposure, and near the end of the recovery period using an indirect ophthalmoscope and slit lamp biomicroscope. Prior to ophthalmic examination animals were treated with tropicamide.
Confirmation of exposure was performed by measuring the concentration of propylene glycol in rat plasma using a validated analytical assay for all exposure groups, on day 5 in the 2-week dose-range-finding studies and on days 3 and last day of exposure in the 90-day studies.20,43 Blood samples were obtained within 10 min post exposure in both the 2-week range finding studies and 90-day inhalation studies via jugular vein. In the 90-day inhalation studies animals from the recovery group animals (5 animals/sex/group) were used. An anticoagulant tube (K2EDTA) was used to collect the plasma, which was gently mixed and centrifuged within 2-hr of collection. The resultant plasma was transferred to a polypropylene tube and stored at −70°C until analysis.
Respiratory physiology measurements (tidal volume and frequency) for vehicle control and high dose flavor mixture groups were not measured in the 2-week dose range finding studies, but were measured once during the 90-day inhalation studies (week 12 for flavor mixtures one and two and week 11 for flavor mixture 3) using a nose-only single-chamber restraint plethysmograph (Buxco Electronics, Inc., Wilmington, NC). Five animals/sex/group were assessed. Baseline measurements started 10 min prior to exposure and continued for the first 30 min of exposure with only measurements collected during the last 15 min of exposure used for statistical analysis. Data acquisition logging rate was set to 5 s and respiratory data were sampled at 500 Hertz. Any respiratory frequency data exceeding 350 breaths/minute or tidal volume data greater than 5.0 mL was considered physiologically unlikely and excluded from analysis. Minute volume was calculated as the product of the measured tidal volume and respiratory frequency.
Terminal endpoints
In the 90-day studies, animals were fasted for at least 8 h prior to blood collection while housed in metabolism cages for urine collection. Blood was collected via the jugular vein and placed into tubes with potassium K2EDTA for hematology, and tubes with no anticoagulant for clinical chemistry. Blood was collected from anesthetized animals (using isoflurane inhalation) into tubes with sodium citrate for coagulation parameters at the time of euthanasia via the vena cava. The euthanasia was completed by exsanguinating the anesthetized animals.
Urinary volume, pH, and specific gravity as well as glucose, ketone and protein concentration were measured. The hematology endpoints included red blood cell indices (mean corpuscular hemoglobin concentration, mean corpuscular volume, red blood cell and reticulocyte count and hematocrit), platelet count, mean platelet volume, white blood cell count, differential count, as well as coagulation parameters (function included prothrombin time, activated partial thromboplastin and fibrinogen). Clinical chemistry endpoints included: Total Protein, Albumin, Globulin, Albumin/Globulin ratio, Alkaline phosphatase, Alanine aminotransferase, Aspartate aminotransferase, Gamma glutamyltransferase, Cholesterol, Creatine kinase, Creatine, Glucose, Triglycerides, Total bilirubin Direct and Indirect bilirubin, Sodium, Calcium, Potassium, Chloride, Phosphorus and Urea Nitrogen.
In both the 2-week dose-range-finding and 90-day inhalation studies, three bronchoalveolar lavages (BALF) were performed on the right lung of all animals after lung weight was recorded and before the lungs were inflated with fixative. The cell pellets from the three lavages per animal were combined and resuspended for counting. Total cell counts were obtained using a hemocytometer. Total protein concentration, lactate dehydrogenase, and alkaline phosphatase enzyme activities from the supernatant of the first lavage were determined using automated methods. For differential counts (cytology), at least 200 cells per slide (cytospin preparation) were identified (if possible) as macrophages, neutrophils, lymphocytes, eosinophils, basophils, or others.
Macroscopic evaluation for gross lesions was conducted on all animals at all necropsies (Supplemental Table 1). Organ weights (absolute) were obtained for all organs at each necropsy and paired organs were weighed together (Supplemental Table 1). In the dose-ranging-finding study organ weight to terminal (fasted) body weight ratio was calculated and in the 90-day studies organ weight to terminal (fasted) body weight and organ weight to brain weight ratios were calculated. In the dose-ranging-finding studies (after 10 days of exposure), histopathological evaluation was performed on respiratory tract tissues (including six different sections of the nose from oropharynx to nasopharynx, larynx, trachea, main carina-intersection of trachea and two major bronchi, extrapulmonary bronchus, and lung) and selected other organs from vehicle control and all flavor mixture groups (Supplemental Table 1). After 90 days of exposure, the same respiratory tract tissues, and a more complete list of organs (Supplemental Table 1) were evaluated. After recovery, histopathology was only performed on tissues of interest in the high dose flavor mixture groups after 90 days of exposure. All histopathology was performed by a board-certified veterinary pathologist using a 5-level severity grade scale of minimal, mild, moderate, marked and severe who also identified and examined the tissues of interest at recovery. Animals were fasted the day prior to necropsy.
Statistical analysis
Statistical comparisons between flavor mixture groups and the respective vehicle control group were performed to indicate where potentially toxicologically significant differences might be present. In addition to being statistically significantly different, expert interpretation which included analysis of factors such as dose-response and coherence among findings were required for a result to be considered toxicologically significant. The 5% level (p < .05) for statistical significance was used throughout the evaluations. SAS®, ver. 9.4 (Cary N.C.) was used for statistical analysis.
In general, means, standard deviations (or % coefficient of variation or standard error, when deemed appropriate), ratio, percentages, numbers, and/or incidences were reported depending on the dataset. The pairwise comparisons for statistical analysis in the 2-week dose range finding studies compared each flavor mixture group to the respective vehicle control (e.g., Low dose flavor mixture 1 vs Study 1 Vehicle Control; Mid dose flavor mixture 1 vs Study 1 Vehicle Control; etc.). The same comparisons were performed in the 90-day studies for the flavor mixtures studied. Any group with less than three observations were excluded from analysis. Levene’s test was used to assess the homogeneity of group variances. The groups were compared using an overall one-way ANOVA F-test if Levene’s test was not significant or the Kruskal-Wallis test if it was significant. If the overall F-test or Kruskal-Wallis test was significant, then pairwise comparisons using two sided tests were conducted using Dunnett’s or Dunn’s test, respectively.
Descriptive statistics for each respiratory physiology data time period were tabulated and included: arithmetic mean (Mean), number of subjects (N), least squares mean (LS Mean), and standard error of the LS Mean (LSM s.e.). Analysis of covariance was used to evaluate the effect of exposure to flavor ingredient mixture during each analysis segment using exposure group and baseline data (covariate) (average of 10 min prior to exposure) as factors in the model. If a significant effect to flavor mixture exposure was found, step-down adjusted t-tests were used to compare exposure to each flavor mixture to the respective vehicle control treatment using the overall segment means. Step-down simulated adjustment was used to adjust t-tests for pair-wise comparisons, which were evaluated at the 0.05 level of significance, using two-tailed tests.
Results
Two-week dose-range-finding studies
In the first 2-week dose-range-finding study all exposure concentration and particle size distribution parameters were within acceptable ranges (Supplemental Table 2). Exposure to the flavor mixtures one and two was confirmed with analytical measurements of propylene glycol in rat plasma (Supplemental Table 3). All animals except for one male in the flavor mixture 1, low dose group survived to the scheduled necropsy. The cause of death for this animal could not be determined, however due to the lack of effect in other animals, including the mid and high dose groups of flavor mixture 1, a test article-related effect was considered unlikely. Notable microscopic changes in this animal consisted of mild perivascular mixed infiltrates in the lungs and minimal alveolar proteinosis. There were no other microscopic findings in this animal. No statistically significant differences in mean body weights were found (Figure 2; Supplemental Tables 4 and 5). Although a few differences (statistically significant and non-statistically significant) were noted in body weight gain, food consumption, hematology, clinical chemistry, BALF, absolute organ weights or organ weights normalized to body mass, these were sporadic in nature, consistent with biological variation with no consistency across doses, sexes or time points (Supplemental Tables 6-19). There was also no flavor mixture one or two macroscopic (Supplemental Tables 20) or histopathology findings (Figure 3; Supplemental Tables 38). Based upon the lack of findings in the 2-week dose range finding study, the flavor mixture exposure level of 2.5 mg/L was used in the subsequent (first) 90-day inhalation study. Two-week dose range finding studies mean bodyweight as function of exposure day for males (top panels) and females (bottom panels) with Study one in the left column and Study two in the right column. Representative images of the nasal turbinates (section IV) from female mice exposed to vehicle (a) and high dose groups of Flavor Mixtures 1 (b), 2 (c), 3 (d), and 4 (e) from both 2-week dose range finding studies. Rats exposed to the high dose of Flavor Mixture four showed notable, diffuse thinning of the olfactory epithelium throughout the nasal turbinates (arrows) at low magnification. Vehicle exposed rat olfactory epithelium (f) shows the orderly arrangement of nuclei of the olfactory sensory neurons with thin cilia projecting into the nasal lumen. Flavor Mixture four high dose group exposed rat olfactory epithelium (g) shows notable degeneration is present, characterized by loss of sensory neurons and sustentacular cells, cellular apoptosis (filled arrowheads), presence of inflammatory cells (open arrowhead), and loss of cilia along with evidence of regeneration (disorganized and poorly differentiated cells with large nuclei). Hematoxylin and Eosin (H&E) staining. Magnification is 30x and scale bar is 700 µm for A, B, C, D, E. Magnification is 400x and scale bar is 60 µm for F and G.

In the second 2-week dose-range-finding study (flavor mixtures 3 and 4) all animals survived to the scheduled necropsy and all exposure concentration and particle size distribution parameters were within acceptable ranges (Supplemental Table 2). Exposure to flavor mixtures three and four was confirmed with analytical measurements of propylene glycol in rat plasma (Supplemental Table 3). There were also a few differences (statistically significant and non-statistically significant) noted in clinical observations, hematology, clinical chemistry, BALF endpoints, absolute organ weights, organ weights relative to body weight or macroscopic findings, these were sporadic in nature, consistent with biological variation with no consistency across doses, sexes, or time points (Supplemental Tables 21-37). A statistically significantly lower body weight was measured on day 8 for female rats in flavor mixture 4 (Supplemental Table 22). Lower (not statistically significant) mean body weight gains and food consumption (Supplemental Tables 23-26) resulting in a non-statistically significant subsequent lower mean body weight on day 12 was observed for female rats in the flavor mixture four high dose group (Figure 2; Supplemental Table 22). No flavor mixture three related effects on body weight gains, food consumption (Supplemental Tables 23 and 25) or body weight on day 12 was observed (Figure 2: Supplemental Table 23). No adverse histopathology results were noted for flavor mixture three exposed animals (Figure 3; Supplemental Table 39), however olfactory epithelial degeneration/regeneration was noted in nasal levels III, IV, V, and VI for female rats in the flavor mixture four high dose group (Figure 3; Supplemental Table 39). Due to the adverse nasal histopathology findings flavor mixture four was not evaluated in a subsequent 90-day inhalation study. Based upon the lack of findings in the 2-week dose-range-finding study for flavor mixture 3, the same flavor mixture three target exposure level of 2.5 mg/L was used in the subsequent (second) 90-day inhalation study.
90-Day inhalation studies – exposure characterization
Characterization of 90-day inhalation exposures (mean ± SD).

Exp. = Exposure; Con. = concentration; SD = standard deviation.
aMeasurements made over 66 days.
bN = 81.
cN = 79.
dN = 412.
eN = 403.
fN = 77.
gN = 76.
Rat Plasma Propylene Glycol Concentrations (μg/ml) on Days 3and 91 of Exposures. All values represent the mean of five replicates unless otherwise noted.

90-Day inhalation studies - mortality/morbidity/in-life observations
In the first 90-day inhalation study using flavor mixtures 1 and 2, there were two animals that did not survive to the scheduled necropsy. A male in the flavor mixture 2, high dose was found dead prior to exposure on day 87. There were no clinical observations, effects on body weight, or macroscopic or microscopic findings and the cause of death was undetermined. Given the lack of mortality in other treatment groups, this finding was considered unrelated to flavor mixture exposure. The second unscheduled death occurred in a female rat in the flavor mixture 1, high dose group that was euthanized in extremis during the recovery period on Day 104 following clinical observations of decreased activity, partially closed eyes, hunched posture, labored breathing, and erected fur. In addition, this animal had lost 11.9% of body weight between days 99–104. The cause of death was attributed to malignant lymphoma that was observed in multiple organs and tissues throughout the body. Spontaneous lymphohematopoietic neoplasia, including malignant lymphoma, has been reported in young Sprague Dawley rats including female Sprague-Dawley rats 11-15 weeks old.55,56 No other indications of lymphoma were found in any of the other female rats in flavor mixture one regardless of dose group, therefore in this case, malignant lymphoma was considered an incidental finding and not related to flavor mixture exposure. In the second 90-day inhalation study using flavor mixture 3, all animals survived until the scheduled necropsies. There were no flavor mixture related clinical observations or ophthalmic lesions indicative of toxicity in either 90-day inhalation study.
Mean group body weights (Figure 4; Supplemental Tables 40-42) were unaffected by exposure to any of the flavor mixtures at any dose level. Although there were sporadic statistically significantly differences in body weight gains, they did not correlate with food consumption data as there were no statistically significant differences in food consumption between flavor mixture exposure groups and respective vehicle control groups (Supplemental Tables 43-48). Because there was no consistent pattern between successive body weight gain measurements nor between sexes within the same measurement and in all but one case (Mix 3-M and Mix3-H group male rats) no dose response (Supplemental Tables 43-45), the sporadic statistically significant differences in body weight gain were not considered flavor mixture exposure related. 90-day studies mean bodyweights for males (top panels) and females (bottom panels) with Study in the left column and Study two in the right column. Recovery animals were not fasted after 90 days of exposure as were the rest of the animals that were fasted prior to necropsy.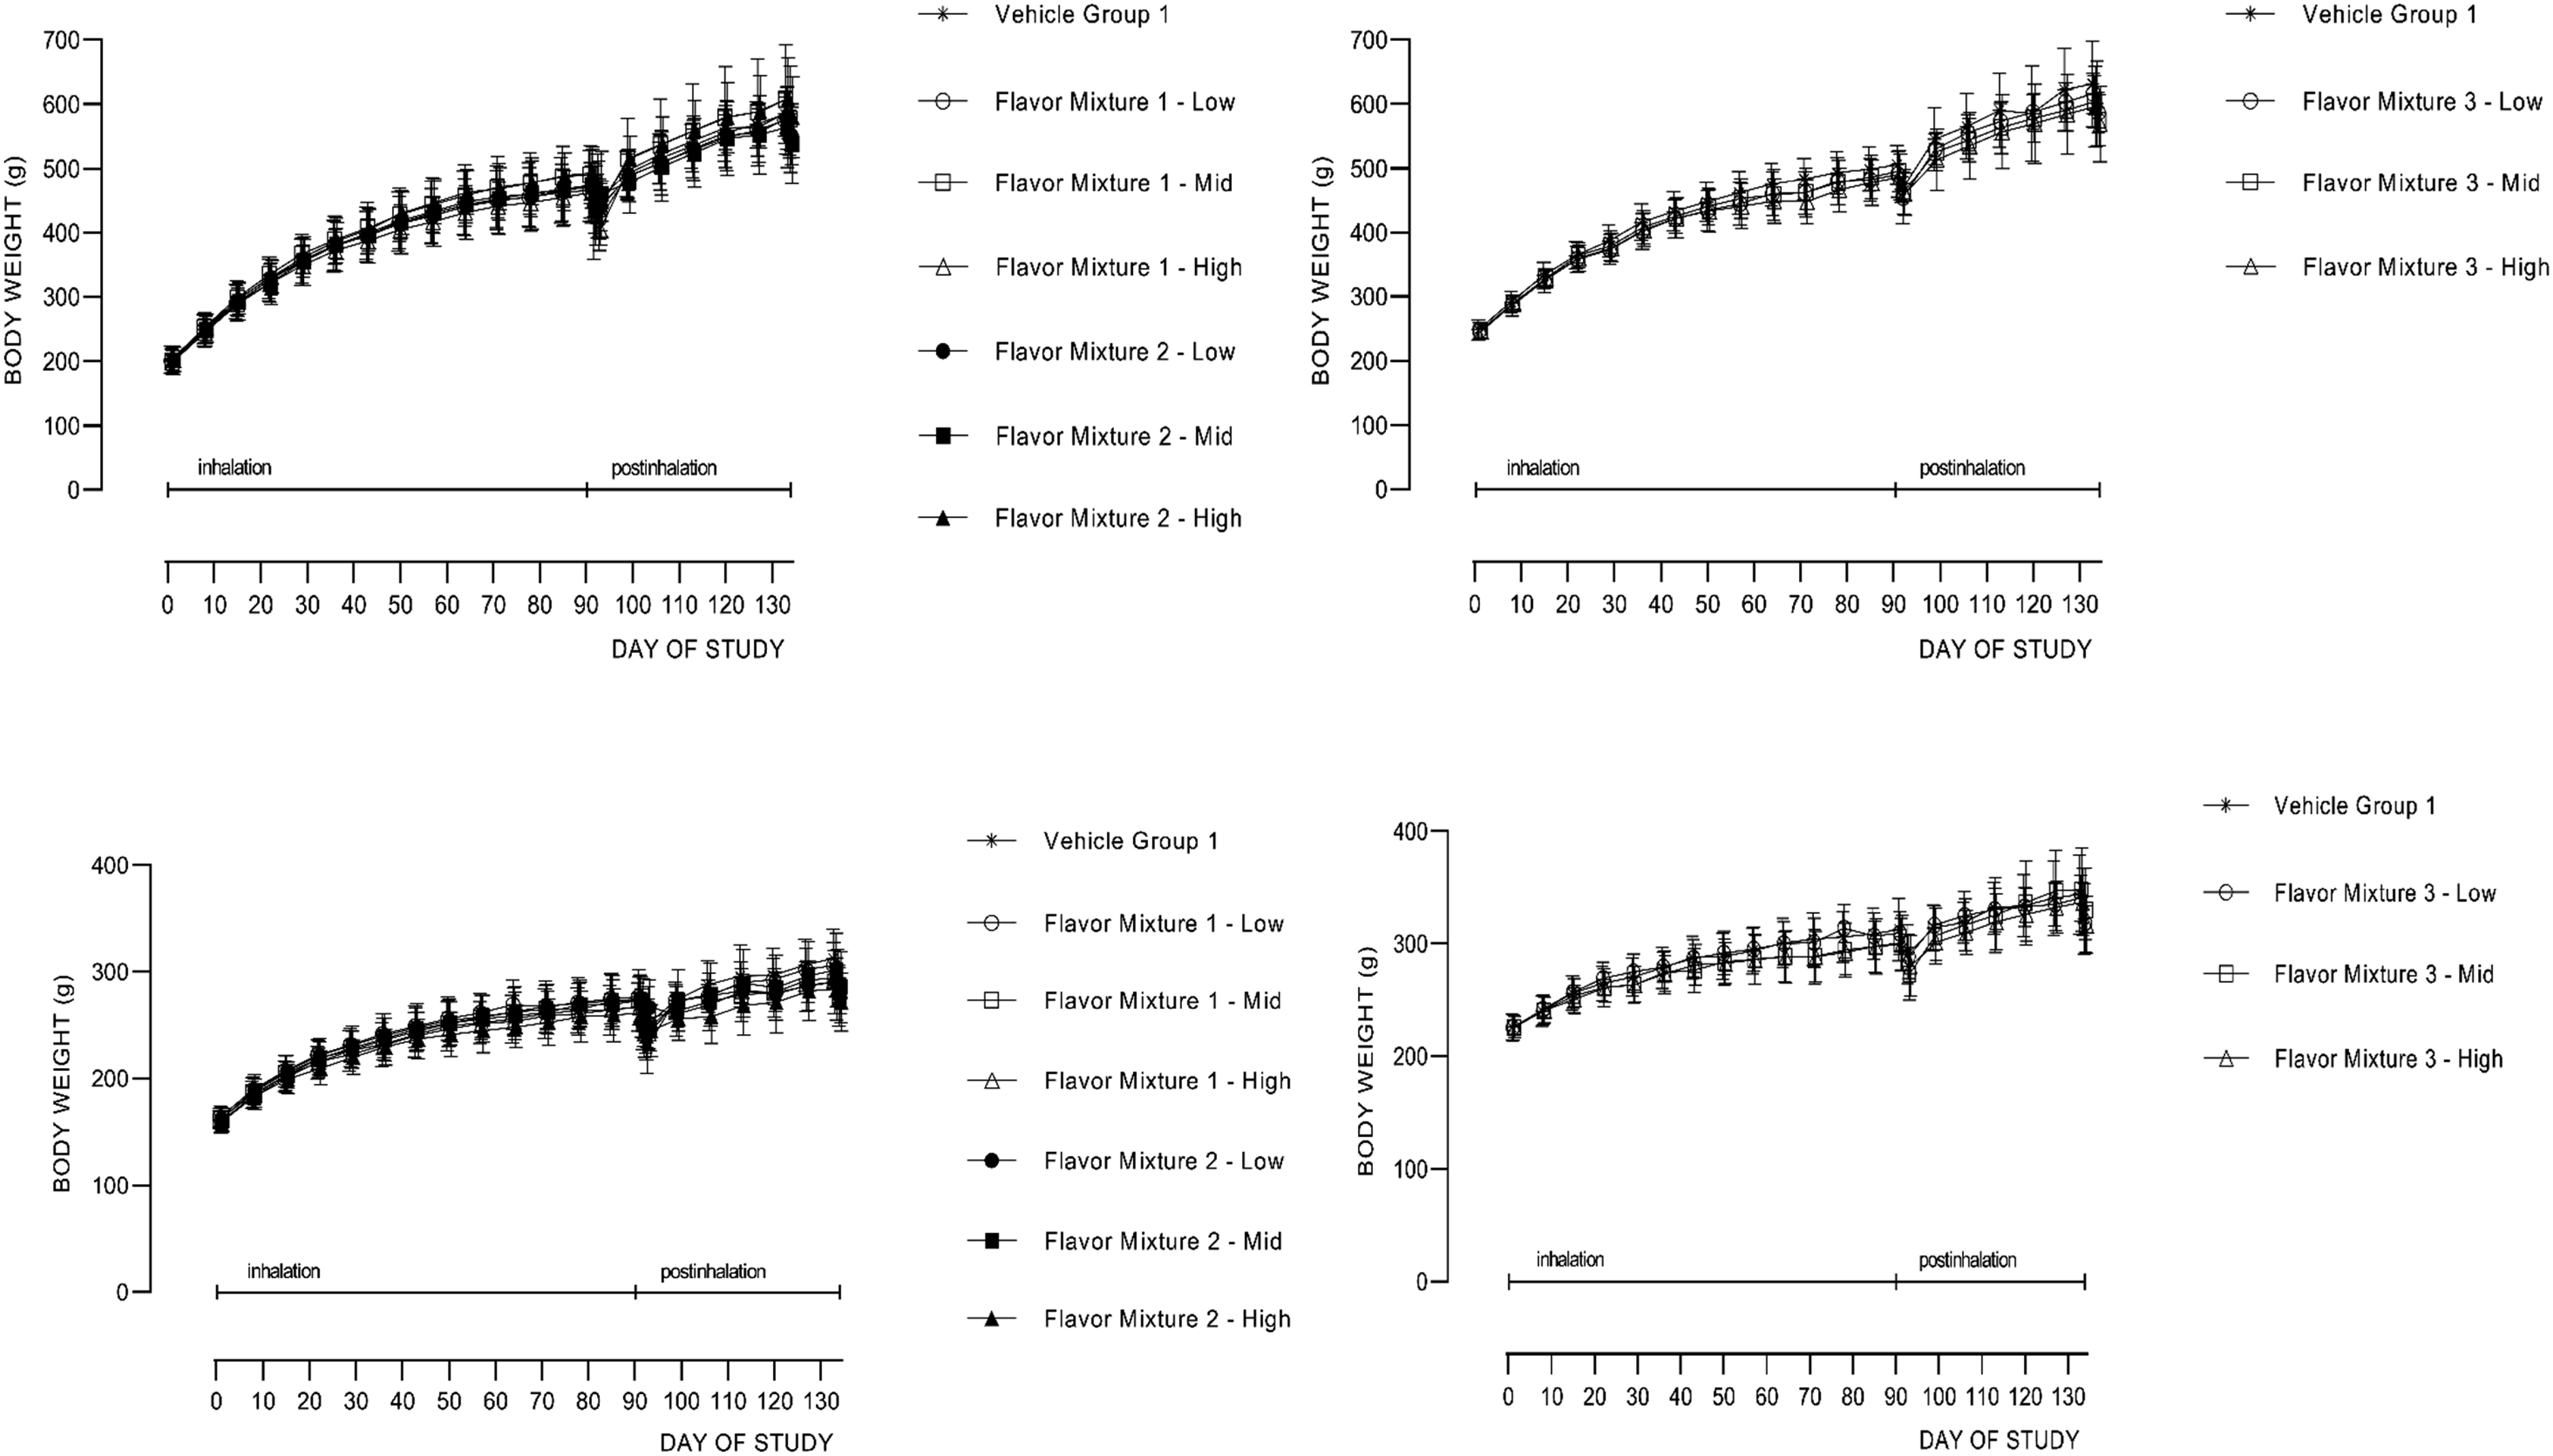
The only statistically significant difference in respiratory physiology was a higher respiratory frequency noted in the Mix1-H group females at 16-30 min postdosing (Supplemental Table 49). This change was not considered to be flavor mixture related because it was of minimal difference compared to the baseline respiratory frequency.
90-Day inhalation studies – terminal endpoints
Although there were several differences (statistically significant and non-statistically significant) in hematology, coagulation, clinical chemistry, and urinalysis endpoints these were sporadic in nature, consistent with biological variation with no consistency across doses, sexes, or time points (Hematology – Supplemental Tables 50-57; Coagulation – Supplemental Tables 58-65; Clinical chemistry – Supplemental Tables 66-73; Urinalysis – Supplemental Tables 74-81). For example, there were no statistically significant changes in hematology endpoints during the 90-day inhalation study for any flavor mixture exposure group compared to their respective vehicle control group (Supplemental Tables 50-53), but during the recovery phase of the study there were statistically significant differences between flavor mixture exposure groups and the respective vehicle control groups (Supplemental Tables 54-57). For flavor mixture 1 at recovery in female rats at the low and mid dose groups, monocytes levels were statistically significantly lower than the level in vehicle control, however the level of monocytes were not different than vehicle control for the high dose group and no differences were seen at recovery for male rats. For coagulation endpoints the only three statistically significant differences occurred in flavor mixture three exposure groups compared to vehicle control values. After 13 weeks of exposure to flavor mixture 3, male rats in the mid and high dose groups had statistically significantly less fibrinogen (mg/dL), however this decrease was not dose responsive and was not seen in female rats (Supplemental Table 59). At the end of the recovery, female rats exposed to the low dose of flavor mixture 3, had a statistically significantly higher prothrombin time compared to vehicle control, however there was no dose response and was not present in male rats (Supplemental Table 65). For clinical chemistry endpoints, the only two statistically significant differences occurred in female rats exposed to flavor mixture 3. After 90 days of exposure, female rats in the low dose group had statistically significantly less aspartate aminotransferase and female rats in the high dose group had statistically significantly less chloride, however there was not a dose response, and a similar pattern was not present in male rats (Supplemental Tables 66-69). For urinalysis there were three statistically significant differences from vehicle control in male rats exposed to flavor mixture one and one statistically significant difference from vehicle control for female rats exposed to flavor mixture 2. The male rats exposed to flavor mixture one in the mid and high dose groups had statistically significantly higher urinary pH and the mid dose group also had a higher urinary volume compared to vehicle control. The female rats exposed to flavor mixture 2 at the mid dose group had a statistically significant lower urinary pH than the vehicle control. None of the statistically significant differences in urinary endpoints exhibited a dose response or were evident in the opposite sex.
There were no statistically significant changes in BALF cytology, total protein, or lactate dehydrogenase, for any flavor mixture exposure group after 90 days of exposure when compared to vehicle control values (Supplemental Tables 82-87). The only statistically significant difference after 90 days of exposure in BALF endpoints was a statistically significant increase in bronchoalveolar alkaline phosphatase level in female rats exposed to the high dose of flavor mixture three compared to vehicle control (Supplemental Table 84). However, at recovery there were two statistically significant differences that were found in flavor mixture 3 exposed groups: more lymphocytes/µL were found in male rats exposed at the low dose and a lower percent neutrophiles in female rats exposed at the high dose (Supplemental Table 87). None of the statistically significant differences in BALF endpoints exhibited a dose response or were evident in both sexes.
The only statistically significant differences in absolute organ weights after 90 days of exposure occurred in male rats exposure to flavor mixture three at the low dose (Supplemental Tables 88-91). Statistically significantly lower organ weights compared to vehicle control organ weights were found for the epididymis, pituitary gland, kidney, and testis (Supplemental Table 90). When compared on a percent terminal body weight and brain weight basis only the pituitary gland remained statistically significantly lower compared to the vehicle control (Supplemental Tables 92-99). There were no microscopic correlates and there was no dose response so these differences were considered incidental and not related to flavor mixture three exposure. After 90 days of exposure when compared on a terminal body weight or brain weight basis, there were other isolated organ weight differences in flavor mixture groups compared to their respective vehicle control groups, however there was no dose response or other patterns, or correlating data to suggest these values were toxicologically relevant. Interesting, although not observed after 90 days of exposure, after recovery, there were statistically significantly higher mean thyroid/parathyroid weights observed in male rats for the flavor mixture one low, mid and high dose groups and flavor mixture two high dose group (absolute organ weights and organ weight relative to terminal body weight and brain weight) and in the flavor mixture 2 mid dose group (organ weight relative to brain weight) compared to the mean thyroid/parathyroid weight from the vehicle control group (Supplemental Table 100-111). However, most individual rat values fell within the contract research organization’s historical control range, with the exception of one flavor mixture two high dose male rat. As noted above, significant differences in thyroid/parathyroid weights (absolute, percent body weight, or per brain weight) were not observed in animals after 90 days of exposure and there was no significant difference in thyroid/parathyroid weights in the recovery group females relative to the vehicle controls. Further, there were no microscopic correlates. Therefore, higher mean thyroid/parathyroid weights were attributed to individual animal variation and not flavor mixture exposure. At recovery, there were other isolated organ weight values that were statistically different from their respective vehicle controls. There were, however, no patterns, trends, or correlating data to suggest these values were toxicologically relevant. Thus, these other organ weight differences observed were considered incidental and unrelated to flavor mixture exposure. There were no notable findings in the macroscopic examination from any of the flavor mixture exposed groups when compared to their respective vehicle control groups after 90 days of exposure or at recovery (Supplemental Tables 112-116).
Histopathology results after 90 days of exposure showed goblet cell hyperplasia and metaplasia, transitional epithelial cell hyperplasia, and degeneration/regeneration of the olfactory epithelium in the nasal sections of both vehicle control and all flavor mixture exposed animals, with a similar incidence and/or severity in all groups and therefore, were not considered flavor mixture exposure related (Figures 5 and 6; Supplemental Tables 117-118). Other histopathology observations after 90 days of flavor mixture exposure were considered incidental, of the nature commonly observed in this strain and age of rats, and/or were of similar incidence and severity in vehicle control and flavor mixture exposed groups and, therefore, were considered unrelated to flavor mixture exposure (Supplemental Tables 119-120). At the recovery necropsy, the microscopic findings observed were considered incidental, of the nature commonly observed in this strain and age of rats, and/or were of similar incidence in vehicle control and flavor mixture exposed groups and, therefore, were considered unrelated to flavor mixture exposure (Supplemental Tables 121-122). Representative images of the nasal turbinates (section IV) and lungs from a single control female rat (a and b), high dose group Mixture one exposed female rat (c and d), and high dose group Mixture two exposed female rat (e and f). The olfactory epithelium of the nasal turbinates were microscopically similar between the control female (a), the high dose group Mixture 1 (c) and 2 (e) exposed female rats with no evidence of degeneration or regeneration. Similarly, the lungs from the control female rats (b) and the high dose group Flavor Mixtures 1 (d) and 2 (f) exposed female rats were similar and unremarkable. Hematoxylin and Eosin (H&E) staining. Magnification is 30x and scale bar 700 µm is for A, C, E. Magnification is 100x and scale bar is 300 µm for B, D, F. Representative images of the rat nasal turbinates (section IV) and lungs from a single control female (a and Bb) and high dose group of flavor mixture three exposed female rat (c and d). The olfactory epithelium of the nasal turbinates were microscopically similar between the control female (a) and high dose group of flavor mixture three exposed female rat (c) with no evidence of degeneration or regeneration. Similarly, the lungs from the control female (b) and high dose group of flavor mixture three exposed female rat (d) were similar and unremarkable. Hematoxylin and Eosin (H&E) staining. Magnification is 30x and scale bar is 700 µm for A and C. Magnification is 100x and scale bar is 300 µm for B and D.

Discussion
In the 2-week dose range finding studies, despite having one of the lower total flavor loads, exposure to flavor mixture four at 2.5 mg/L demonstrated significant toxicity that resulted in flavor mixture 4 not being studied in the subsequent 90-day inhalation studies. Consistent with a primary disadvantage of testing mixtures of flavor chemicals, we don’t have any insight into which flavor chemical, combination of flavor chemicals or their potential reaction/degradation product(s) might be responsible for the observed results for flavor mixture 4. In vitro cytotoxicity studies in rat or human nasal epithelium with exposure to each flavor chemical in mixture four might help identify an individual chemical or chemicals of concern.57,58 No individual flavor ingredient inhalation studies could be found for any of the flavor chemicals in flavor mixture 4. None of the flavor chemicals in flavor mixture 4 were evaluated or tested in the previously described read across approach for 245 flavor chemicals for use in ENDS products.21,22,26–31 A few flavor chemicals in flavor mixtures 1, 2, and 3 were part of the previously described read across approach for 245 flavor chemicals (beta-damascenone, beta ionone, ethyl acetate, hexanal, l-menthyl acetate, Nootkatone, and Whiskey lactone) for use in ENDS products.21,22,26–31
In the 90-day inhalation studies, the mean measured exposure temperature and humidity being within respective target ranges combined with mean measured exposure concentrations being within 0.1 mg/L (4%) of the target exposure concentration and the similarity in the particle size distribution among the flavor mixture exposure groups, enables comparison of biological responses between these flavor mixture exposure groups and their respective vehicle control group. The consistency in the amount of water measured in the aerosol was not surprising due to use of the humectants propylene glycol and glycerin in the vehicle control and flavor formulation groups. The humidified dilution air used was the likely water source. The chemical measurements of propylene glycol and glycerin at the nose ports are also generally consistent with their proportion in the flavor mixture formulations considering the rapid water absorption and rapid propylene glycol evaporation from aerosols recently reported. 59 There was no statistically significant difference in measured rat plasma propylene glycol concentrations between groups within time points. Although sporadic statistically significant differences from vehicle control were noted for some endpoints in the flavor mixture exposed groups (e.g., less fibrinogen in mid and high Flavor mixture three dose group female rats, tidal volume; etc.), no dose-response or consistency in response between sexes was noted. No Flavor Mixture exposure effects were observed on body weight, food consumption, respiratory physiology, hematology, coagulation, clinical chemistry, urinalysis, bronchoalveolar lavage fluid parameters, organ weights, ophthalmic endpoints, macroscopic observations, or histopathology findings. These two 90-day subchronic nose only inhalation studies demonstrated that daily exposures to the three flavor mixtures up to 2.5 mg/L TPM for 6 h/day did not induce biologically meaningful adverse effects in rats. Results of our 90-day inhalation studies using three different mixtures of flavor chemicals are consistent with those using the read across approach for 245 Flavor Ingredients used in ENDS products in that the mixture of flavor chemicals tested did not result in additional toxicity compared to the vehicle control.21,22
In summary, administration of the three flavor mixtures by nose-only inhalation to Crl:CD(SD) rats at a target concentration of 2.5 mg/L of aerosolized formulations for 6 h per day for 5 days per week for 13 weeks was well tolerated. Based on the absence of adverse effects, the NOAEC was considered to be the highest dose tested, 2.5 mg/L of aerosolized high dose for each flavor mixture.
Supplemental Material
Supplemental Material - Evaluation of mixtures of flavor chemicals in a 90-day nose-only exposures in sprague-dawley rats
Supplemental Material for Evaluation of mixtures of flavor chemicals in a 90-day nose-only exposures in sprague-dawley rats by Michael J Oldham, Rahat Wadhwa Desai, James Randazzo, Brent E Walling, Guy Lalonde, and Roxana Weil in Human & Experimental Toxicology
Footnotes
Acknowledgments
The authors would like to thank the staff at Charles River Laboratories for a well-conducted study and Maleeha Agha for assistance with data presentation.
Author contributions
M.J.O. and R.W. conceived the study, R.W. obtained funding for the study, M.J.O., R.W.D., J.R., and G.L. designed the study, R.W.D. monitored the study, J.R. was the study director, B.E.W. was the veterinary pathologist for the study and who provided the histopathology images, M.J.O. wrote the first draft and all authors reviewed and edited the manuscript and approved the final version of the manuscript.
Declaration of conflicting interests
The author(s) declared the following potential conflicts of interest with respect to the research, authorship, and/or publication of this article: All authors are employees of Juul Labs, Inc. or the contract research organization that was compensated for performing the work.
Funding
The author(s) disclosed receipt of the following financial support for the research, authorship, and/or publication of this article: The work was funded by Juul Labs, Inc.
Data Availability Statement
Data sets are provided in the supplemental material.
Supplemental Material
Supplemental material for this article is available online.
References
Supplementary Material
Please find the following supplemental material available below.
For Open Access articles published under a Creative Commons License, all supplemental material carries the same license as the article it is associated with.
For non-Open Access articles published, all supplemental material carries a non-exclusive license, and permission requests for re-use of supplemental material or any part of supplemental material shall be sent directly to the copyright owner as specified in the copyright notice associated with the article.