
Abstract
Background
Fresh Menthol 3% Nicotine (FM3) is a novel JUUL e-liquid formulation. Its potential toxicity and that of the corresponding base formulation relative to a filtered air (FA) control was studied in a subchronic inhalation study conducted in general accordance with OECD 413.
Methods
Aerosols generated with an intense puffing regime were administered to rats in a nose-only fashion at 1400 µg aerosol collected mass/L on a 6 hour/day basis for 90 days with a 42-day recovery. Exposure atmospheres met target criteria. Systemic exposure was confirmed by plasma measurement of nicotine.
Results
No test article-related mortality, clinical signs (other than reversible lower body weight gains in males), clinical pathology or gross findings were noted during this study. No microscopic lesions related to base formulation exposure were identified. Minimal microscopic lesions were observed in the FM3 6-hour exposure group. Microscopic lesions observed in the FM3 6-hour exposure group comprised only minimal laryngeal squamous metaplasia in one male and one female animal. No microscopic lesions related to FM3 exposure remained after the recovery period.
Conclusion
Exposure atmosphere characterization indicated that conditions were achieved to permit thorough assessment of test articles and results indicate a low order of toxicity for the FM3 Electronic nicotine delivery systems (ENDS) formulation and its base formulation.
Keywords
Introduction
Cigarette smoking remains an important public health problem contributing to cardiovascular, pulmonary, and neoplastic morbidities and mortalities. 1 Concerted efforts such as publicizing the risks associated with smoking have contributed to a reduction in its incidence in the US population. 2 Electronic nicotine delivery systems (ENDS) may have a reduced potential toxicity relative to combustible cigarettes. Supporting published evidence includes chemical characterization of ENDS product aerosols,3–5 in vitro analyses of ENDS product aerosols and e-liquids in assays conforming to OECD guidelines6–11 and in vivo inhalation studies on ENDS product aerosols also conducted in general accordance with OECD guidelines. 12
Electronic nicotine delivery systems may further have the potential of reducing the incidence of cigarette smoking and help smokers who would like to reduce their consumption of combustible cigarettes and exposure to the numerous toxic substances found in cigarette smoke.13,14 Certain ENDS products, such as Vuse Vibe, Vuse Ciro and Vuse Solo, were recognized as appropriate for the protection of public health and received marketing authorization from the Center for Tobacco Products division of the U.S. Food and Drug Agency.15,16
The potential of ENDS to contribute to the mitigation of smoking as a public health problem partially depends on developing novel e-liquids and devices meeting cigarette smokers needs and expectations. 2 Fresh Menthol 3% Nicotine (FM3) is a novel proprietary ENDS e-liquid found favorable by some smokers in sensory studies. JUUL sponsored in vitro studies with FM3 gave some indication of cytotoxicity using BALB/c 3T3 fibroblasts (Neutral Red Assay per OECD guideline) contrary to previous results for another menthol formulation that was tested in a 90-day rodent inhalation study.12,17 To further evaluate the potential toxicity of FM3 a subchronic 90-day inhalation study of FM3 and of its corresponding base formulation was conducted in rats.
Materials and methods
Test articles
The JUUL commercial device (U.S.) loaded with a single use pod filled with a proprietary e-liquid (0.7 mL) formulation is referred to as the JUUL ENDS product. JUUL Fresh Menthol 3.0% (FM3) and the corresponding base formulation 3.0% (BA/Nic3) pods were the subject of this study. The composition of FM3 is vegetable glycerin (VG) 60.0% v/v; propylene glycol (PG) 31.3% v/v; nicotine (Nic) 3.0% v/v; benzoic acid (BA) 2.3% v/v; water 1.5% v/v and flavor compounds 1.9% v/v. The base formulation is composed of the primary components of the FM3 formulations without the flavor components: VG 60.0% v/v; PG 33.2% v/v; Nic 3.0 v/v; BA 2.3% v/v and water 1.5% v/v. The FM3 and BA/Nic3 pods were shipped in commercial blister packaging and stored at room temperature (13°C to 25°C) for the study’s duration. Test articles were used within 12 months of their manufacture date.
Experimental design
This study was conducted at the AmplifyBio (West Jefferson, OH) testing facility following a study design and methods similar to a prior study on marketed JUUL products Virginia Tobacco 3% (VT3) and Menthol 3% (ME3). 12 This study was conducted in general accordance with the OECD Test Guidance 413 and in compliance with Good Laboratory Practices (GLP) 21 CFR Part 58.18,19 Animal use was reviewed and approved by the AmplifyBio Institutional Animal Care and Use Committee. Animals were exposed to the test article aerosols for at least 90 days on a 5-day on and 2-day off schedule. The following standard endpoints: in-life measurements (survival, clinical signs, body weights, food consumption), ophthalmology, hematology, clinical chemistry, coagulation, bronchoalveolar lavage fluid (BALF) evaluations and histopathological evaluation of select organs and respiratory tissues were included as indicated by the OECD 413 test guidance. Furthermore, respiratory physiology measurements were collected to evaluate potential irritation and to derive minute*volume values to calculate inhaled doses. Additionally, urinalysis, exposure biomarkers in plasma, and measurement of inflammatory marker concentration assessments in BALF samples from the Core cohort (non-GLP) were also included as endpoints.
Study design.

ACM = Aerosol Collected Mass.
aAcclimation to exposure atmosphere was performed by increasing the exposure duration in a stepwise manner during the first week:
• For 6-hour exposure groups, Day 1 exposure was for approximately 2 hours, Day 2 exposure was for approximately 4 hours, and all subsequent exposures were approximately 6 hours.
• For 4-hour exposure groups, Day 1 exposure was for approximately 2 hours, and all subsequent exposures were for approximately 4 hours.
• For 2-hour exposure groups, Day 1 exposure was for approximately 2 hours and all subsequent exposures were for approximately 2 hours.
In addition to FM3, a group testing its base formulation, Ba/Nic3, at 1400ug ACM/L for the longest exposure duration (6hr/day) was included in the study (Table 1). The BA/Nic3 formulation was composed of the primary components of the FM3 formulation (PG, VG, BA, Nic, and water) in the same proportions but without the FM3 flavor components.
Exposure system set up, qualification and preexposure atmosphere characterization
System design and atmosphere generation
Animals were administered the test atmospheres in a nose-only exposure system designed and manufactured by Battelle Memorial Institute (Columbus, Ohio). Each exposure system was designed to simultaneously deliver the test atmosphere uniformly to 80 nose ports arrayed in five stackable tiers each with 16 individual nose ports per tier.12,21 Nose ports were used to administer the test atmosphere to an animal or as a representative location where test atmosphere samples and environmental data were collected. The exposure systems and carousels for the Filtered Air (FA) group, BA/Nic3 and FM3 groups were housed in the same room with the Filtered Air system isolated behind a heavy curtain to help prevent laboratory environmental cross-contamination. The Filtered Air exposure system consisted of the exposure chamber connected to a high efficiency particulate (HEPA) filtered air source. The nose port air temperature and relative humidity target levels were 22°C ± 2°C and 55% ± 15%, respectively. Each test article chamber or carousel received the exposure atmosphere at a target flow rate of 40 ± 2 L/min corresponding to an approximate rate of 500 mL/min ±10% per animal.
Atmospheres for BA/Nic3 and FM3 formulations were generated using CH Technologies JB-series 2096 (CH Technologies, Westwood, New Jersey) rotary cigarette smoke machines (CSM). These CSMs had a circular 30-port horizontal rotating carousel that allowed for simultaneous puffing of 6 JUUL devices, one each from six puff ports positioned approximately 60° apart from each other. The ENDS devices were attached to the smoking machines at approximately at a 35-degree angle with the mouthpiece up. The target number of puffs for each pod and battery unit was 120 puffs before replacement with a fresh pod and battery. During aerosol generation, CSM carousels were loaded manually in a staggered pattern to provide relatively stable aerosol concentrations constituted of all stages of the pod life. The aerosols from BA/Nic3 and FM3 were generated using a puffing regimen consisting of a 110 ± 0.5 mL puff volume taken over 6 seconds with one puff occurring every 30 seconds with a near-square wave puff profile. The 6 second puff duration corresponds to the maximum duration possible given the JUUL device design. The aerosol output from the six puff ports were drawn into a glass mixing bulb with peristaltic pumps. The aerosol concentration in the glass mixing bulb was controlled via a siphon to exhaust excess aerosol. To achieve the target flow rate and concentration at the nose-port, humidified dilution air was added, as needed, before delivering the resulting atmospheres to the inlet of the exposure chamber (See Supplemental Table A-1 for details).
System qualification and characterization prior to animal exposures
Inhalation exposure systems were tested to ensure their performance and suitability over two consecutive days of 6-hour continuous aerosol generation prior to the initiation of aerosol administration to animals. Supplemental Tables A-2 to A-6 detail the atmosphere endpoints measured in this system qualification process. These included aerosol concentration, spatial uniformity and temporal stability over the duration of the exposure, puff profile, particle size distribution as well as nose port temperature and supply air humidity.
ENDS aerosols were analyzed for concentrations of some primary constituents (PG, VG, benzoic acid and nicotine) and menthol. Additionally, levels of selected harmful and potentially harmful compounds (HPHCs) (acrolein, formaldehyde, acetaldehyde, propionaldehyde, crotonaldehyde, carbon monoxide (CO) 22 and glycidol 23 were also analyzed in exposure systems (Supplemental Tables A-7 to A-9 for details). To ensure that there was no accidental sample contamination or high background levels of analytes in derivatization/extraction solution, open field samples from each exposure room and FA system samples were also collected and analyzed.
Aerosol concentrations in each exposure system were measured for consistency with target values at the nose port on both days of the pre-exposure atmosphere characterization through a series of gravimetric samples. The temporal variability of aerosol exposure concentrations was also monitored using a real-time aerosol monitor (RAM: Microdust Pro, Casella, Bedford, United Kingdom). Spatial uniformity of aerosol concentrations (target ≤7% RSD) was evaluated by simultaneously collecting multiple filter samples from specific nose-ports on multiple tiers of the exposure chamber. Spatial uniformity was also confirmed by measuring air flow velocity through all ports (Kurz Instruments, Inc. Monterey, CA).
Measurement of aerosol particle size distributions for each exposure system (except FA) were performed at least once per day using an eight-stage Mercer-style cascade impactor (L-series) with an effective cut-off diameter range of approximately 0.2 to 2.0 μm. The cascade impactor (used with stainless steel coverslips and filter substrate (25-mm Pallflex® Emfab™ glass fiber filter), was attached to the sampling port and test atmosphere was drawn through it at a flow rate of 1.8 L/min. Mass median aerodynamic diameter (MMAD) and geometric standard deviation (GSD) calculations were made using probit analysis. 24
The nose port temperature and relative humidity of supply air were measured at one of the nose ports in each exposure unit using a calibrated HUMITTER® (Vaisala, Helsinki) solid state integrated humidity/temperature transmitter. Target values for exposure system parameters are given in Supplemental Table A-2.
Atmosphere characterization during animal exposures
Exposure concentrations and particle size assessments
Measurements of aerosol concentration and temporal stability were performed daily by gravimetry using pre-weighed 47-mm Cambridge filters (Performance Systematix Inc., Grand Rapids, MI.). For the BA/Nic3 and FM3 exposure systems, a target of three sets of duplicate gravimetric filter samples at a target sampling duration of 60 minutes (during the first, middle, and last 2 hours of the 6-hour exposure) were collected daily to determine the daily mean ACM concentration and relative standard deviation (RSD) of the exposure concentration (temporal stability). Particle size distribution determinations targeted MMADs of ∼1 μm and GSDs no greater than 1.8 and were performed at least once per week from a nose port in each exposure system (except FA) using the methods described above. Nose port temperature, relative humidity and carbon monoxide levels were recorded at least every 30 minutes. All data was recorded and stored automatically by the Battelle Exposure Data Acquisition and Control system.
Chemical analyses of aerosol constituents
Concentrations of some primary ENDS constituents (PG, VG, nicotine) and menthol were measured in all exposure systems during weeks 2, 4, 8 and 12. The concentration of benzoic acid, also a primary constituent was measured during weeks 2, 7 and 11. Selected HPHCs (acrolein, acetaldehyde, formaldehyde, propionaldehyde, and crotonaldehyde) and glycidol, proposed for addition to the US FDA HPHC list 23 and a degradation product of VG 25 were measured during weeks 2, 7 and 11.
The aerosol samples for PG, VG, nicotine, and menthol analyses consisted of Cambridge filter pads and sorbent tubes (XAD-4 40/80 mg, 20/40 mesh and XAD-7100/200 mg, 20/40 mesh (SKC Inc. (Eighty Four, PA)) extracted with 2-propanol. These samples were analyzed using gas chromatography with flame ionization detection. Samples for benzoic acid analyses were collected using sequential impingers filled with Optima™ LCMS (supplier: Fisher Scientific, Hampton, NH) grade water. The benzoic acid concentrations were analyzed by ultra-performance liquid chromatography with tandem mass spectrometry.
Samples for acrolein, acetaldehyde, formaldehyde, propionaldehyde and crotonaldehyde analyses were collected using bubblers with acetonitrile derivatization solution containing 2,4-dinitrophenylhydrazine and perchloric acid and were analyzed by liquid chromatography with tandem mass spectrometry detection (LC-MS/MS). Glycidol was sampled in two sequential impingers with acetone containing hydrochloric acid and p-toluenesulfonyl chloride, extracted with hexane and analyzed using gas chromatography-mass spectrometry. All aerosol chemical analyses were conducted using validated methods. The chromatographic and analytical method details are given in Supplemental Tables B-1 and B-2.
Animal procedures and data collection
The animal procedures in this study were conducted at AmplifyBio, a contract research organization test facility certified by the Association for the Assessment and Accreditation of Laboratory Animal Care. These procedures met the requirements of the Guide for the Care and Use of Laboratory Animals 26 and were approved by the test facility’s Institutional Animal Care and Use Committee. A total of 150 naïve Sprague Dawley (CD:SD) rats (75 male and 75 nulliparous female) were received at the test facility from Charles River Laboratories and assigned to either the Core or Recovery cohorts. The rats were approximately 9 weeks of age at the time of exposure initiation and were assigned to exposure groups using a stratified randomization program (PROVANTIS, Instem Version 10.1) designed to achieve similar group mean body weights by sex at the beginning of the inhalation administration.
Animals were individually housed in polycarbonate cages with hardwood bedding on a 12-hour light/dark cycle controlled by electronic timers. Room temperature and relative percent humidity controls were set to maintain ranges of 69°F to 75°F and 35% to 65%, respectively, during housing. Animals were quarantined for 7 days following receipt at the test facility for acclimation to the laboratory environment. Animals were acclimated to restraint in the nose-only exposure polycarbonate tubes prior to the start of exposures by being placed in the tubes and breathing room air for increasing durations over the course of five consecutive days up to the target maximal administration duration of 6 hrs.
During exposures, animals were placed in the polycarbonate restraint tubes (Plastic Injection Molding Inc., Richland, WA) which were then attached to the nose-only exposure carousels permitting the animal to breathe the test atmosphere while limiting whole-body-surface exposure.27,28
Clinical observations, body weights and food consumption
Observations for moribundity and mortality were performed twice daily during the quarantine and study periods. Starting from the first day of exposures, detailed clinical observations for signs of toxicity were performed on all animals prior to exposure and within 30-60 minutes post-exposure and once daily on non-exposure days (based on 5-day on and 2-day off exposure schedule) and during the recovery period.
Individual body weights were recorded for all animals at least once prior to Day 1 of exposure, weekly during exposure and recovery periods, 1-2 days prior to schedule necropsy (non-fasted), and on the day of necropsy (fasted) also referred to as terminal body weights. Quantitative food consumption was recorded weekly throughout the exposure and recovery periods for all animals beginning on Day 1.
Plethysmography
Respiratory physiology data was collected by plethysmography during exposures on Weeks 4 and 13. The ‘modified head-out’ plethysmographs were designed by AmplifyBio and incorporate rat pneumotach tubes (Hans Rudolph, Shawnee, KS).
Following a 10-minute acclimation period of the animal within the plethysmograph tube prior to the beginning of exposure, data was collected for approximately 60 minutes from the beginning of inhalation exposure. Plethysmography was performed on the same five male and five female recovery cohort rats at all intervals in order to reduce inter-animal variability and investigate whether potential effects on respiratory physiology persist following cessation of exposures. Respiratory motion was detected by a differential pressure transducer, amplified and recorded by the EMKA Software Suite data acquisition software version 1.0 (Emka Technologies, Paris, France) which recorded the respiratory waveform and derived the respiratory function parameters, i.e., respiratory frequency (breaths per minute), tidal volume (volume of each breath in mL per breath) and calculated minute*volume (volume inhaled per minute (min*vol)).
Inhaled aerosol mass and nicotine doses
The principal measure of dose in this study was the aerosol mass per day (mg ACM/day) calculated as the product of the mean ACM concentration (mg/L), the duration of exposure (min/day) and the minute*volume (L/min). Nicotine doses were calculated as the product of the aerosol mass per day and the ratio of nicotine to ACM concentrations in the aerosol.
Confirmation of systemic exposure
Concentrations of nicotine, cotinine, and PG were measured in plasma samples collected within 10 minutes of the end of inhalation administration to confirm systemic exposure. Blood samples were collected from five unanesthetized animals per sex per group via the jugular vein on Day 4 and during weeks 4 and 12. The blood collections were rotated between three sets of five animal each per group such that blood was collected from each animal only once during exposures. Blood samples for plasma were collected into tubes containing K3EDTA and processed via centrifugation (10 min at 4°C) at ∼1800 g. The resulting plasma samples were maintained frozen at −85°C to −60°C and analyzed for nicotine, cotinine, and PG. Blood samples for carboxyhemoglobin measurement were collected into heparin containing tubes and quantitated in a ABL90 Flex Plus blood gas analyzer (Radiometer America Inc, Brea, CA). All of these chemical analyses were conducted using validated methods.
Ophthalmic examinations
Ophthalmic examinations were performed by a board-certified veterinary ophthalmologist for all animals prior to exposure, during exposure Week 12, and for all recovery cohort animals during the last week of the recovery period. The pupils were dilated by instillation of tropicamide prior to examination of the anterior, posterior segments, and adnexal structures of the eyes with a slit lamp and indirect ophthalmoscope.
Clinical pathology
Standard hematology, clinical chemistry, coagulation, and urinalysis endpoints were evaluated from samples collected at Core (Day 94) and Recovery necropsies (Day 135) [Supplemental Table C1]. Blood samples were taken from animals fasted overnight (approximately 12 to 22 hours) prior to collection. Collections were performed under isoflurane anesthesia via the retro-orbital plexus or vena cava. The sample collection, volume, test methods, and analytical instrument-related details for clinical pathology analyses are included in Supplemental Tables C2-C5. Urine samples were collected overnight for at least 12 hrs in metabolism cages following the last exposure from all Core and Recovery cohort animals.
Necropsy, gross exams and organ weights
For both Core and Recovery necropsies, all animals were anesthetized with isoflurane and euthanized via exsanguination prior to gross necropsy and BALF collection. Complete gross necropsy exam was conducted within 24 hours of the last exposure and at the end of the 6-week recovery period. All tissues listed in Supplemental Table D were collected and weighed at both Core and Recovery necropsies. The paired organs were weighed together as detailed in Supplemental Table D.
BALF collection and analysis
The BALF collection process consisted of five consecutive lavages performed on the right lung of each animal with each lavage consisting of 3 mL of room temperature BALF solution (Hanks Balanced Salt solution without calcium, magnesium or phenol red). The BALF from the 1st lavage and from the 2nd through 5th lavages were collected into two separate tubes for each animal and placed on ice until centrifugation. The supernatant from the first lavage was analyzed for total protein, lactate dehydrogenase (LDH) and alkaline phosphatase concentrations. The cell pellets from all lavages were combined for each animal and suspended in 1 mL BALF solution. Using a hemacytometer, the number of cells per sample were adjusted to a concentration of 200 cells per µL for cytospin slide preparation. Leukocyte differentials were performed on ∼100 cells. See Supplemental Table E for BALF analysis method details. The remaining supernatant of the 1st lavage from the Core cohort samples was shipped frozen on dry ice to Protavio Ltd, Attiki, Greece for non-GLP inflammatory marker concentration analyses. This analysis was performed using a bead-based multiplex immune assay measuring the concentration of 36 markers (see Supplemental table set F for details). All assays were verified for performance by measuring eight 3-fold dilutions of recombinant protein standards and blank samples (sample diluent) to calculate the Limit of Blank (LOB), Limit of Detection (LOD), Lower Limit of Quantitation (LLOQ) and Upper Limit of Quantitation (ULOQ). 29 A quality control sample was prepared by spiking known amounts of recombinant protein standards in sample diluent and was analyzed in at least three runs to calculate the spiked accuracy and precision of assays. A 5-parameter logistic model was fitted to the standard points to transform median fluorescence intensities to analyte concentrations. Based on their performance, a total of 35 markers qualified for the analysis of BALF samples.
Histopathology
All tissues listed in Supplemental Table D from the FA, BA/Nic3 and 6 hour FM3 groups were examined microscopically at both Core and Recovery necropsies. Respiratory tissues (nasal turbinates, larynx, pharynx, trachea, lungs, and carina) and gross lesions from all dose groups (2-hour, 4-hour and 6-hour) were examined microscopically at both Core and Recovery necropsies. Tissues were collected and processed as proposed by the OECD 413 guideline. 18 All these tissues were fixed in 10% neutral-buffered formalin (NBF) except for eyes and epididymides which were initially fixed in Davidson’s or modified Davidson’s before transfer to NBF. Lungs were inflated with NBF using a Mariotte bottle at a water pressure of 25 cm.
Tissue slides were examined microscopically at the testing facility by a board-certified veterinary pathologist. Following this initial evaluation, a second board-certified veterinary pathologist from the testing facility conducted an internal peer review to arrive at the final tissue evaluation. Final histopathologic grades were assigned according to the following scale: minimal (1), mild (2), moderate (3), and marked (4), based on increasing extent and/or complexity of change, unless otherwise specified.
Data reporting, statistics and interpretation
Atmosphere characterization and bioanalysis data was reported as descriptive statistics (mean ± SD and/or RSD). Survival, clinical observation, and gross lesion data was reported as incidences. Histopathological findings were reported as incidence with a severity grade. The relationship of observations to test atmosphere exposure was not determined solely on statistical differences but also took into consideration the biological and toxicological relevance based on factors including dose-responsiveness and comparison to ranges in the test facility’s historical control data.
Statistical analysis of clinical pathology and plethysmography data
In-life clinical pathology and respiratory physiology data was collected and analyzed statistically using the PROVANTIS software version: 10.1 (Instem, Staffordshire, UK). The data were analyzed via parametric or nonparametric analysis of variance (ANOVA) to detect potential test exposure-related effects.
The data was tested for normality via Shapiro-Wilks test and homogeneity of variances using Levene’s test. Data was log-transformed to meet parametric assumptions. For parametric data determined to be normally distributed and homogeneous among groups, an ANOVA F-test was used to determine whether there were differences among the group means. Statistical tests were performed at the 0.05 level of significance (p < .05), after adjusting for multiple comparisons. If the ANOVA F-test was significant, then tests for differences between the FA control and each of the comparison groups were conducted using Dunnett’s test, which adjusted for multiple comparisons. For nonparametric data that were not normally distributed and/or nonhomogeneous, a Kruskal-Wallis test was used to determine whether there were differences among the group means. If the Kruskal-Wallis test was significant, then tests for differences between the FA control and each of the comparison groups were conducted using Wilcoxon tests and the Bonferroni-Holm method to correct for multiple comparisons.
Statistical analysis of inflammatory marker levels in BALF samples
Summary statistics (mean and SD) and resulting fold difference in mean inflammatory markers concentrations of each test group relative to those in the FA group were calculated. Values for samples with below BLOQ concentrations were imputed as LLOQ for the analyte divided by √2. The group means were calculated with imputed value(s) unless all values for an analyte in all groups were BLOQ in which case the results for this analyte were not reported in tables or graphs.30,31 Concentrations of inflammatory markers in samples from the test groups (BA/Nic3, FM3-2hr, FM3-4hr and FM3-6hr) were compared to levels in FA controls in a pairwise manner using the Dunnett’s statistical test performed in R using PMCMRplus Version 1.9.3.
Results
Pre-exposure aerosol characterization
Target atmosphere criteria including ACM concentration levels, particle size distributions, spatial homogeneity, and environmental parameters (temperature and % relative humidity) were generally met for all test groups throughout the 2 days of system characterization preceding the start of animal exposures (see Supplemental Tables A1 to A9). Mean aerosol concentrations for test product groups were 108% and 105% of target values for the BA/Nic3 and FM3 carousels, respectively, while the mean spatial homogeneities in total port variation were 0.6 and 1.1% RSD. The interday BA/Nic3 and FM3 aerosol concentration variabilities measured with the RAM were 12.2 and 20.6 % RSD, respectively. The variability measured with the RAM is comparatively high because of brief signal spikes caused when ENDS devices are replaced on the CSM carousel. However, the corresponding interday variabilities measured gravimetrically were 2% and 1% indicating good temporal stability of the BA/Nic3 and FM3 aerosols. Because of the discrepancy with the RAM data, although it was subsequently collected it was not audited or reported for the 90 study as the aforementioned gravimetric sampling was deemed sufficient to ensure temporal stability of the exposures. Carbon monoxide concentrations in the BA/Nic3 and FM3 exposure systems were below the 1.0 ppm limit of detection.
Exposure aerosol characterization
Nose-port exposure atmosphere characterization.

aMean ± SD, n = 136 and 400 for ACM measurements of FA and of BA/Nic3 & FM3, respectively, n = 2 and six measurements (weeks 2, 4, 8 &12) for PG, VG, menthol, benzoic acid and Nic measurements of FA and of BA/Nic3 & FM3, respectively.
BLOQ = Below limit of quantitation; BA = benzoic acid; FA = Filtered Air; NA = Not Applicable; PG = Propylene glycol; VG = Vegetable glycerin; Nic = Nicotine.
Concentrations of PG and VG measured in the exposure atmosphere as a percent of ACM (Table 2) were consistent with their concentrations in the e-liquid formulations and pre-exposure aerosol characterization (Supplemental Table A-7 and A-8). Nicotine concentrations were very consistent between BA/Nic3 and FM3 groups while benzoic acid concentrations exhibited a little more variability between groups (Table 2). Menthol was measurable in the FM3 exposure atmosphere but not in BA/Nic3 aerosol or Filtered Air (Table 2). Carbon monoxide concentrations were BLOQ (<1 ppm) in both the BA/Nic3 and FM3 atmospheres.
Mean concentrations of harmful and potentially harmful constituents measured in the nose-port exposure atmospheres.

aMean ± SD, n = 3 measurements (weeks 4, 7 and 11).
bSince the ACM for the Filtered Air group was 0.00 µg/L throughout, a ratio was not calculated for the group.
BLOQ = Below limit of quantitation; ACM = Aerosol collected Mass; NC = Not Calculated; ND = not detected.
Inhaled dose measurements and exposure confirmation
Mean Minute*Volumes, total inhaled ACM and nicotine doses and plasma nicotine + cotinine concentrations in rats exposed to filtered air, BA/Nic3 and FM3 aerosols.

aN = 162 to 170 for ACM.
bminute volume data was statistically compared to FA.
cminute volume data was obtained in Week 13.
dPlasma concentrations of nicotine and cotinine obtained in Week 12.
*Statistically significantly different from Filtered Air (Anova & Dunnett; p < .05).
BLOQ = Below limit of quantitation; Nic = Nicotine, Cot = Cotinine.
Daily ACM and Nicotine doses increased with exposure duration in the FM3 groups. Daily ACM and Nicotine doses for the 6-hour exposure groups were similar between the BA/Nic3 and FM3 groups. The BA/Nic3 ACM and Nicotine doses were similar (within 2-fold) to the values for VT3 and ME3 in both males and females. 12
The plasma concentrations of nicotine did not increase substantially with increased dose or duration perhaps owing to its short half-life in the rat. 33 The combined plasma concentrations of nicotine and cotinine did increase with dose and exposure duration though less than proportionally. The 6-hour exposure groups for BA/Nic3 and FM3 had similar plasma concentrations of nicotine and cotinine. Plasma nicotine and cotinine concentrations in the BA/Nic3 and FM3 exposure groups were similar to those measured in the VT3 and ME3 exposure groups of corresponding exposure duration. 12 PG was also confirmed in plasma samples of rats exposed to BA/Nic3 and FM3 though there was little evidence of concentration increases in response to greater dose and duration of administration. No substantial differences were apparent in these trends between males and females.
Survival and clinical observations
No mortalities occurred during the exposure or recovery periods. Clinical observations including hunched posture, rough coat, thin appearance, tremors, decreased activity, lethargy, and rapid/increased breathing were noted during the study; however, these observations were considered non-adverse as they occurred transiently in a non-dose-dependent manner and resolved quickly. No ophthalmic abnormalities resulting from test product exposure were observed during the study.
Body weight and food consumption
Reduced body weight gain relative to the Filtered Air control group was noted in all male groups, but not in the female groups, as commonly seen following nicotine administration in rats (Figures 1 and 2). Statistically significant reductions in absolute group mean body weight (ranging from 8.64% to 15.51% lower) were observed in the males exposed to BA/Nic3 compared to the males exposed to FA starting on Day 15 and persisting until Day 94. These differences resolved during the recovery period. Statistically significant reductions in absolute group mean body weight (ranging from 6.42% to 16.52% lower) were also observed in males exposed to FM3 for 4-hours/day and 6-hours/day compared to males exposed to FA starting on Day 29 and Day 15, respectively. These reductions in BW relative to the FA males persisted through Day 94. During the recovery period, body weight differences between FM3-treated groups and FA controls were reduced and no longer statistically significantly different at the Recovery sacrifice. In contrast to males, over the duration of the exposure and recovery periods, no toxicologically relevant differences in the group mean body weight were observed in the females exposed to BA/Nic3 or FM3 relative to those exposed to FA. The group mean body weights of the females exposed to BA/Nic3 or FM3 were within 9 and 11%, respectively, of the FA females for the duration of the study. Group mean body weight of FA, BA/Nic3-and FM3-Exposed males. Group mean body weight of FA, BA/Nic3-and FM3-Exposed females.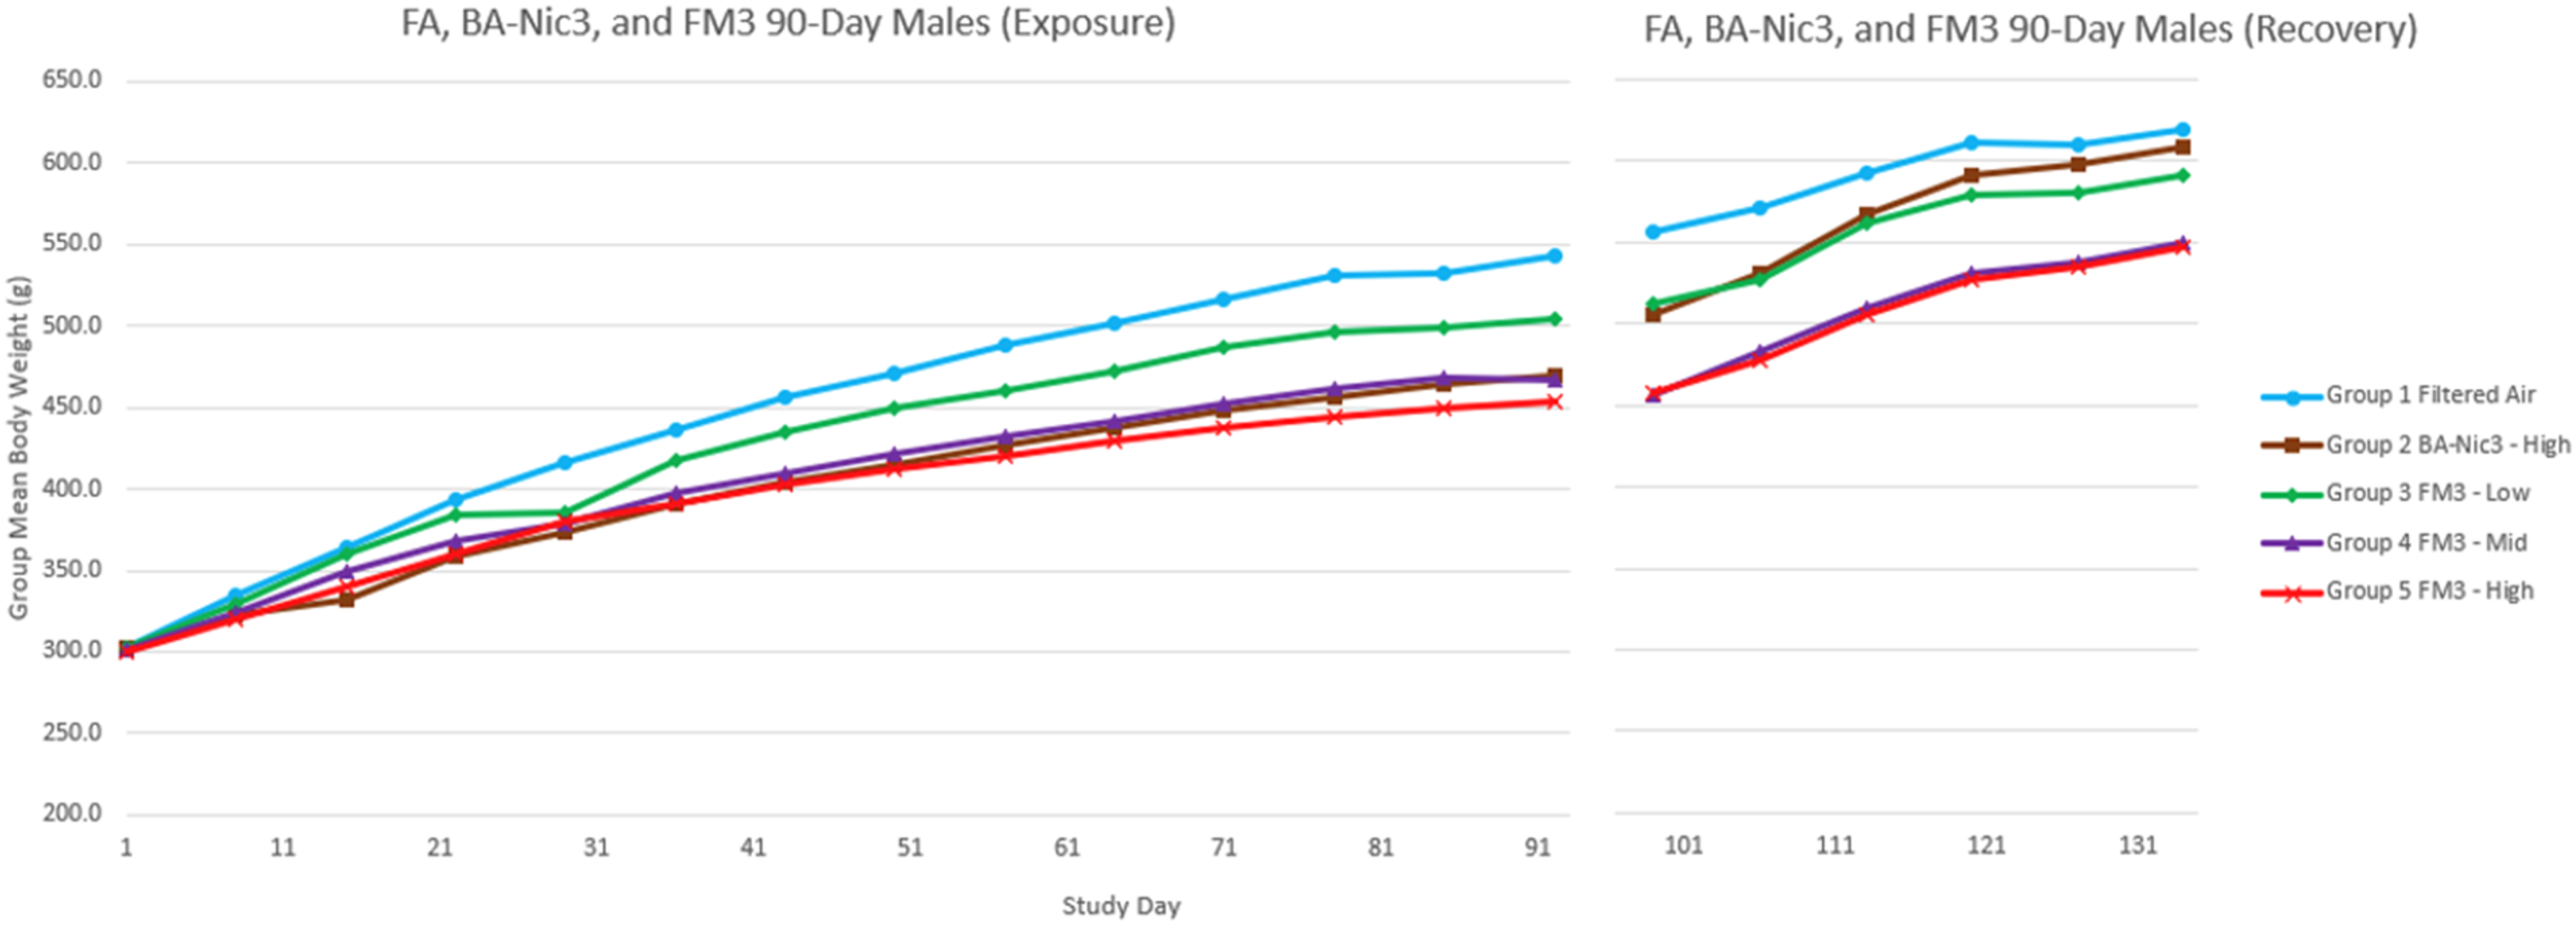

Food consumption in males exposed to BA/Nic3 was generally reduced relative to rats exposed to FA over the exposure period; statistically significant reductions in food consumption were observed intermittently between Days 1 to 36 and Days 92 to 93 in the males exposed to BA/Nic3 (Supplemental Figure G1). This overall reduction in food consumed per day (including the non-statistically significant reductions) ranged from a difference of 0.0 to 4.7 g/day, when compared to the FA controls. Similarly, food consumption in males exposed to FM3 was generally reduced relative to rats exposed to FA over the exposure period; statistically significant reductions in food consumption were observed intermittently in the males exposed to FM3 (Supplemental Figure G1). A statistically significant reduction in food consumption was only observed once (Days 22 to 29, 4.4 g/day) in the animals exposed to FM3 for 2 hours/day, when compared to the FA males. Overall, the reduction in food consumed per day in males exposed to FM3 for 2 hours/day, ranged from 0.0 to 4.4 g/day when compared to the FA males. Additionally, statistically significant reductions in food consumption were observed intermittently between Days 1 and 93 in the males exposed to FM3 for 4 hours/day and 6 hours/day. This overall reduction in food consumed per day ranged from a difference of 0.20 to 5.7 g/day, compared to those males exposed to FA. No statistically significant changes in food consumption were observed during the recovery phase. Though not statistically significantly increased when compared to the FA males, the males exposed to BA/Nic3 or FM3 immediately increased food intake upon cessation of exposure.
In females, a statistically significant reduction in food consumption relative to rats exposed to FA (1.7 and 2.4 g/day) was observed from Days 1 to 8 in females exposed to BA/Nic3 or FM3 for 6 hours/day, respectively (Supplemental Figure G2). Statistically significant increases in food consumption (1.8 to 2.3 g/Day) were observed intermittently from Days 85 to 93 in the females exposed to FM3 for 4 hours/day or 6 hours/day. No statistically significant decreases in food consumption were observed during the recovery phase; however, intermittent statistically significant increases in food consumption (ranging from 2.9 to 3.8 g/Day) were observed in females administered FM3 for 4 hours/day or 6 hours/day during the recovery period (Supplemental Figure G2).
Clinical pathology results
Clinical pathology data (hematology, clinical chemistry, coagulation and urinalysis) are presented in the Supplementary section tables sets H, I, J, and K). For physiological context and evaluation of biological significance, values were compared to historical control reference ranges established for the testing facility for Sprague Dawley rats of their respective sex.
No toxicologically relevant BA/Nic3-or FM3-related changes were observed in the clinical chemistry, hematology, coagulation, and urinalysis data in the 90-day Core or Recovery cohort animals of either sex, when compared to those exposed to FA. Following the 90-day cohort exposure period, the group mean serum sodium concentrations were minimally elevated for both males and females exposed for 4 or 6 hours/day to FM3. These values remained largely unchanged in the corresponding recovery groups though no longer statistically significant when compared to the FA controls. Mean triglyceride concentrations in males dosed with BA/Nic3 and FM3 were lower than those in the FA group with the difference in the 6-hour groups reaching statistical significance. No such effect was observed in females. All other statistically significant findings in the serum chemistry results were of limited scope and affected only one sex and/or were not dose-dependent; therefore, these changes were not considered related to test article exposure.
No significant findings in the BAL fluid clinical chemistry, cytology, or inflammatory mediator concentrations were observed in the Core group animals exposed to BA/Nic3 or to FM3 at any dose level (Supplemental Table L). Differential data from the Core cohort animals demonstrated predominant pulmonary macrophages, which is typical for normal rats. A technical problem with the storage of the BAL cytology samples from the Recovery cohort prevented their analysis for cell differentials. Although this differential data was not available, since there were no test article-related effects observed in the Core Cohort, there were no test article-related changes for the recovery cohort animals to recuperate from. There were no significant findings in the BAL fluid chemistry of the recovery cohort.
No significant differences in the concentrations of inflammatory markers in the BALF were observed in male or in female rats exposed to BA/Nic3 or FM3 when compared to those exposed to FA (Supplemental Tables L-5).
Gross pathology, terminal body weights and organ weights
Statistically significant changes were observed in terminal body weights and organ weights in Core cohort animals exposed to both BA/Nic3 or FM3; however, these differences were either not dose dependent, did not similarly affect both sexes, and lacked microscopic correlates; therefore, these changes were deemed unrelated to BA/Nic3 or FM3 exposure (Supplemental Table Set M).
At the end of the exposure period, BA/Nic3, FM3-4-hour, and FM3-6-hour exposed males had decreased terminal body weight (−15.51%, −11.82%, and −15.86%, respectively) compared to control animals exposed to FA. Statistically significant organ weight differences, lower absolute weights, higher organ weights relative to body weights, and/or lower organ weights relative to brain weight in the following organs: brain, heart, liver, pituitary gland, and testes were noted. The FM3-6-hour male lung weight (absolute and relative to brain weight) was statistically significantly decreased and the BA/Nic3 male pituitary weight relative to the brain weight was statistically significantly increased following the recovery period compared to the FA controls. The high pituitary relative to brain weight ratios was due to high absolute pituitary weights of two individual males. No pituitary gland abnormalities were noted grossly or microscopically in these animals and the increased weight was attributed to individual variation. Overall, these changes were deemed unrelated test article exposure as no microscopic correlates were observed.
At the end of the exposure period, the female terminal body weights of the animals exposed to BA/Nic3 or FM3 were not statistically significantly different when compared to the FA controls. As observed in males, some statistically significant increases or decreases in organ weights (absolute, relative to terminal body weight, or relative to brain weight) were noted. However, these were deemed unrelated test article exposure as no microscopic correlates were observed.
No BA/Nic3 or FM3-related gross lesions were identified following the exposure or recovery periods. A few gross findings were observed across most dose groups which were considered spontaneous/incidental findings that are common to occur in Sprague Dawley rats.
Microscopic findings were observed in a variety of tissues across the FA control and exposure groups in both male and female animals. These findings were deemed spontaneous/incidental findings that occur as background lesions in rats and therefore were considered unrelated to BA/Nic3 or FM3 exposure.
Histopathology
Summary of test article-related findings – male and female 90-day Core cohort – Day 94.

aThe values in the table are defined as the Number of affected animals and the average severity (histopathologic grade) of the lesion. Histopathologic grades were assigned according to the following scale: minimal (1), mild (2), moderate (3), and marked (4), based on increasing extent and/or complexity of change. Average severity was calculated by adding all the grades of affected animals in the group and dividing by the number affected.
b Larynx was not available for histopathological examination.
Discussion
Atmosphere characterization of the BA/Nic3 and FM3 exposure systems, developed in the phase prior to animal administration, indicated that aerosols were produced and delivered to the nose-ports in a consistent fashion permitting the evaluation of the test products and their comparison to the FA control group. Specifically, aerosol concentrations, temporal stability, spatial uniformity, and particle size distributions for both the BA/Nic3 and FM3 exposure systems met target values. Similarly, temperature and humidity measured at the nose-port met target values.
In the 90-day study aerosol concentrations of primary constituents (PG, VG, BA & Nic) were similar in the BA/Nic3 and FM3 atmospheres with the exception of menthol which was present in FM3 only. These concentrations were consistent with the composition of their respective e-liquid formulations and were similar to the concentrations measured in the VT3 and ME3 atmospheres described in Desai, et al. 12 Acrolein, crotonaldehyde, propionaldehyde and glycidol concentrations were below their respective lower limit of quantitation in the FA, BA/Nic3 and FM3 atmospheres. Low levels of formaldehyde and acetaldehyde (two potential thermal degradation products of VG and PG) were measurable in all exposure atmospheres, including FA. While the levels of formaldehyde and acetaldehyde in the BA/Nic3 and FM3 atmospheres were respectively ∼4- and ∼2-fold higher relative to FA, they were only marginally outside the variability of the FA measurements and generally within levels frequently reported for indoor home and office settings.34,35
Target aerosol concentrations and particle size distributions were achieved and maintained in this study. Systemic exposure was confirmed in all test article-exposed groups by measuring nicotine, cotinine, and PG in plasma.
Consistent with 3R principles, this study did not include a combustible cigarette control group which would have permitted a concurrent comparison of the toxicity potential of FM3 and base formulation aerosols to that of cigarette smoke. 20 However, doses and exposure conditions (i.e., exposure time and nicotine exposure levels) were chosen to mimic those in a recent study which did include a 3R4F group providing a reference point for combustible cigarette smoke associated pathologies. 12 In that study, cigarette smoke was delivered at a level of 250 ug ACM/L. This level was chosen to be low enough to avoid morbidity or mortality but still result in measurable toxicity and histopathology findings when administered in a 90 Day study on a 6 hour/day and 5 day/week administration basis.
A 1400 ug/L aerosol concentration was chosen to achieve, at the shortest exposure duration (2 hrs), the plasma nicotine concentrations of the 3R4F (6hr) group in the Desai et al. study. 12 This selection was made on the assumption that smokers adapt their smoking behavior based on nicotine uptake and plasma nicotine concentrations.36,37 Accordingly, peak plasma concentrations of nicotine + cotinine in the animals dosed with BA/Nic3 were within +/− 10% of those measured in the animals dosed with VT3 or ME3 while the corresponding value in the animals dosed with FM3 was +/− 7.5%.
Biological analyses following administration of BA/Nic3 and FM3 aerosols showed only minimal signs of toxicity limited to reduced body weight gain in male rats. No mortality was observed in any group in either the Core or Recovery cohorts in this study. Clinical observations were minimal and deemed non-adverse due to their transient nature and reversibility. No test article-related effects were observed during the ophthalmic exams. Statistically significant moderate reductions in food consumption and corresponding lower body weight relative to the FA group were observed during the exposure phase in males exposed to BA/Nic3 and FM3 but resolved upon cessation of exposure and were no longer significantly different from the FA by the end of the recovery period. In contrast, no substantial difference in body weight was observed in any test article-treated group of females relative to the FA controls during the exposure or recovery periods. Differential weight effects between males and females has been observed previously following exposure to cigarette smoke and heat-not burn product aerosols38,39 and to ENDS aerosols.12,40
Exposure to BA/Nic3 or to FM3 for any duration in either sex did not result in any test article-related changes in the hematology, coagulation, serum chemistry, urinalysis, or BAL fluid analysis (clinical chemistry, cytology or inflammatory marker concentrations) data when compared to the FA-treated animals.
Test article related gross lesions were not observed in any BA/Nic3 or FM3 groups. No BA/Nic3-related microscopic lesions were identified. Statistically significant changes in relative and/or absolute organ weights were observed in BA/Nic3 and FM3-exposed animals; however, these changes were not dose dependent, did not affect both sexes, and/or had no microscopic correlates suggesting the changes were due to individual variation and unrelated to BA/Nic3 or FM3 exposure. FM3-related microscopic lesions were limited to the larynx at the level of the epiglottis, which consisted of minimal squamous metaplasia of the epiglottis. Minimal squamous metaplasia such as observed here is considered an adaptive, non-adverse finding.41,42 This observation resolved during the recovery period. These results are consistent with those reported by Desai et al., for another menthol containing ENDS formulation. 12 The absence of toxicologically relevant histopathological findings in the respiratory tract of the rats exposed to FM3 aerosols after 90 days of exposure supports the lack of biological significance of the in vitro cytotoxicity observations with the FM3 e-liquid formulation. While the study was not designed to compare the effect of exposure to FM3 and BA/Nic3 aerosols, no substantial difference in any of the toxicological endpoints was apparent suggesting there was little, if any, toxicological effects of the flavor component of FM3 including menthol.
Overall, the results of this study indicate a low toxicological potential for the FM3 and BA/Nic3 ENDS formulation aerosols. As noted previously, for those products that have received marketing authorization from the Center for Tobacco Products division of the U.S. Food and Drug Agency, a plethora of studies including chemical, toxicological, clinical trials and abuse liability studies were submitted for their evaluation.15,16
Conclusion
The present study extends our knowledge of the potential inhalation toxicological properties of complete ENDS formulation aerosols. Administration of the JUUL Fresh Menthol 3% formulation or of the corresponding non-menthol base formulation aerosols at target concentrations of 1400 ug ACM/L to rats for 90 days in a study conducted in general accordance with the OECD 413 guideline indicated a minimal toxicity profile for both test articles.
Supplemental Material
Supplemental Material - Subchronic inhalation of a novel electronic nicotine delivery system formulation and its corresponding base formulation
Supplemental Material for Subchronic inhalation of a novel electronic nicotine delivery system formulation and its corresponding base formulation by Guy Lalonde, Nikos Tsolakos, Tessa R. Moir-Savitz, Alex Easley, Charles L. Gaworski, and Michael J. Oldham in Human & Experimental Toxicology
Footnotes
Acknowledgements
The authors thank Rahat Wadhwa Desai for study monitoring; Christos Fotis for help with BALF analysis; MaryEllen Lynch for project management of the in vivo work; Liz Bradford for editorial and design assistance; I. Gene Gillman for chemistry review and consultation.
Author contributions
MJO and GL conceived the study, MJO obtained funding for the study, GL, CLG, NT, and TRM designed the study, TRM was the study director and NT performed the inflammatory marker analysis, GL wrote the first draft and all authors reviewed and edited the manuscript and approved the final version of the manuscript.
Declaration of conflicting interests
The author(s) declared the following potential conflicts of interest with respect to the research, authorship, and/or publication of this article: All authors are employees of or consultants for Juul Labs, Inc., the contract research organization that was compensated for performing the work or the contract research organization that was compensated to perform the inflammatory maker analysis in bronchial alveolar lavage fluid.
Funding
The author(s) disclosed receipt of the following financial support for the research, authorship, and/or publication of this article: The work was funded by Juul Labs, Inc.
Ethical statement
Data availability statement
Data sets are provided in the supplemental material.
Supplemental Material
Supplemental material for this article is available online.
Appendix
References
Supplementary Material
Please find the following supplemental material available below.
For Open Access articles published under a Creative Commons License, all supplemental material carries the same license as the article it is associated with.
For non-Open Access articles published, all supplemental material carries a non-exclusive license, and permission requests for re-use of supplemental material or any part of supplemental material shall be sent directly to the copyright owner as specified in the copyright notice associated with the article.