
Abstract
Background
Capecitabine (CAPE), an antimetabolite chemotherapy, can induce hepatic and renal toxicity. Melatonin (MEL), a neurohormone, possesses antioxidant, anti-apoptotic and anti-inflammatory effects. This study investigated the impact of MEL on capecitabine-induced hepatic and renal toxicity.
Methods and materials
Twenty-five male Wistar rats were categorized into five groups for the study. The groups included a control group, MEL10 group (rats receiving daily intraperitoneal injections of 5 mg/kg MEL), CAPE 500 group (rats receiving weekly intraperitoneal injections of 500 mg/kg CAPE), CAPE + MEL five group, and CAPE + MEL 10 group. All groups were treated for a duration of 6 weeks. Various hematological, serological, biochemical, and histopathological assessments were conducted to evaluate the objective of the study.
Results
The administration of CAPE led to significant liver and kidney toxicity, as evidenced by elevated levels of malondialdehyde (MDA), myeloperoxidase (MPO), nitric oxide (NO), as well as serological markers including AST, ALT, ALP, BUN, and creatinine. CAPE exposure also resulted in a reduction in total antioxidant capacity (TAC) and glutathione peroxidase (GPx) levels. Histological examination revealed hyperemia in both liver and kidney tissues exposed to CAPE. However, treatment with MEL demonstrated positive effects. MEL administration alleviated oxidative stress, reduced levels of liver enzymes, BUN, and creatinine, and ameliorated histopathological degenerations. MEL also increased GPx and TAC levels. Moreover, MEL treatment aided in restoring the body weight that was lost due to CAPE exposure.
Conclusion
Our findings indicated that the administration of MEL in rats significantly reduced the hepatic and renal toxicity induced by CAPE.
Introduction
Capecitabine (CAPE), the oral form of 5-fluorouracil (5-FU), is an antimetabolite chemotherapy agent approved for the adjuvant treatment of colon cancer as well as the management of high-stage colorectal, gastric, and breast tumors. 1 It is believed that 5-FU's anticancer activity results from its metabolism to 5-fluoro-2'-deoxyuridine monophosphate, an enzyme antagonist of thymidylate synthase. Thymidylate synthase is a crucial enzyme for the development of malignancies.2,3 While the medication 5-FU is intended to attack cancerous cells, it can also impact healthy cells, resulting in negative effects like necrosis, genomic instability, and impeded cell growth. Furthermore, there is a risk of toxic byproducts and severe consequences. Common adverse reactions to this prescription include organ toxicity (such as the gastrointestinal system, heart, kidney, liver), diarrhea, bone marrow suppression, dermatitis, and genital abnormalities. 4
A potential downside of undergoing CAPE treatment is the risk of drug-induced liver damage, which can be detected by elevated levels of bilirubin. Researchers suspect that this damage may be caused by direct toxicity to the liver, as the microsomal enzyme system in this organ is primarily responsible for metabolizing CAPE. It is plausible that the formation of harmful chemicals during this process could be to blame for liver damage. 5 While a few patients using CAPE may sometimes experience an elevation in serum aminotransaminase, it is unlikely that this will lead to elevated levels that are more than five times the upper limit of the reference range. 5 Considering the use of CAPE in chemotherapy regimens, it is important to analyze the underlying mechanisms involved in CAPE-induced hepatotoxicity, focusing on oxidative stress and inflammatory pathways.
Although 5-FU-induced nephrotoxicity has been documented in earlier animal research,6,7 CAPE-induced nephrotoxicity is less well supported. However, certain case reports suggest renal impairment as a result of CAPE therapy. 8 It is important to note that 5-FU is metabolized into dihydrouracil, which can be further broken down in the liver, leading to the production of compounds contributing to nephrotoxicity.4,9 As the oral form of 5-FU, CAPE, this mechanism, and the ensuing nephrotoxicity might also be hypothesized for this medication. Given the limited amount of knowledge surrounding the topic, it is important to thoroughly investigate the CAPE-induced nephrotoxicity. Specifically, the study aims to shed light on the intricate involvement of oxidative stress and inflammatory pathways in this process.
The main secretion of the pineal gland is melatonin (MEL), which is known for its antioxidant properties and ability to neutralize free radicals. 10 There have also been reports of anti-inflammatory, anti-apoptotic, anti-cancer, and immunomodulatory properties. 11 MEL is a lipophilic chemical that readily penetrates cells and crosses cellular membranes. By preserving mitochondrial homeostasis, it protects physiological redox equilibrium.12,13 The aim of the current study was to explore CAPE-induced hepato- and nephrotoxicity and the protective effect of MEL in male Wistar albino rats.
Methods and materials
Chemicals and reagents
CAPE and MEL were purchased from Merck (Germany) and Sigma, St Louis, MO (USA), respectively. We bought kits for malondialdehyde (MDA), myeloperoxidase (MPO), nitric oxide (NO), glutathione peroxidase (GPx) and total antioxidant capacity (TAC) from Teb Pajohan Razi (Iran).
Animal experimental design
Twenty-five male Wistar albino rats were obtained from the laboratory animal facility of Babol University of Medical Sciences. The mean age and weight of the animals were 6-8 weeks and 180 g, respectively. The rats were held under controlled circumstances, maintaining precise temperatures (22 °C–24°C) and humidity (50 ± 5%), along with 12-h light/12-h darkness cycles. Throughout the course of the trial, the rats were placed in cages with LSB Aspen woodchip bedding and allowed free access to water and food. The research methods were given approval by the Babol University of Medical Sciences ethical committee (Code: IR.MUBABOL.AEC.1401.036).
After a week, the animals were assigned to five groups at random. (I) The Control group: treated with intraperitoneal (IP) injection of normal saline.
14
(II) The CAPE 500 group: treated with IP injection of 500 mg/kg CAPE once a week for six consecutive weeks.
15
(III) The CAPE 500 + MEL five group: treated with CAPE like the second group + IP injections of 5 mg/kg MEL once a day for 6 weeks.
11
(IV) The CAPE 500 + MEL 10 group: treated with CAPE like the second group + IP injections of 10 mg/kg MEL once a day for 6 weeks.
16
(V) The MEL 10 group: treated with IP injections of MEL at a dose of 10 mg/kg once a day for 6 weeks.
Sample collection and preparation
The animals received their treatments for 6 weeks and then rested. Finally, they were given a ketamine/xylazine anesthesia at the seventh week. The serum was separated by centrifuging the blood for 15 min at 1500 g with 5 mL of it being extracted from the heart and placed into 5 mL microtubes. Rats were then put to death by decapitation, and their liver and kidney were taken out for hematoxylin-eosin (H&E) staining and biochemical examination.
Liver and kidney serum markers test
Commercial ELISA kits (Pars Azmun, Karaj, Iran) were utilized to determine the amounts of alkaline phosphatase (ALP), aspartate aminotransferase (AST), alanine aminotransferase (ALT), urea, blood urea nitrogen (BUN), and creatinine (Cr) in specimens.
Biochemical analysis
Evaluation of malondialdehyde activity
The malondialdehyde (MDA) assay was performed to measure the amount of lipid peroxidation in serum samples. Following oxidative breakdown of polyunsaturated fatty acids, MDA is produced as a byproduct, which is sparked by free radicals, thus, being measured usually as an oxidative stress biomarker. The MDA concentrations were evaluated using the Teb Pazhouhan Razi Kit. The MDA-thiobarbituric acid (TBA) interaction results in MDA-TBA compound. The amount of the resulting product was measured using a colorimetric method at 540 nm.
Evaluation of myeloperoxidase activity
Centrifuging the cardiac tissue homogenates produced the supernatant needed for the subsequent experimental detections. The MPO activity was evaluated using the Teb Pazhouhan Razi Kit. The colorimetric method was utilized and the absorbance was measured at 460 nm.
Evaluation of nitric oxide level
The nitrite concentration was determined and utilized as a gauge of nitric oxide (NO) generation. The method we applied is explained elsewhere. 17 The absorbance was measured at 543 nm.
Evaluation of glutathione peroxidase activity
The Teb Pazhouhan Razi Kit was purchased for the evaluation of the glutathione peroxidase (GPx) activity. The method has been explained elsewhere. 18 The absorbance was read using a spectrophotometer at 340 nm.
Evaluation of total antioxidant capacity
The total antioxidant capacity (TAC) was measured using the Teb Pazhouhan Razi Kit. The technique used for this purpose has been thoroughly explained elsewhere. 19 The absorbance was measured at 420 nm.
Histopathological analysis
The liver and kidney of each rat was removed and weighed individually. These tissue samples were embedded in paraffin blocks, cut into layers of five μm, and stained with hematoxylin and eosin after being fixated in 10% formalin solution and treated with a tissue processing system (dewatering, clearing, and staining) (H&E). On each slice, a mean of four sections were inserted. As a result, about 390 slices were examined using digital light microscopy. Each section was evaluated for hyperemia, necrosis, and vacuolar degeneration. All morphological analyses were carried out by a skilled user (Seyed Mohammad Hosseini) at magnifications of×4, ×10, and ×40.
Each Tissue was given a score of 0 to three for hyperemia (0 was none, and three was the maximum score). The vacuolar degeneration was assessed and scored as mild, moderate, and severe, as follows: (−) normal histology; (+) mild <25%; (++) moderate 25%–50%; (+++) severe >50% of the tissues affected.20,21 Eventually, the Kruskal-Wallis and Mann-Whitney U tests were performed for histopathological assessments (non-parametric).
Statistical analysis
All values were displayed as mean standard deviation (SD). To evaluate differences across study groups, a one-way ANOVA was employed, followed by post hoc Tukey testing. Additionally, the Kruskal-Wallis and Mann-Whitney U tests were performed for histopathological assessments (non-parametric). Statistical significance was defined as a probability level (p-value) of <0.05. Nonetheless, alternative p-values, such as p-value <.01, <0.001, and <0.0001, are supplied where appropriate. All the statistical analyses were performed using GraphPad Prism 9.
Results
Serologic parameters
AST, ALT, and ALP
Effect of capecitabine and melatonin administration on the serologic parameters of liver.

Values are expressed as mean ± standard deviation (SD). *, **, ***, and **** indicate statistically significant differences compared to the CAPE 500 group (p < .05, p < .01, p < .001, and p < .0001, respectively). #, and ## indicate statistically significant difference compared to the CAPE 500 + MEL five group (p < .05, and p < .01, respectively). AST, Aspartate aminotransferase; ALT, Alanine aminotransferase; ALP, alkaline phosphatase.
The CAPE 500 group exhibited the highest level of ALT, while the control group had the lowest ALT levels. The ALT levels in the CAPE 500 + MEL 10 and MEL 10 groups were significantly lower compared with the CAPE 500 group (p-value < .0001). However, there was no significant difference between the CAPE 500 + MEL five and CAPE 500 groups. The CAPE 500 + MEL five group had significantly higher ALT level than the CAPE 500 + MEL 10 and MEL 10 groups (p-value <.05). The difference between the MEL 10 and the CAPE 500 + MEL 10 groups was not statistically significant (Table 1).
The CAPE 500 group exhibited the highest level of ALP, while the control group had the lowest ALP levels. The ALP levels in the CAPE 500 + MEL 5 (p-value <.01), CAPE 500 + MEL 10 (p-value <.0001), and MEL 10 (p-value <.0001) groups were significantly lower compared with the CAPE 500 group. There was no significant difference among the CAPE 500 + MEL 5, CAPE 500 + MEL 10, and MEL 10 groups (Table 1).
Urea, Blood Urea Nitrogen and Creatinine
Effect of capecitabine and melatonin administration on the kidney serologic parameters.
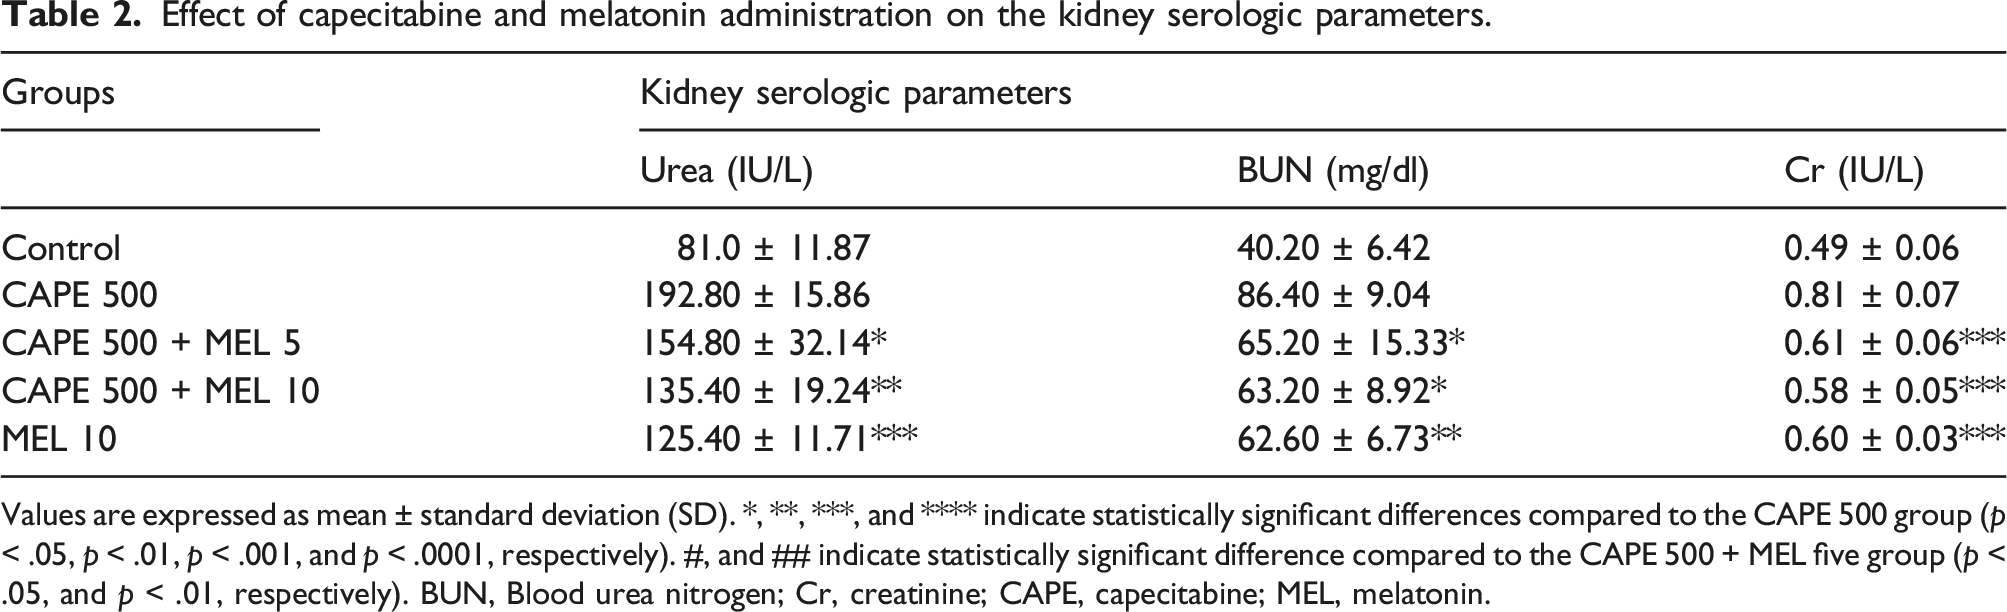
Values are expressed as mean ± standard deviation (SD). *, **, ***, and **** indicate statistically significant differences compared to the CAPE 500 group (p < .05, p < .01, p < .001, and p < .0001, respectively). #, and ## indicate statistically significant difference compared to the CAPE 500 + MEL five group (p < .05, and p < .01, respectively). BUN, Blood urea nitrogen; Cr, creatinine; CAPE, capecitabine; MEL, melatonin.
The CAPE 500 group exhibited the highest level of BUN, while the control group had the lowest BUN levels. The BUN levels in the CAPE 500 + MEL 5 (p-value <.05), CAPE 500 + MEL 10 (p-value <.05), and MEL 10 (p-value <.01) groups were significantly lower compared with the CAPE 500 group. The difference among the CAPE 500 + MEL 5, CAPE 500 + MEL 10, and MEL 10 groups was not statistically significant (Table 2).
The CAPE 500 group exhibited the highest level of Cr, while the control group had the lowest Cr levels. The Cr levels in the CAPE 500 + MEL 5, CAPE 500 + MEL 10, and MEL 10 groups were significantly lower compared with the CAPE 500 group (p-value <.001). The difference among the CAPE 500 + MEL 5, CAPE 500 + MEL 10, and MEL 10 groups was not statistically significant (Table 2).
Liver and kidney biochemical parameters
Malondialdehyde
In the liver MDA analysis, the CAPE 500 group exhibited the highest level of MDA, while the control group had the lowest MDA levels (p-value < .0001) (Figure 1(a)). The MDA levels in the CAPE 500 + MEL 5 (p-value <.01), CAPE 500 + MEL 10 (p-value <.0001), and MEL 10 (p-value <.0001) groups were significantly lower than the CAPE 500 group. The CAPE 500 + MEL 10 group was measured with a significantly lower MDA level compared to the CAPE 500 + MEL five group (p-value < .01). The MEL 10 group had also a significantly lower MDA level than the CAPE 500 + MEL five group (p-value < .0001). Effect of capecitabine and melatonin administration on the MDA (a), MPO (b), NO (c), GPx (d), and TAC (e) status of the liver. Values are expressed as mean ± standard deviation (SD). *, **, ***, and **** indicate p < .05, p < .01, p < .001, and p < .0001, respectively. #, ##, ###, and #### indicate p < .05, p < .01, p < .001, and p < .0001, respectively.
In the kidney MDA analysis, the CAPE 500 group exhibited the highest level of MDA, while the control group had the lowest MDA levels (p-value < .0001) (Figure 2(a)). The MDA levels in the CAPE 500 + MEL 5 (p-value <.001), CAPE 500 + MEL 10 (p-value <.0001), and MEL 10 (p-value <.0001) groups were significantly lower than the CAPE 500 group. The CAPE 500 + MEL 10 group was measured with a significantly lower MDA level compared to the CAPE 500 + MEL five group (p-value < .05). The MEL 10 group had also a significantly lower MDA level than the CAPE 500 + MEL five group (p-value < .01). Effect of capecitabine and melatonin administration on the MDA (a), MPO (b), NO (c), GPx (d), and TAC (e) status of the kidney. Values are expressed as mean ± standard deviation (SD). *, **, ***, and **** indicate p < .05, p < .01, p < .001, and p < .0001, respectively. #, ##, ###, and #### indicate p < .05, p < .01, p < .001, and p < .0001, respectively.
Myeloperoxidase
In the liver MPO analysis, the CAPE 500 group exhibited the highest level of MPO, while the control group had the lowest MPO levels (p-value < .0001) (Figure 1(b)). Although The CAPE 500 + MEL five group had a lower MPO level than the CAPE 500, the difference was not statistically significant. The MPO levels in the CAPE 500 + MEL 10 (p-value <.001) and MEL 10 (p-value <.0001) groups were significantly lower than the CAPE 500 group. The CAPE 500 + MEL 10 group was measured with a significantly lower MPO level compared to the CAPE 500 + MEL five group (p-value < .05). The MEL 10 group had also a significantly lower MPO level than the CAPE 500 + MEL five group (p-value < .001).
In the kidney MPO analysis, the CAPE 500 group exhibited the highest level of MPO, while the control group had the lowest MPO levels (p-value < .0001) (Figure 2(b)). Although The CAPE 500 + MEL five group had a lower MPO level than the CAPE 500, the difference was not statistically significant. The MPO levels in the CAPE 500 + MEL 10 (p-value <.001) and MEL 10 (p-value <.0001) groups were significantly lower than the CAPE 500 group. The CAPE 500 + MEL 10 group was measured with a significantly lower MPO level compared to the CAPE 500 + MEL five group (p-value < .05). The MEL 10 group had also a significantly lower MPO level than the CAPE 500 + MEL five group (p-value < .01).
Nitric oxide
In the liver NO analysis, the CAPE 500 group exhibited the highest level of NO, while the control group had the lowest NO levels (p-value < .0001) (Figure 1(c)). Although the CAPE 500 + MEL five and CAPE 500 + MEL 10 groups had lower NO levels than the CAPE 500, the difference was not statistically significant. The NO level in the MEL 10 group was significantly lower than the CAPE 500 group (p-value <.01). Although the CAPE 500 + MEL 10 group was measured with a lower NO level compared to the CAPE 500 + MEL five group, they had no significant difference. The MEL 10 group had a significantly lower NO level than the CAPE 500 + MEL five group (p-value < .05).
In the kidney NO analysis, the CAPE 500 group exhibited the highest level of NO, while the control group had the lowest NO levels (p-value < .0001) (Figure 2(c)). Although The CAPE 500 + MEL five group had a lower NO level than the CAPE 500, the difference was not statistically significant. The NO levels in the CAPE 500 + MEL 10 (p-value < .01) and MEL 10 (p-value < .0001) groups were significantly lower than the CAPE 500 group. Although the CAPE 500 + MEL 10 group was measured with a lower NO level compared to the CAPE 500 + MEL five group, they had no significant difference. The MEL 10 group had a significantly lower NO level than the CAPE 500 + MEL five group (p-value < .01).
Glutathione peroxidase
In the liver GPx analysis, the CAPE 500 group exhibited the lowest level of GPx, while the control group had the highest GPx levels (p-value < .0001) (Figure 1(d)). The GPx levels in the CAPE 500 + MEL 5 (p-value < .01), CAPE 500 + MEL 10 (p-value < .0001), and MEL 10 (p-value < .0001) groups were significantly higher than the CAPE 500 group. Although the CAPE 500 + MEL 10 group was measured with a higher GPx level compared to the CAPE 500 + MEL five group, they had no significant difference. The MEL 10 group had a significantly higher GPx level than the CAPE 500 + MEL five group (p-value < .01).
In the kidney GPx analysis, the CAPE 500 group exhibited the lowest level of GPx, while the control group had the highest GPx levels (p-value < .0001) (Figure 2(d)). Although The CAPE 500 + MEL five group had a higher GPx level than the CAPE 500, the difference was not statistically significant. The GPx levels in the CAPE 500 + MEL 10 (p-value < .05) and MEL 10 (p-value < .001) groups were significantly higher than the CAPE 500 group. Although the CAPE 500 + MEL 10 group was measured with a higher GPx level compared to the CAPE 500 + MEL five group, they had no significant difference. The MEL 10 group had a significantly higher GPx level than the CAPE 500 + MEL five group (p-value < .05).
Total antioxidant capacity
In the liver TAC analysis, the CAPE 500 group exhibited the lowest level of TAC, while the control group had the highest TAC levels (p-value < .0001) (Figure 1(e)). Although The CAPE 500 + MEL five group had a higher TAC level than the CAPE 500, the difference was not statistically significant. The TAC levels in the CAPE 500 + MEL 10 (p-value < .01) and MEL 10 (p-value < .0001) groups were significantly higher than the CAPE 500 group. Although the CAPE 500 + MEL 10 group was measured with a higher TAC level compared to the CAPE 500 + MEL five group, they had no significant difference. The MEL 10 group had a significantly higher TAC level than the CAPE 500 + MEL five group (p-value < .0001).
In the kidney TAC analysis, the CAPE 500 group exhibited the lowest level of TAC, while the control group had the highest TAC levels (p-value < .0001) (Figure 2(e)). The TAC levels in the CAPE 500 + MEL 5 (p-value < .001), CAPE 500 + MEL 10 (p-value < .0001), and MEL 10 (p-value < .0001) groups were significantly higher than the CAPE 500 group. The CAPE 500 + MEL 10 group was measured with a significantly higher TAC level compared to the CAPE 500 + MEL five group (p-value < .05). The MEL 10 group had also a significantly higher TAC level than the CAPE 500 + MEL five group (p-value < .0001).
The histopathological changes in liver and kidney tissues
Vacuolar degeneration and hyperemia were detected in the hepatic tissue samples. The only histopathologic change observed in the kidney tissue was hyperemia (Figures 3 and 4). In none of the sections necrosis was observed. Effect of capecitabine and melatonin administration on the histopathological changes of liver tissue samples. Normal conditions in the Control and MEL 10 groups. Note hyperemia (star) and vacuolar degeneration (leftward arrows) in the CAPE 500, CAPE 500 + MEL 5, and CAPE 500 + MEL 10 groups. Hematoxylin and Eosin (H&E) staining. ×400 magnifications. Scale bar 30 μm. Effect of capecitabine and melatonin administration on the histopathological changes of kidney tissue samples. Normal conditions in the Control and MEL 10 groups. Note hyperemia (star) in the CAPE 500, CAPE 500 + MEL 5, and CAPE 500 + MEL 10 groups. Hematoxylin and Eosin (H&E) staining. ×400 magnifications. Scale bar 30 μm.

Histopathological evaluation of liver and kidney following treatment with capecitabine, melatonin, and capecitabine + melatonin.
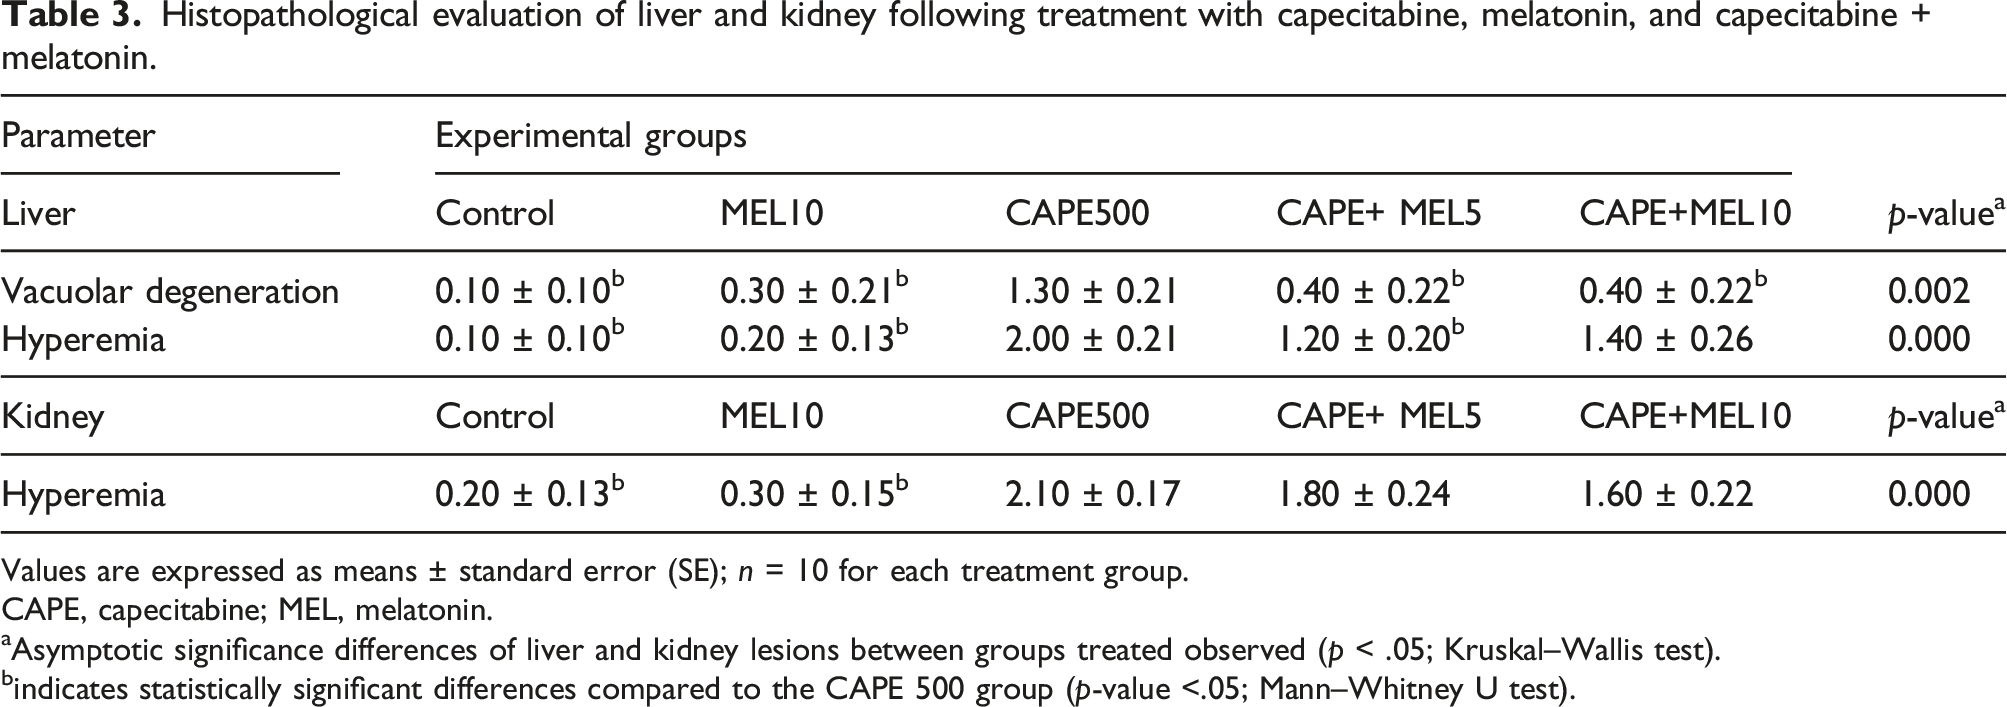
Values are expressed as means ± standard error (SE); n = 10 for each treatment group.
CAPE, capecitabine; MEL, melatonin.
aAsymptotic significance differences of liver and kidney lesions between groups treated observed (p < .05; Kruskal–Wallis test).
bindicates statistically significant differences compared to the CAPE 500 group (p-value <.05; Mann–Whitney U test).
Similarly, the CAPE 500 group exhibited the highest level of hyperemia, while the control group had the lowest level (p-value <.05). The CAPE 500 + MEL five and MEL 10 were significantly less hyperemic compared to the CAPE 500 (p-value < .05) (Table 3).
In the kidney, the CAPE 500 group exhibited the highest level of hyperemia, while the control group had the lowest level (p-value <.05). Although the CAPE 500 + MEL five and CAPE 500 + MEL 10 were less hyperemic than the CAPE 500 group, the difference was not statistically significant (Table 3).
Discussion
CAPE is a type of oral medication that falls under the category of fluoropyrimidine. Once ingested, it is rapidly absorbed by the intestines and broken down by hepatic carboxylesterase into 5’-deoxy-5-fluorocytidine (5’-DFCR). After this, cytidine deaminase in the tumor and liver cells converts 5’-DFCR into 5’-deoxy-5-fluorouridine (5’-DFUR). At last, thymidine phosphorylase, mainly expressed in tumor tissues, converts 5’-DFUR into 5-FU. 22 The majority of CAPE and its metabolite are eliminated through urine, with 95.5% being excreted this way. Within the first 24 h after taking the medication, 84% of the elimination occurs. 23 In light of limited data regarding the potential hepatotoxicity and renal toxicity of CAPE, we conducted an assessment of the protective impact of melatonin on this chemotherapeutic agent while also examining its potential for inducing hepatotoxicity and renal toxicity.
Transaminases, namely AST and ALT, are vital enzymes responsible for converting amino acids to keto acids. These enzymes are typically found in liver cells, with AST primarily located in the mitochondria and ALT in the cytoplasm. An increase in ALT levels is commonly associated with a rise in AST levels. 24 Hence, assessing the enzyme activity serves as an indicator of liver damage since the occurrence of necrosis or damage to the cell membranes results in the release of these enzymes into the bloodstream.25,26 Moreover, research has demonstrated that the presence of obstruction or inflammation in the biliary tract leads to an elevation in plasma ALP activity. 27 In this study, the administration of CAPE as a single treatment resulted in a significant elevation in liver serological markers, including AST, ALT, and ALP, when compared to the control group. These increases in serological markers indicate hepatotoxicity of CAPE through cellular damage or necrosis, changes in membrane permeability, and inflammation. Administration of MEL effectively mitigated the mentioned damages and resulted in the reduction of the enzymes. The study findings further indicated that a dosage of 10 mg/kg MEL was more efficacious in preventing the elevation of enzymes compared to a dosage of 5 mg/kg.
The underlying mechanism of renal toxicity induced by CAPE and its active metabolite 5-FU remains partially understood. Although a number of possible mechanisms have been proposed in previous studies to explain 5-FU-induced nephrotoxicity, no mechanism has been introduced for CAPE-induced nephrotoxicity. Researchers have suggested that 5-FU-induced nephrotoxicity may be caused by the generation of free radicals, resulting in lipid peroxidation, damage to cell membranes, and the induction of apoptosis. 28 Serum levels of urea, BUN, and Cr are considered the most indicative markers for assessing the proper function of the kidney.29,30 Consistent with prior research, our study results align with the evidence that, similar to 5-FU, CAPE-induced nephrotoxicity is characterized by elevated levels of urea, BUN, and Cr in the kidneys.28,31,32 According to our research, the use of MEL was successful in mitigating the mentioned damages and produced lower indicated indices. Additionally, our findings revealed that a 10 mg/kg dosage of MEL was superior in preventing an elevation of renal function markers when compared to a 5 mg/kg dosage.
Scientific evidence supports the role of oxidative stress in mediating the organ toxicities induced by 5-FU. The generation of reactive oxygen species (ROS) leads to the peroxidation of membrane lipids and subsequent oxidative injury in cells. The presence of cellular antioxidant enzymes and non-enzymatic defenses helps mitigate the tissue damage caused by oxidative stress. ROS contribute to cellular injury and necrosis in multiple tissues, including the liver and kidney.33–35
Malondialdehyde (MDA) is a quantifiable biomarker resulting from the decomposition of unsaturated fatty acids into free radicals. 36 An excessive synthesis of nitric NO contributes to oxidative damage by reacting with superoxide to generate peroxynitrite. 37 During our research, we discovered that administering CAPE resulted in a notable increase in MDA and NO levels in the liver and kidney tissues, when compared to the control group. This aligns with previous studies that have investigated the potential damage to the liver or kidneys caused by 5-FU.32,38,39 Furthermore, our study demonstrated that treatment with MEL effectively reduced MDA levels and provided a protective effect. Notably, the administration of a dosage of 10 mg/kg of MEL showed greater efficacy in preventing the increase in MDA compared to a dosage of 5 mg/kg. Notably, treatment with 10 mg/kg of MEL could significantly decrease NO level just in the kidney tissue. Although it could reduce NO level in the liver, this reduction was not significant.
MPO is an enzyme abundantly released by inflammatory cells such as neutrophils, macrophages, and microglia. It serves as a crucial marker for inflammation. 4 This study demonstrated that CAPE treatment was associated with increased levels of MPO in both liver and kidney tissues. Additionally, treatment with MEL effectively reduced MPO levels and provided a protective effect. We also showed that treatment with 10 mg/kg MEL exhibited superior antioxidant activity and significantly reduced MPO level compared to 5 mg/kg MEL.
The intracellular enzyme GPx plays a crucial role in breaking down hydrogen peroxides (H2O2) into water and converting lipid peroxides into their corresponding alcohols. This process primarily occurs in the mitochondria, but can also occur in the cytosol. Along with superoxide dismutase (SOD) and catalase (CAT), GPx are the first line defense antioxidants. 40 In the current study, CAPE significantly reduced the level of GPx and TAC in both liver and kidney tissues. These findings were aligned with the results of previous investigations. Suwannakot et al. (2021) studied the protective effect of MEL on 5-FU-induced damage to hippocampal neurogenesis. Similar to our findings, in their study, 5-FU could also decrease GPx level along with SOD and CAT. 41 They also demonstrated that MEL could significantly enhance the level of antioxidants, which supports our findings. However, they only used a single dosage of MEL at 8 mg/kg, while we examined the protective potential of MEL at two doses, 5 mg/kg and 10 mg/kg. Our results indicate that administering a dosage of 10 mg/kg of MEL is more effective in increasing the level of antioxidants and TAC than a dosage of 5 mg/kg.
The liver and kidney tissue samples were analyzed for histological changes, specifically necrosis, hyperemia, and vacuolar degeneration. In the study of Gelen et al. (2021), 5-FU treatment resulted in severe vacuolar degeneration, necrosis, and cystic dilatation in renal tubular structure. 28 Additionally, Pujari et al. (2021) observed that the administration of 5-FU led to hydropic degeneration of hepatocytes and focal necrosis in the central vein zone, accompanied by disruption of the hepatic central vein. In our study, no instances of necrosis were observed in any of the sections examined; additionally, the only alteration observed in the kidney was hyperemia. The CAPE group demonstrated the highest frequency of hyperemia and vacuolar degeneration (only in liver) in both the liver and kidney tissues.
Treatment with two doses of MEL significantly reduced the vacuolar degeneration observed in liver, to the point that the difference between the treatment groups and the control group was not significant. The administration of 5 mg/kg MEL resulted in a significant decrease in hyperemia in the liver compared with the CAPE-treated group. However, the administration of CAPE 500 + 10mg/kg MEL could not effectively reduce the hyperemia and it had no significant difference with the CAPE-treated group. In the context of kidney tissue, MEL treatment was found to have a minor impact on reducing hyperemia in comparison to the CAPE-treated group. Nevertheless, the decrease was not statistically significant. Aligned with our findings, in a previous study, it was found that MEL could reduce the Aluminum-induced liver damage, reducing inflammation and injury to liver cells. Furthermore, MEL treatment demonstrated a beneficial effect on the kidney structure, leading to the presence of Bowman's capsule with well-structured glomeruli. Notably, treatment with MEL alone could not induce any damage to the renal tissues of the rats. 11
The research findings have significant implications for cancer patients undergoing CAPE treatment. Firstly, the study sheds light on the potential hepatotoxic and nephrotoxic effects associated with CAPE, enabling healthcare providers to be aware of these risks and proactively monitor patients for any signs of liver or kidney dysfunction. Secondly, the investigation of MEL's protective effects offers a promising avenue for mitigating the toxic impact of CAPE on the liver and kidneys. By utilizing MEL as an adjunct therapy, healthcare professionals could potentially reduce the likelihood of adverse effects and improve the overall safety and tolerability of CAPE treatment in cancer patients. Nevertheless, to establish the validity of these results, additional investigations at both the preclinical and clinical levels are imperative.
This study had some limitations. Firstly, our study relied solely on an animal model, which may not fully capture the complexities and variations observed in human physiology and response to medication. While animal models provide valuable initial insights, caution must be exercised in extrapolating these findings directly to humans. Furthermore, financial constraints posed limitations on our study, preventing us from investigating the impact of CAPE and MEL on inflammatory and anti-inflammatory cytokines. This omission hinders our ability to comprehensively understand the complete mechanism of action underlying the protective effects of MEL in hepatotoxicity and nephrotoxicity. Moving forward, future research endeavors could focus on addressing these limitations. It would be beneficial to conduct clinical trials involving human subjects to validate the findings obtained from animal models. Additionally, securing adequate funding for the investigation of inflammatory and anti-inflammatory cytokines could provide crucial insights into the precise pathways through which MEL exerts its protective effects. Exploring dosing regimens, optimal timing of MEL administration, and potential drug interactions are also potential areas for future investigation.
Conclusion
Our study highlights the potential harmful effects of capecitabine on the liver and kidney, emphasizing the need for further research to confirm and build upon these findings. Additionally, we discovered that melatonin administration plays a significant role in reducing the toxic impact of chemotherapeutic drugs like capecitabine by boosting antioxidant defenses and scavenging free radicals. These findings hold great importance in the field of chemotherapy-induced organ toxicity, presenting new opportunities for interventions to improve patient outcomes and minimize drug-related side effects. However, our study still has gaps that need to be addressed, including the need for human clinical trials and a deeper understanding of how melatonin works on a mechanistic level. Future research should focus on filling these gaps, solidifying the potential of melatonin for prevention, and exploring optimal treatment strategies and potential synergies with other therapies. By addressing these research gaps, we can work toward the development of safer and more effective treatment approaches for patients undergoing capecitabine or similar chemotherapy treatments.
Footnotes
Acknowledgments
We thank Sama Torkashvand and Bardia Karim helpful suggestions.
Author contributions
Declaration of Conflicting Interests
The author(s) declared no potential conflicts of interest with respect to the research, authorship, and/or publication of this article.
Funding
The author(s) received no financial support for the research, authorship, and/or publication of this article.