
Abstract
Introduction
Tanshinone I (Tan I) is one of the bioactive components of Salvia miltiorrhiza. Whether it inhibits gastric cancer through ferroptosis has not been reported. This study aimed to confirm the effect of Tan I on ferroptosis in gastric cancer cells.
Methods
AGS and HGC27 cells were treated with Tan I. First, oxidative stress-related parameters and the expression of ferroptosis-related proteins were examined. Combined with a ferroptosis inhibitor, Tan I was found to inhibit gastric cancer cells via the ferroptosis pathway. Finally, with bioinformatics analysis, the target protein of Tan I was identified.
Results
Tan I significantly inhibited the expression level of GPX4. This molecule also increased ROS, MDA, and Fe2+ contents and decreased GSH enzyme activity. Therefore, we hypothesized that Tan I may inhibit gastric cancer cells by inducing ferroptosis. Western blotting results showed that Tan I inhibited the expression levels of the ferroptosis resistance-related proteins GPX4, SLC7A11, and FTH1, while the pro-ferroptosis-related proteins TFR1 and ACSL4 were significantly upregulated. A ferroptosis inhibitor effectively reversed these regulatory effects of Tan I in gastric cancer. With these data combined with the bioinformatics analysis, KDM4D was identified as a key regulatory target of Tan I. Mechanistically, Tan I induced positive regulation of ferroptosis resistance-related indicators by inhibiting KDM4D to upregulate p53 protein expression. Overexpression of KDM4D significantly reversed the effect of Tan I-induced ferroptosis resistance in gastric cancer cells.
Conclusions
Tan I induced ferroptosis inhibition in gastric cancer by regulating the KDM4D/p53 pathway.
Introduction
Gastric cancer (GC) is one of the most common malignancies globally, ranking fifth in incidence (1,089,103 cases) and fourth in mortality (768,793 cases) worldwide in 2020. 1 In addition, GC has the highest incidence among malignant tumors of the digestive system in China. 2 Currently, the primary treatments for gastric cancer in China include chemotherapy, targeted therapy, and immune checkpoint inhibitors. In terms of targeted therapy, although extensive research has been conducted on its application in gastric cancer, only a few targeted drugs have been approved for clinical application, namely anti-HER2 drugs such as trastuzumab and antiangiogenic pathway drugs such as apatinib. In terms of immunotherapy, despite breakthroughs in the research of PD-1 antibodies, the results of single-agent immunotherapy are not satisfactory. 3 Therefore, further exploration of gastric cancer treatment is needed, and more new treatment methods and drugs are worth exploring and validating.
Ferroptosis is a regulated type of necrosis, unlike apoptosis or necroptosis. Ferroptosis occurs in cells following iron-dependent lipid peroxidation, a process inhibited by glutathione peroxidase 4 (GPX4) and ferritin chain heavy 1 (FTH1).4,5 Ferroptosis is closely associated with p53 (gene name: TP53)-mediated activity. p53 can be recruited to the SLC7A11 promoter region to block the transcription of SLC7A11, which encodes the cystine-glutamate countertransport protein xCT. xCT transports extracellular cystine into the cell and then reduces cystine to cysteine for glutathione (GSH) synthesis. p53 induces ROS-mediated ferroptosis through a reduction in GSH production caused by xCT downregulation. 6 In the study of gastric cancer, it has been confirmed that the induction of ferroptosis can effectively reduce the drug resistance and proliferative activity of gastric cancer cells.5,7 Some drugs, such as Tan IIA, 8 andrographolide, 9 and levobupivacaine, 10 have good gastric cancer inhibitory effects by inducing ferroptosis. Therefore, the development of drugs targeting the induction of ferroptosis in gastric cancer cells will have clinical value and provide more options for treating gastric cancer.
Salvia miltiorrhiza is a medicinal plant traditionally used to treat cardiovascular diseases. 11 Tanshinone IIA (Tan IIA), one of the bioactive components of S. miltiorrhiza, has been proven to promote the apoptosis of gastric cancer cells 12 and inhibit precancerous angiogenesis. 13 Tan IIA could induce gastric cancer cells to undergo ferroptosis through p53-mediated SLC7A11 8 and inhibit the stemness of gastric cancer cells partly through inducing ferroptosis. 14 Tan I is another active extract of S. miltiorrhiza and has been reported to have antioxidant, anti-inflammatory, and anticancer properties. 15 Tan I exhibits anticancer activity in various types of cancers. For instance, it can induce apoptosis and autophagy in ovarian cancer cells, inhibiting proliferation, metastasis, and chemotherapy resistance in cervical cancer.16–18 Additionally, Tan-I significantly suppresses the proliferation and clonogenicity of lung cancer cells and enhances radiotherapy tolerance. 19 Studies have also demonstrated that Tan-I induces apoptosis in colon cancer cells and inhibits the proliferation of breast cancer.20–22 Importantly, Tan I has been shown to potentially induce apoptosis in gastric cancer cells. 23 Tan I and Tan IIA are structurally similar and have potential anticancer properties. 24 However, the relationship between Tan I and ferroptosis has not been reported.
Therefore, to determine the anticancer activity of Tan I in gastric cancer, especially its potential impact on ferroptosis, this study will demonstrate the anticancer effect of Tan I in combination with AGS and HGC27 gastric cancer cells and further explain the mechanism by which Tan I induces ferroptosis in gastric cancer cells from a molecular perspective.
Materials and methods
Cell culture
The human gastric cancer cell lines AGS and HGC27 were purchased from Zhejiang Ruyao Biotechnology Co., Ltd (Ningbo, China). The AGS cells were cultured in RPMI-1640 (containing 10% fetal bovine serum, 1% L-glutamine, and 1% penicillin/streptomycin), and the HGC27 cells were cultured in RPMI-1640 (containing 20% fetal bovine serum 1% L-glutamine, and 1% penicillin/streptomycin). The cells were placed in a constant temperature incubator with 5% CO2 at 37°C.
Cell viability determination
Gastric cancer cell viability was assayed using Cell Counting Kit 8 (CCK-8) assays (CK04, Dojindo, Japan). The gastric cancer cell lines AGS and HGC27 were inoculated in 96-well plates at a density of 3000 cells per well. After 24 h of adhesion, the cells were treated with 0, 0.33, 0.67, 1, 3, 9, and 27 μM Tan I (T819956, purity = 97%, Cas no. 568-73-0, formula: C18H12O3, Macklin Reagent, Shanghai, China) or an equal volume of DMSO for 48 h. After removal of the medium, 100 μL of a 10% CCK-8 solution was added to each well and incubated at 37°C for 2 h. The absorbance was measured at 450 nm using a microplate reader (Thermo Fisher Scientific, Vantaa, Finland). In addition, gastric cancer cells were treated with 0, 1, 3, and 9 μM Tan I, and the OD 450 nm values were measured at 24, 48, and 72 h of coincubation. The specific experiments were performed as described above. The morphological changes in each group of cells were also observed at 48 h using phase contrast microscopy.
EdU analysis
Gastric cancer cells were treated with 0, 1, 3, and 9 μM Tan I for 48 h. The EdU proliferation assay was performed by referring to the instructions of the BeyoClick™ EdU-647 Cell Proliferation Assay Kit (C0081S, Beyotime, China). After obtaining the image results using a Leica fluorescence microscope, the number of positive cells was counted by Image-Pro Plus 6.0, and the positivity rate was subsequently calculated.
LDH detection
Gastric cancer cells were treated with 0, 1, 3, and 9 μM Tan I for 48 h. The LDH content in the cell supernatant was measured by referring to the instructions of the lactate dehydrogenase assay kit (LDH, C0016, Beyotime). The absorbance values at 495 nm were measured using a microplate reader.
Immunofluorescence staining
Cells were seeded into a 6-well plate preloaded with coverslips. Then, the cells were incubated in 0.5% Triton X-100 for 10 min and sealed with 1% BSA for 30 min. Then, the sections were incubated with rabbit anti-human GPX4, cleaved caspase-3, and LC3A/B antibodies overnight at 4°C. The next day, the cells were incubated with FITC-labelled goat anti-rabbit secondary antibody in the dark for 1 h. Cells were incubated with 1 μg/mL DAPI for 10 min. Images were taken under a fluorescence microscope (DM500, Leica, Germany). IPP6.0 was used to quantify the results.
Western blot analysis
Gastric cancer cells from different treatments were collected and washed three times with PBS and then lysed with RIPA lysis buffer containing a 1% protease inhibitor mixture on ice for 30 min. After centrifugation at 13,000 rpm for 20 min, the supernatant was collected. The protein concentration of each sample was measured using the BCA assay kit. Thirty micrograms of denatured protein was electrophoresed on 12% SDS-PAGE gels and transferred to PVDF membranes (Millipore, USA). After being blocked with 5% skim milk for 1 h at room temperature, the membranes were mixed with primary antibodies [cleaved caspase-3 (ab32042), GPX4 (ab125066), LC3A/B (ab128025), ACSL4 (ab155282), FTH1 (ab75972), SLC7A11 (ab238969), TFR1 (ab214039), KDM4D (ab289667), p53 (ab32389) and GAPDH (ab181602), all of the above antibodies were purchased from Abcam Biologicals, UK], incubated overnight at 4°C and incubated with goat anti-rabbit IgG-HRP secondary antibody [ab6721, Abcam] for 2 h at room temperature. Protein strips were developed and photographed by exposure using a chemiluminescence substrate kit (WB012, Shenger, China) and a UVP imager (ChemiDoc-It Imaging System, USA). The optical density values of each strip were quantified by ImageJ software.
ROS detection
Intracellular ROS levels were detected by flow cytometry. Gastric cancer cells were treated with 0, 1, 3, and 9 μM Tan I for 48 h, digested with trypsin, and collected in 1.5 mL test tubes (cells in the culture medium supernatant were also collected). The cell suspension was centrifuged at 2000 r/pm for 5 min, the supernatant was discarded, and the remaining cell mass was resuspended in medium containing 5 μM DCFH-DA and incubated for 30 min in the dark. Finally, the cells were resuspended in 500 μL of PBS. ROS levels in the cell suspensions were then detected by flow cytometry (Attune NxT, Life). Data acquisition and analysis were performed by using FlowJo software (BD Biosciences, San Jose, CA, USA).
Detection of oxidative stress indicators
Gastric cancer cells were inoculated in 96-well plates at a density of 2 × 10⁴ cells/well, and the cells were treated with 0, 1, 3, and 9 μM Tan I or an equal volume of DMSO for 48 h. The levels of malondialdehyde (MDA) and glutathione (GSH) release in the supernatant were analysed using the corresponding kits (both from Nanjing Jiancheng Institute of Biological Engineering) according to the manufacturer’s instructions. Samples from each group were quantified using a microplate reader (Bio-Rad).
Iron ion level detection
The iron ion content in cells was measured using the Iron Colorimetric Assay Kit (BioVision, Inc. #K390-100) according to the reagent instructions. Subsequently, absorbance was measured at 593 nm using a microplate reader. Twenty-four-well plates of cells were stained with iron orange (cat no. MX4559, MKbio, China) at a final concentration of 10 μM and incubated for 30 min at 37°C. After three washes, intracellular FerroOrange fluorescence imaging was captured under a fluorescence microscope. 25
The effect of Fer-1 on Tan I-induced ferroptosis
AGS and HGC27 cells were divided into the following groups: 1. control group; 2. Tan I group, gastric cancer cells were treated with 3 μM Tan I for 48 h; 3. Tan I + Fer-1 group, gastric cancer cells were treated with 3 μM Tan I and 1 μM ferrostatin-1 (Fer-1, ferroptosis inhibitor, 347174-05-4, purchased from MedChemEepress) for 48 h. Then CCK-8 assays were used to detect the cell proliferation activity. The content of LDH, MDA, GSH, and Fe2+ contents were detected with a kit. The protein expression of GPX4, SLC7A11, and ACSL4 in each group was verified by immunofluorescence. Furthermore, the expression levels of the ferroptosis-related pathway proteins GPX4, SLC7A11, ACSL4, FTH1 and TFR1 were verified by western blotting, and GAPDH was used as the internal reference protein for normalization.
Prediction of the main targets of Tan I
The ferroptosis-related gene database was obtained from GeneCard. The "SMILE" of Tan I was then obtained from PubChem and combined with those obtained from the MolTarPred (http://moltarpred.marseille.inserm.fr/), swisstarget (http://swisstargetprediction.ch/), and SEA (https://sea.bkslab.org/) online sites for target prediction of Tan I. Proteins closely associated with ferroptosis were screened from the results of the above databases for subsequent validation. The 3D structure of the target protein was downloaded from the RCSB protein database (http://www.rcsb.org/) to obtain the protein (KDM4D, PDB ID: 7DYG) used for docking. Molecular docking studies were performed using AutoDock Vina 1.1.2, and docking models were visualized using PyMOL.
The prognostic level of KDM4D in gastric cancer was analysed by Kaplan-Meier plotter (http://kmplot.com/analysis/), and the differential gene expression level of KDM4D in gastric adenocarcinoma was obtained by combining with GEPIA (http://gepia.cancer-pku.cn/). Finally, the predicted outcome of KDM4D/p53 pathway protein regulatory levels was tentatively validated in combination with western blotting.
qPCR detection
After total RNA extraction from cells using the TRIzol method, mRNA was transcribed into cDNA using the 1st Strand cDNA Synthesis Kit (E042, Novoprotein, China). qPCR was performed using a SYBR qPCR SuperMix Plus (E096, Novoprotein) kit to construct the system, and the program was run in a 7500 Fast Real-Time PCR System (Applied Biosystems; Thermo Fisher Scientific, US) under the following conditions: denaturation at 95°C for 2 min; denaturation at 95°C for 10 s, and annealing at 60°C for 10 s, 40 cycles in total, followed by extension at 72°C for 30 s. The 2−ΔΔCt method 26 was used to calculate the relative expression amount of the target gene. The amplification primer was designed through the NCBI online website, and the sequence was as follows: KDM4D Forward: 5ʹ- CCT GAA CGC TAT GAC CTG TGG A -3ʹ, KDM4D Reverse: 5ʹ- TCT CCT GGG TAA CTG GAC TTC C -3ʹ; SLC7A11 Forward: 5ʹ- TCC TGC TTT GGC TCC ATG AAC G-3ʹ, SLC7A11 Reverse: 5ʹ- AGA GGA GTG TGC TTG CGG ACA T -3ʹ; GAPDH Forward: 5ʹ- GTC TCC TCT GAC TTC AAC AGC G-3ʹ, GAPDH Reverse: 5ʹ- ACC ACC CTG TTG CTG TAG CCA A -3ʹ.
Construction of KDM4D-overexpressing cells
The KDM4D CDS was obtained from NCBI. The CDS was amplified by the high-fidelity enzyme KOD. The pCDH plasmid was utilized to construct the overexpression vector. XbaI and BamHI were used as restriction endonucleases to double digest the plasmid and KDM4D amplification product, and then, T4 DNA ligase was used for the connection. The recombinant plasmid pCDH-KDM4D expressing the KDM4D gene was confirmed by gene sequencing.
For KDM4D CDS amplification primer: XbaI-Forward: 5ʹ-GCT CTA GAA TGG AAA CTA TGA AGT CTA AGG C-3ʹ; BamHI-Forward: 5ʹ- CGG GAT CCG GGC ACA GGG GCC CAG CTG CA-3ʹ. Then, gastric cancer cells were inoculated into 6-well plates with AGS and HGC27 cells at a density of 1 × 10⁶ cells/well and cultured at 37°C. When the cell confluence was 60%-70%, 5 μg of pCDH-KDM4D plasmid was transfected into gastric cancer cells using Lipofectamine 2000. The transfection efficiency was detected by protein blotting and qPCR after 48 h of transfection.
Study on the effect of KDM4D on the biological function of gastric cancer cells
AGS and HGC27 cells were grouped as follows: 1. Control group; 2. KDM4D group, gastric cancer cells transfected with the pCDH-KDM4D plasmid; 3. Tan I group, wild-type gastric cancer cells were treated with 3 μM Tan I for 48 h; 4. KDM4D + Tan I group, gastric cancer cells overexpressing KDM4D were treated with 3 μM Tan I for 48 h. The CCK-8 assay was performed on each group of cells to detect changes in cell proliferative activity. LDH, MDA, GSH, and Fe2+ levels were measured by kits. The expression levels of the KDM4D/p53 pathway and ferroptosis-related pathway proteins GPX4, SLC7A11, ACSL4, FTH1, and TFR1 were further verified by western blotting and normalized by using GAPDH as the internal reference protein.
Statistical analysis
All data from the current study are presented as the mean ± standard deviation based on three independent samples. All results were calculated using GraphPad Prism Software (Version 8.0.2, GraphPad Software, Inc.). Student’s t-test was used for two-group comparisons. One-way ANOVA was used for differences among three or more groups. p < .05 was considered to indicate a statistically significant difference.
Results
Effect of Tan I on biological functions such as the activity and proliferation of gastric cancer cells
First, the study confirmed that 1, 3, 9 and 27 μM Tan I had a highly significant inhibitory effect on the cellular activity of AGS and HGC27 cells. The difference was statistically significant in comparison with the 0 μM group (p < .01, Figure 1(a)). The half maximal inhibitory concentration (IC50) of Tan I on AGS and HGC27 cells was 8.60 and 1.82 μM at 48 h, respectively. Moreover, CCK-8 assays confirmed that the inhibitory effect of 1, 3, and 9 μM Tan I on the activity of gastric cancer cells was time-dependent. The activity of gastric cancer cells was significantly inhibited at 48 h of 1, 3, and 9 μM Tan I treatment (p < .05 compared with the 0 μM group at each time point, Figure 1(b)–(c)). Therefore, we used 1, 3, and 9 μM Tan I for 48 h as the treatment conditions for the subsequent experiments. As observed by phase contrast microscopy (Figure 1(d)), the gastric cancer cells shrank, and the density of the cell distribution decreased after Tan I treatment. EdU experiments demonstrated that 1, 3, and 9 μM Tan I significantly reduced the proportion of AGS and HGC27 cells in a proliferative state (p < .05, Figure 1(e)–(f)). The LDH assay further confirmed that 1, 3, and 9 μM Tan I significantly increased the level of LDH in the cell culture supernatant in a dose-dependent manner (p < .05, Figure 1(g)). Inhibitory activity of Tan I on the proliferation of gastric cancer cells (a) CCK-8 assays detect the activity levels of AGS and HGC27 gastric cancer cells under different doses of Tan I treatment; (b), (c) CCK-8 assayed the cell activity changes of AGS and HGC27 cells under 0, 1, 3, and 9 μM Tan I treatment conditions at 24, 48, and 72 h, and the results were compared with those of the 0 μM Tan I group at each time period for statistical analysis; (d) Cell morphological changes were observed under phase contrast microscopy; (e) EdU detected the cell proliferation level; (f) Statistical results of the positive rate in the EdU assay; (g) Detection of the LDH level in cell culture medium. **p < .01, *p < .05, statistically significant differences in AGS cells compared with the 0 μM Tan I group; ##p < .01, #p < .05, statistically significant differences in HGC27 cells compared with the 0 μM Tan I group. Scale bar = 25 μm.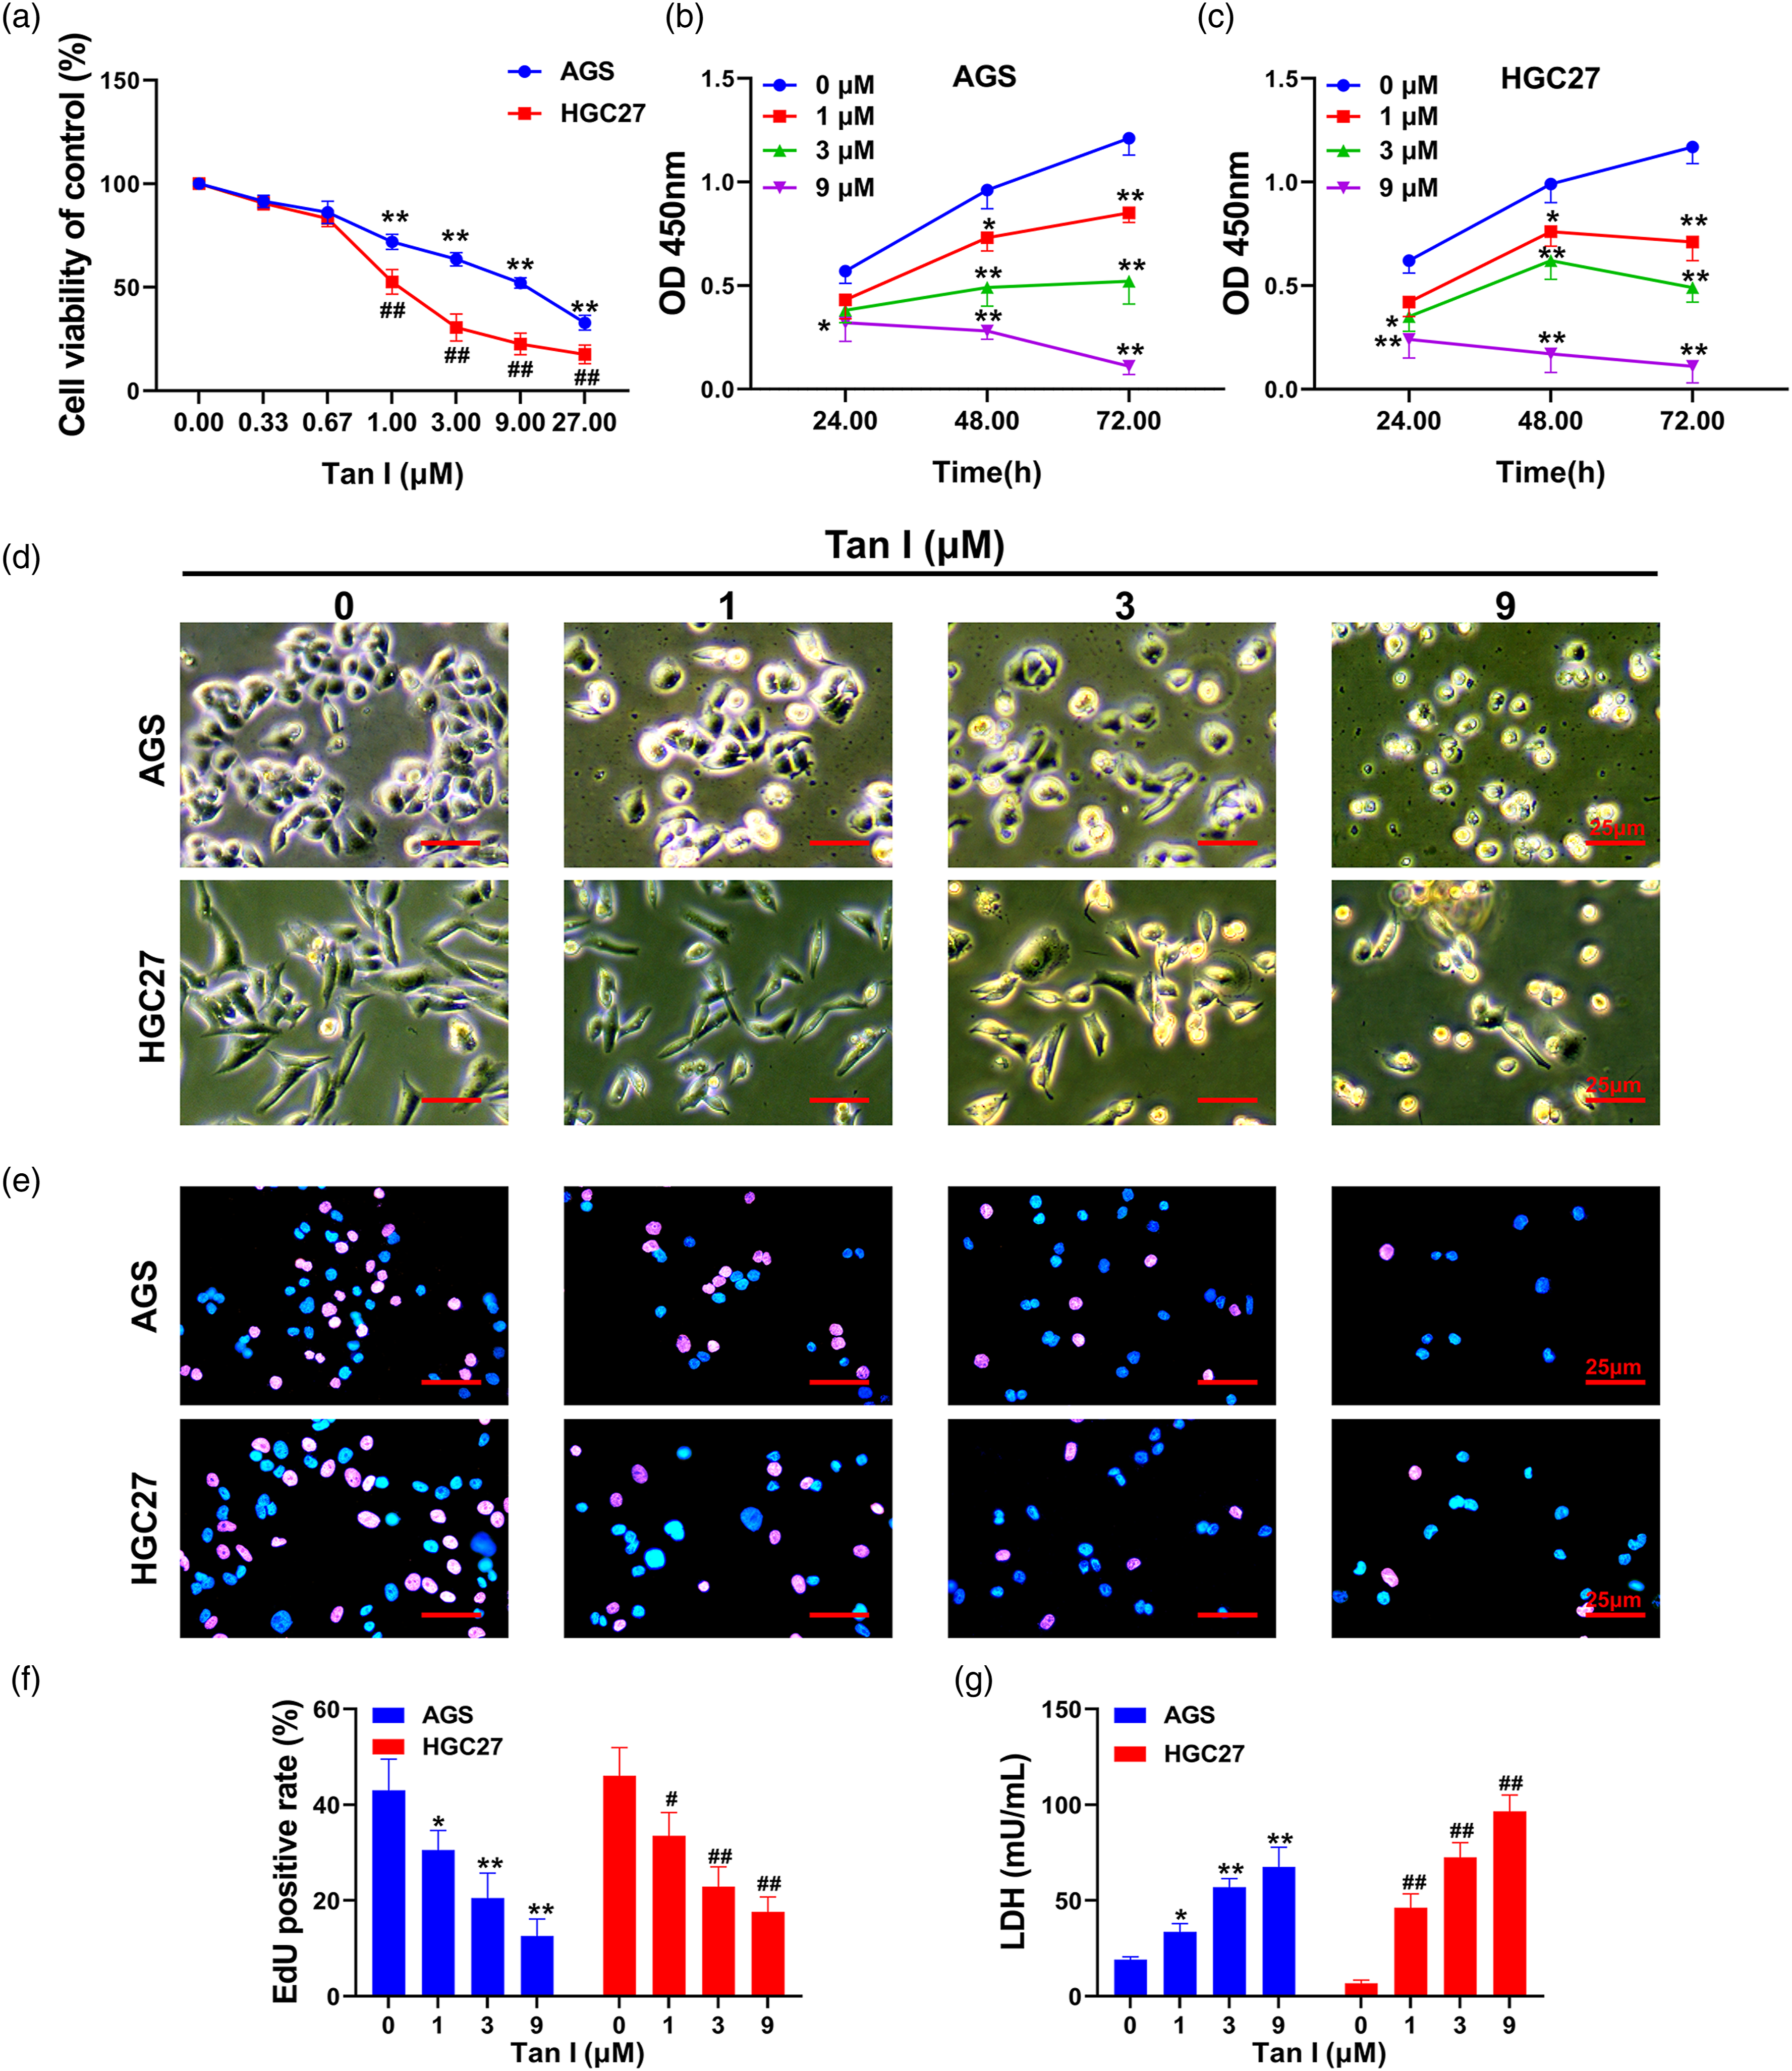
Study on the effect of Tan I on the cell death of gastric cancer cells
To investigate the mechanism by which Tan I regulates cell death in gastric cancer cells, this study first demonstrated by immunofluorescence that 9 μM Tan I inhibited the apoptosis-related protein cleaved caspase3 in HGC27 cells (p < .05 compared to the 0 μM group) but did not have a significant effect on AGS cells (p > .05, Figure 2(a)–(b)). Treatment with 3 and 9 μM Tan I resulted in significant inhibition of the apoptosis-related protein GPX4 in gastric cancer cells compared to that of the 0 μM group (p < .01, Figure 2(c)–(d)). This treatment showed a significant inhibitory effect on GPX4, a protein related to ferroptosis in gastric cancer cells, compared to that of the 0 μM group (p < .01, Figure 2(c)–(d)). No induction of the autophagy-associated protein LC3A/B was found with Tan I (Figure 2(e)–(f)). As further confirmed by western blotting (Figure 2(g)–(j)), compared with the 0 μM group, 1, 3, and 9 μM Tan I treatment of gastric cancer cells resulted in significant downregulation of GPX4 protein expression (p < .05). In contrast, no significant upregulation of cleaved caspase-3 and LC3A/B protein was observed (p > .05). Study of the specific mechanism by which Tan I induces cell death in gastric cancer cells (a-b) Immunofluorescence detection of cells cleaved caspase3 in cells quantified by IPP6.0; (c-d) Immunofluorescence detection of GPX4 in cells quantified by IPP6.0; (e-f) Immunofluorescence detection of LC3A/B in cells quantified by IPP6.0; (g) Western blotting detection of cleaved caspase3, GPX4, and LC3A/B protein expression levels; (h-j) Western blotting for strip optical density values quantified by ImageJ. **p < .01, *p < .05, statistically significant differences in AGS cells compared with the 0 μM Tan I group; ##p < .01, #p < .05, statistically significant differences in HGC27 cells compared with the 0 μM Tan I group. Scale bar = 25 μm.
Tan I induces ferroptosis in gastric cancer cells
To further confirm the results of the above experiments, we focused on detecting indicators related to ferroptosis in this section. The results showed that 1, 3 and 9 μM Tan I could significantly increase the ROS accumulation level in gastric cancer cells, i.e., the intensity of the DCFH-Da fluorescence probe was significantly increased (p < .01 compared with the 0 μM group). The biochemical index results showed that 1, 3, and 9 μM Tan I could increase the MDA content (Figure 3(c)), decrease the GSH level (Figure 3(d)), and increase the intracellular Fe2+ content (Figure 3(e)) in gastric cancer cells compared with those of the 0 μM group. Western blotting experiments showed (Figure 3(f)–(j)) that Tan I upregulated the expression of the pro-ferroptosis-related proteins ACSL4 and TFR1 while inhibiting the expression levels of the ferroptosis resistance-related proteins SLC7A11 and FTH1 (p < .05). Tan I induces ferroptosis in gastric cancer cells (a) Flow cytometry to detect DCFH-Da probe intensity; (b) FlowJo to quantify the results of flow cytometry; (c)-(e) Biochemistry to detect intracellular MDA, GSH, and Fe2+ levels; (f) Western blotting to detect the expression levels of ACSL4, SLC7A11, FTH1, and TFR1 proteins in each group; (g)-(j) Western blotting to quantify the optical density values of bands; **p < .01, *p < .05, statistically significant differences in AGS cells compared with the 0 μM Tan I group; ##p < .01, #p < .05, statistically significant differences in HGC27 cells compared with the 0 μM Tan I group. Scale bar = 25 μm.
Fer-1 reverses Tan I-induced ferroptosis in gastric cancer cells
In this part of the study, Fer-1, an inhibitor of ferroptosis, was introduced for a reactive study to demonstrate that inhibition of ferroptosis could weaken the damaging effect of Tan I on gastric cancer. First, this study showed that Fer-1 could significantly increase the activity of gastric cancer cells by CCK-8 assay, and the difference was statistically significant in comparison with the Tan I group (p < .01, Figure 4(a)). In addition, Fer-1 coincubation with cells significantly inhibited LDH, MDA and Fe2+ levels and increased GSH enzyme activity unit levels, with statistically significant differences compared with the Tan I group (p < .01, Figure 4(b)–(e)). Fer-1 reduced the level of ferrous ion deposition in the cytoplasm. Immunofluorescence experiments and quantification results showed (Figure 4(g)–(l)) that Fer-1 could significantly reverse the inhibition of GPX4 and SLC7A11 protein and the upregulation of ACSL4 protein expression by 3 μM Tan I. Further protein expression verification by western blotting (Figure 5) showed that Fer-1 significantly reversed the downregulation of GPX4, SLC7A11, and FTH1 and the upregulation of ACSL4 and TFR1 in gastric cancer cells after Tan I treatment, and the difference between the two groups was statistically significant (p < .05). Fer-1 reverses Tan I-induced ferroptosis in gastric cancer cells (a) CCK-8 assay for cell activity; (b)-(e) Biochemistry for LDH, MDA, GSH and Fe2+ levels; (f) FerroOrange staining; (g)-(i) Immunofluorescence for GPX4, SLC7A11 and ACSL4 protein expression and distribution; (j-l) Immunofluorescence for quantitative statistics. **p < .01, *p < .05. Quantification of optical density values of bands; **p < .01, *p < .05, statistically significant differences when comparing cells in the same control group; ##p < .01, #p < .05, statistically significant differences when comparing two groups of linked lines. Scale bar = 25 μm. Western blotting for GPX4, ACSL4, SLC7A11, FTH1, and TFR1 protein expression levels. **p < .01, *p < .05, statistically significant differences when comparing cells in the same control group; ##p < .01, #p < .05, statistically significant differences when comparing two groups of linked lines.

Effect of Tan I on the regulation of KDM4D during induction of ferroptosis in gastric cancer cells
To clarify the mechanism of Tan I-mediated ferroptosis development in gastric cancer cells, this study combined database information to screen Tan I’s targets. Among the key targets, KDM4D had the highest molecular docking energy (binding energy = − 9.8 kcal/mol, Figure 6(a)). In the prognostic analysis of KDM4D and gastric cancer, high expression of KDM4D was related to a poor prognosis, with a highly significant difference in survival rate compared with the patients with low KDM4D expression (p = 3.4 × 10⁻⁵) (Figure 6(b)). Furthermore, patients with gastric cancer usually exhibited high KDM4D gene levels in cancerous tissues (compared to paraneoplastic tissues, Figure 6(c)). The western blotting results showed (Figure 6(d)–(f)) that Tan I could significantly inhibit the KDM4D protein expression level in AGS and HGC27 cells and upregulate the expression of KDM4D-conjugated repressor protein p53 (p < .01 compared with the control group). Compared with the Tan I treatment group, Fer-1 did not show significant regulation of KDM4D (p > .05) but significantly downregulated the expression level of p53 protein (p < .05). Tan I key target screening (a) PyMOL software to visualize Tan I docking with KDM4D protein; (b) Prognostic relationship between the KDM4D gene and gastric cancer; (c) GEPIA database, differential expression levels of the KDM4D gene in gastric adenocarcinoma and paraneoplasia; (d) Western blotting to detect the expression levels of KDM4D and the downstream protein p53; (e)-(f) Western blotting to detect protein band optical density values for quantitative statistical results; (g) qPCR to detect the KDM4D gene expression level; **p < .01, the difference was statistically significant when cells in the same control group were compared; ##p < .01, #p < .05, the difference was statistically significant when the two linked groups were compared.
Overexpression of KDM4D impairs Tan I-induced ferroptosis in gastric cancer cells
To verify that Tan I is induced by downregulating KDM4D protein expression in gastric cancer cell ferroptosis, we generated KDM4D-overexpression cell constructs in this part of the study. qPCR (Figure 7(a)) and western blotting (Figure 7(b)–(c)) showed that both the KDM4D gene and protein levels were significantly increased after cotransfection of AGS and HGC27 cells with plasmids overexpressing the KDM4D gene (p < .01 compared with the control group of each cell). The CCK-8 assay (Figure 7(d)) showed that overexpression of KDM4D significantly increased the activity of gastric cancer cells, and the difference between the KDM4D + Tan I group and the Tan I group was statistically significant (p < .01). In addition, overexpression of KDM4D significantly reversed the effect of Tan I on serum LDH (Figure 7(e)) and intracellular Fe2+ (Figure 7(f)) levels in gastric cancer cell culture medium. The western blotting results showed (Figure 7(g)–(n)) that overexpression of KDM4D in AGS and HGC27 gastric cancer cells reversed the upregulation of the p53, ACSL4 and TFR1 proteins by Tan I and reversed the inhibitory effects of Tan I on KDM4D, GPX4 and SLC7A11 levels compared with those of the Tan I group, with statistically significant differences (p < .05). Overexpression of KDM4D can impair Tan I-induced ferroptosis in gastric cancer cells (a) qPCR for KDM4D gene expression in KDM4D-overexpression cells; (b)-(c) Western blotting for KDM4D protein expression in KDM4D-overexpressed cells and quantification of the results; (d) CCK-8 assay for cell activity; (e)-(f) Biochemical assays for LDH and Fe2+ levels; (g) Western blotting for KDM4D, p53, GPX4, ACSL4, SLC7A11, FTH1, and TFR1 protein expression levels; (H-N) Quantitative statistical results of western blotting for strip optical density values; **p < .01, *p < .05, statistically significant differences when comparing cells in the same control group; ##p < .01, #p < .05, statistically significant differences when comparing the two groups in the linked line.
Discussion
Both Tan IIA and Tan I are the active components of tanshinones, but they are different in structure and biological activity. While there have been numerous studies on the use of Tan IIA in gastric cancer,8,14 research on Tan I in this context is limited, with only one article discussing its role in inducing apoptosis in gastric cancer. 27 However, it is worth noting that the cell lines used in the experiment (BGC823 and SGC7901) were suspected to be contaminated with HeLa cells, which may jeopardize the reliability of the conclusion. 23 Therefore, it is essential to further investigate the role of Tan I in gastric cancer and elucidate its underlying mechanism.
This study demonstrated that Tan I can inhibit gastric cancer cell proliferation and mediate cell death. Tan I had a stronger inhibitory effect on AGS cells than Tan IIA. 28 Therefore, we believe that Tan I may be more effective than Tan IIA in anti-gastric cancer. Previous studies have suggested that Tan I may exert its anticancer effects by inducing cell apoptosis.20,23,29,30 Subsequently, we detected apoptosis-related proteins. However, in this study, Tan I induced the upregulation of the cleaved caspase-3 and even downregulated it in HGC27 cells. To further confirm whether Tan I can mediate the apoptosis in gastric cancer cells, we also performed Annexin V-FITC/PI apoptosis detection by flow cytometry, and the results showed that Tan I did not cause significant apoptosis (Supplementary Material 1). Moreover, we did not observe the existence of apoptotic bodies. Therefore, we concluded that apoptosis is not the primary mode by which Tan I inhibits AGS and HGC27 cells.
Notably, GPX4, a protein related to ferroptosis inhibition, was significantly downregulated after Tan I treatment. Ferroptosis is a possible mechanism of action. As a new type of cell death, ferroptosis is significant for anti-gastric cancer and anti-drug resistance. 31 ROS play a crucial role in lipid peroxidation, so factors that may change the level of ROS in cells may also induce ferroptosis. 32 GSH is an essential antioxidant for maintaining redox stability. Any factor that increases the consumption of glutathione or destroys the synthesis of glutathione may increase cell ROS levels and induce iron denaturation. 33 FTH1 is a functional subunit of the main iron storage protein ferritin, which has iron oxide enzyme activity and effectively reduces the toxicity of Fe2+. 34 In addition, FTH1 protects cancer cells from the influence of ferroptosis.35,36 Transferrin receptor protein 1 (TFR1) can introduce iron ions into cells from the extracellular environment, which is conducive to developing cell ferroptosis and is a hallmark protein of ferroptosis.37–39 Fer-1 can significantly reduce the induction of ferroptosis-related indicators by Tan I. All these findings indicate that Tan I induces ferroptosis in AGS and HCG27 gastric cancer cells. 14
KDM4D, also known as JMJD2D, is a histone demethylase that removes the methyl portion of lysine 9 (H3K9) on histone 3 and lysine 26 (H1.4K26) on histone 1.4. It regulates gene replication and damage repair.40,41 Recent studies have shown that it is highly expressed in gastrointestinal interstitial cancers, promoting their progression. 42 In addition, KDM4D has been found to antagonize the tumor suppressor p53 and activate oncogenic signaling pathways, such as the Wnt/β-catenin pathway, to promote hepatocellular progression. 43 KDM4D binds directly to the DNA-binding structural domain of p53, inhibiting its regulatory ability on downstream genes, including SLC7A11, which is involved in ferroptosis resistance. 43 Suppression of KDM4D expression can enhance p53 activity and suppress downstream SLC7A11 gene expression. 6
Accordingly, we further demonstrated that the expression level of p53 protein was significantly upregulated, and Tan I significantly inhibited the expression level of the SLC7A11 gene after inhibition of KDM4D protein by western blotting and qPCR. This finding is consistent with the role of Tan IIA. 8 This finding corroborates the above speculative results. Moreover, the regulatory effect of Tan I on p53-SLC7A11 was significantly reversed after KDM4D overexpression. Overexpression of KDM4D also weakened the Tan I-mediated increases in the levels of lipid peroxidation damage and ferroptosis-related indexes in gastric cancer cells.
In summary, this study demonstrated that the inhibitory effect of Tan I on gastric cancer cells is mainly mediated through ferroptosis. KDM4D serves as the critical target of Tan I and regulates the downstream p53-SLC7A11, which further controls ferroptosis. This study did not observe apoptosis in gastric cancer cells, despite previous reports suggesting that Tan I induces apoptosis by reducing the levels of the antiapoptotic protein Bcl-2. This difference could be attributed to the specific cell lines used in this study. The physiological toxicity of Tan I was not investigated in animal experiments. These problems are also the key research directions for our future studies to further the phenomena observed in this study through in vivo experiments. These findings may provide critical insights for applying Tan I in gastric cancer intervention, and it is expected to provide new ideas for the development of new anticancer drugs.
Supplemental Material
Supplemental Material - Tanshinone I induces ferroptosis in gastric cancer cells via the KDM4D/p53 pathway
Supplemental Material for Tanshinone I induces ferroptosis in gastric cancer cells via the KDM4D/p53 pathway by Minming Xia, Yifeng Wu, Hui Zhu and Wenbiao Duan in Human & Experimental Toxicology
Footnotes
Author contributions
M X and H Z designed the study and developed the methodology. Y W, M X, and W D performed the experiments, collected the data, analysed and interpreted the data and wrote the original draft. M X interpreted the data and critically reviewed the manuscript. All authors have read and approved the final manuscript.
Declaration of conflicting interests
The author(s) declared no potential conflicts of interest with respect to the research, authorship, and/or publication of this article.
Funding
The author(s) disclosed receipt of the following financial support for the research, authorship, and/or publication of this article: This project is supported by the Agricultural and Community Development Fund of Yinzhou District Science and Technology Bureau, Ningbo City (No. 2023AS016).
Supplemental Material
Supplemental material for this article is available online.
References
Supplementary Material
Please find the following supplemental material available below.
For Open Access articles published under a Creative Commons License, all supplemental material carries the same license as the article it is associated with.
For non-Open Access articles published, all supplemental material carries a non-exclusive license, and permission requests for re-use of supplemental material or any part of supplemental material shall be sent directly to the copyright owner as specified in the copyright notice associated with the article.