
Abstract
Cyclosporine (CsA) is an immunosuppressive agent that often causes acute kidney injury (AKI) in children. The specific mechanisms underlying CsA-induced AKI are currently unknown. This study used an integrated network analysis of microRNA (miRNA) and mRNA expression profiles, biochemical and pathological analyses to further investigate these potential mechanisms of CsA-induced AKI. Small RNA sequence analysis identified 25 differentially expressed miRNAs, RNA sequencing analysis identified 4,109 differentially expressed mRNAs. We obtained a total of 4,367 target genes from the 25 differentially expressed miRNAs based on three algorithms, including the Mirdb, Mirtarbase, and TargetScan. 971 target genes overlapped between the 4,367 target genes and 4,109 differentially expressed mRNAs were identified for further bioinformatics analysis. Finally, 30 hub genes and two main modules were recognized. Functional enrichment analysis of 30 hub genes indicated that inflammation and epithelial-mesenchymal transition (EMT) related genes were mainly concentrated together. Pathway analysis revealed that the PI3K-Akt signaling pathway plays an integral role in CsA-induced AKI. Network analysis identified 3 important miRNAs, mmu‐miR-17b‐5p, mmu-miR-19b-3p, and mmu-mir-423-5p that may further promote the development of inflammatory responses and EMT by mediating a complex network of factors. Our research provides a clearer understanding the molecular mechanism of this specific drug-induced AKI by CsA use, which is useful for discovering potential targets for gene therapies, and drug development in CsA-induced AKI.
Introduction
Acute kidney injury (AKI) is a life-threatening kidney disease generally resulting from complications of another serious illness. 1 AKI is known to significantly effect on in-hospital morbidity, mortality, and economic impact of care. 2 The main causes of AKI can include ischemia, sepsis, and it can also be drug-induced. Among them, drug-induced AKI accounted for 37.5% of adults in a cross-sectional survey. 3 Importantly, drugs are also a frequent cause of AKI in the pediatric intensive care unit. 4 Cyclosporin (CsA) is a dominant immunosuppressive drug utilized to prevent rejection following organ transplantation. 5 Despite its positive effect, the side effects of the CsA cannot be overlooked. AKI was recognized as the major side effects that limit it widespread use in the clinic. 6 Renal tubular necrosis, interstitial nephritis, and inflammatory cell inflow have been regarded as major pathological features of CsA-induced AKI. 6 Although several hypotheses on CsA-induced AKI have been proposed, the exact molecular and cellular mechanisms of CsA-induced AKI have not been elucidated yet.
Over the past decade, substantial evidences has shown that integrative analysis of global microRNA (miRNA) and mRNA expression profiles is a powerful tool to discover the pathogenic mechanisms involved in disease. 7 MicroRNA (miRNA) is a short, single-stranded RNA that plays various roles in mediating xenobiotic metabolism and toxicity. Alternation of miRNA expression is associated with early onset and faster progression of various diseases. 8 The linkage between certain miRNA and renal damage has also been demonstrated. A highly upregulated expression of miRNA-21 was observed in renal ischemia-reperfusion injury 9 and gentamicin-induced AKI. 10 Researchers also found that miRNA-132-3p, miRNA-18a-5p, and miRNA-144b-5p were downregulated in a drug-induced kidney injury model. 11 Recently, a relationship between miRNAs and CsA-induced AKI has been shown, which is more complicated than previously identified. 12 However, studies on the identification of the specific miRNAs associated with AKI induced by CsA by performing high-throughput small RNA sequencing are rare. An integrated analysis of miRNA and mRNA expression profiles could improve the understanding of the mechanisms related to the pathogenesis of CsA-induced AKI.
In this study, we analyzed the expression profiles of renal miRNA and mRNA. Utilizing small RNA sequencing and RNA sequencing, we identified the hub gene and key pathways. We also constructed the miRNA-mRNA regulatory network and miRNA-mRNA-pathway regulatory network related to the pathogenesis of CsA-induced AKI through the integrated analysis of the crucial miRNAs and mRNA related to CsA-induced AKI (Figure 1). This study provides a fresh perspective on understanding the molecular mechanism behind AKI induced by CsA. Elucidating these regulatory mechanisms may pave the way for identifying new targets for gene therapies and drug development in AKI treatment. Schematic representation of the study design and workflow employed in this study.
Materials and methods
Animal models
Animals have been handled according to the National Institutes of Health guidelines. Animal testing was approved by the Board of Animal Ethics in Shanghai Children’s Hospital (2019R022-F01). Male C57BL/6 mice were obtained from Shanghai Model Organisms Center, Inc (Shanghai, China). All animals were housed in a temperature and light-dominated environment under 12: 12 light: dark circulation. All mice had free access to low-sodium diet (0.01% sodium diet) and water. Followed this diet for seven days before treatment and through the treatment period. Twenty mice were randomly assigned to the CsA group (Tokyo Chemical Industry Lot., n = 10) and the control group (n = 10). Mice were administered of CsA (300 mg/kg/day, BW) by gastric administration in the CsA group. Control mice (n = 10) received only olive oil. All mice were sacrificed at 4 days after CsA administration.
Biochemistry analysis
An automatic biochemical analyzer (Hitachi 7080, Japan) was used to measure blood urea nitrogen and creatinine levels.
Histological analysis
Kidney was cut along the frontal plane and immediately immersed in 10% formaldehyde for histological analysis. Shanghai Showbio Biotech Inc. performed histological assessments. Paraffin sections were dyed with hematoxylin eosin (H&E). The image was taken using an Olympus bx61vs microscope (Olympus Corporation, Tokyo, Japan). A pathological assessment score from 0 to 4 was given: 0, normal histology; 1, mild injury—5% to 25% showed pathological damage; 2, moderate injury—25% to 50% showed pathological damage; 3, severe injury—50% to 75% showed pathological damage; and 4, almost all tissue in the field of view were damaged. The average histological score for each sample was calculated as previously published.13
RNA extraction, mRNA and miRNA library construction
Total RNA was extracted from the renal tissue using Triol (Invitrogen, Carlsbad, CA, USA) in accordance with the manufacturer’s introductions. After that, total RNA was qualified and quantified using a NanoDrop and Agilent 2100 bioanalyzer (Thermo Fisher Scientific, MA, USA). Construction of the library was implemented by Beijing Genome Institute (BGI; Shenzhen, China). Briefly, Oligo-attached magnetic beads were used to purify mRNA, and fragment buffer was used to fragment purified mRNA into small fragments. Thereafter, reverse transcription with random hexamer primers was used to produce the first strand cDNA, followed by synthesizing the second strand cDNA. As a final step in the repair process, a tailing mix and an RNA index adapter were added to the incubation. We amplified cDNA fragments from the previous step, purified them with Ampure XP beads, and dissolved them in EB solution. an Agilent Technologies 2100 Bioanalyzer was used for quality control on the product. The final ligation PCR products were sequenced using the BGISEQ-500 platform (BGI, Shenzhen, China). A small RNA fragment corresponding to 18–30 nt bands of marker lanes was excised and recovered (14–30 ssRNA ladder markers). Afterward, adenylated 3’ adapters were annealed to unique molecular identifiers (UMI), followed by the ligation of 5’ adapters. After RNA from the “adapter ligation was isolated, SuperScript II reverse transcriptase (Invitrogen, USA) was used to transcribe the RNA into cDNA. Several rounds of PCR amplification were performed to amplify cDNA fragments. PCR products were selected at target fragments 110 – 130 bp by agarose gel electrophoresis. It was purified by QIAquick Gel Extraction kit (QIAGEN, Valencia, CA). The fragment size distribution was verified using the Agilent 2100 Bioanalyzer, and the library was quantified using RT-qPCR. The last ligation PCR product was sequenced using the DNBSEQ platform (BGI, Shenzhen, China).
Identification of differentially expressed miRNAs and differentially expressed genes
The raw data was processed by Beijing Genome Institute (BGI; Shenzhen, China). Using DESeq2. 14 The screening criteria for differentially expressed miRNAs (DEMs) or differentially expressed genes (DEGs) included that Q-value <0.05 and the |log2 (Fold Change) | ≥ 1. The DEMs or DEGs were visualized on a volcano plot constructed by plotting log10 (Q-value) on the y-axis and log2 (Fold Change) on the x-axis.
Annotation, target genes identification and functional enrichment
Target genes of DEMs were predicted using three miRNA target prediction databases, Including miRDB 15 (http://mirdb.org/miRDB/), Mirtarbase 16 (http://miRTarBase.cuhk.edu.cn/), and TargetScan 17 (https://www.targetscan.org/vert_72/). Using Venny 2.0, we estimated the intersection of the two databases to eliminate the bias caused by a single database prediction (http://bioinfogp.cnb.csic.es/tools/venny/). Second, miRNA target gene prediction was compared with that of DEGs to detect overlap. After that, overlap DEGs were loaded into ingenuity pathway analysis (IPA) software (IPA™, http://www.ingenuity.com/) for further functional enrichment analysis.
PPI network analysis and hub genes as well as key modules recognition
Protein–protein interaction patterns and networks were obtained from the STRING database (https://string-db.org/). 18 The overlapped DEGs were mapped to the STRING database to construct PPI network. The interaction score was set to 0.7 as cut-off point. Cytoscape software (Cytoscape, Ver 3.8.2) visualized the PPI network and analyzed the interaction.19,20 The generated interaction pattern was downloaded. Using the Cytoscape software, we evaluated the statistics and interaction profiles of all genes. Cytoscape’s molecular complex detection plug-in (MCODE) was used to identify the most significant modules. The MCODE score was set to 10 as the cutoff point. Subsequently, the hub genes were selected using the plug-in cytoHubba 21 of Cytoscape software. To identify hub genes, we used the degree, maximal clique centrality algorithm (MCC), edge percolated component (EPC), and maximum neighborhood component (MNC) algorithms. Using the MCC, EPC, and MNC scores of the top 50 nodes, the hub genes were created by intersecting the results of the four algorithms. After that, hub genes were submitted to Dr. Tom’s website (https://biosys.bgi.com/#/report/login) for performing Gene Ontology (GO) enrichment analysis and Kyoto Encyclopedia of Genes and Genomes (KEGG) pathway enrichment analysis. A Q value of 0.05 or less was considered significant for GO terms and KEGG pathways.
Construction of miRNA-mRNA-pathway regulatory network
The hub genes and the corresponding miRNAs as well as the corresponding significantly enriched KEGG pathway was used to construct the miRNA-mRNA-pathway regulatory network. Cytoscape software visualized the regulatory network.
Real-time quantitative PCR
Based on the instructions provided by the manufacturer, the cDNA was synthesized using the microRNA Reverse Transcription Kit PLUS (EZB-miRT2-plus) (EZBioscience, Roseville, USA). We performed real-time quantitative PCR using an ABI 7500 (Applied Biosystems, USA). The primers for miRNA and mRNA was obtained from Sangon Biotech (Shanghai, China). The sequences of the primer are shown in Supplementary Table 1 and Supplementary Table 2. For the quantification of mRNA expression, the conditions for the RT-qPCR reaction were set according to the protocol of the miScript PCR Starter Kit (Qiagen, Hilden, German). U6 small nuclear RNA (Qiagen, Hilden, German) was used to normalize the data. Quantification of mRNA expression was performed with real-time PCR using SYBR Green Premix Pro Taq HS qPCR Kit (ROX Plus) (Accurate Biotechnology, China). All reactions were performed in triplicate with the following thermal cycling conditions: initial denaturation at 95°C for 30 s, followed by 40 cycles of 95°C for 5 s and 60°C for 30 s β-actin was used as an internal reference gene to calculate the relative expression of target genes.
Immunofluorescence analysis
Kidney tissues were dissected and fixed in 4% paraformaldehyde, dehydrated, and embedded in paraffin, and cut into 5 µm slides. The slides were then incubated overnight at 4°C with 1:200 dilution of primary antibody against IL-6 (Servicebio; GB11117) and MMP9 (abcam; ab283575). Subsequently, the slides were washed with PBS and incubated with 1:300 dilution of Cy3-conjugated anti-rabbit antibody (Servicebio, GB21303, China) for 50 min at room temperature. Nuclei were stained with DAPI (Servicebio, G1012, China) for 10 min. Fluorescence images were obtained using a Pannoramic MIDI scanner (3DHISTECH; Budapest, Hungary). The percentage of positively stained cells for IL-6 and MMP9 was calculated by HALO image analysis software.
Statistical analyses
The mean and standard deviation (SD) are presented as data. An analysis of variance was performed using a one-way ANOVA or a non-pairing t-test. Statistical significance is shown as follows: *p < .05, **p < .01, ***p < .001 versus the control group. All statistical analyses were performed using SPSS 24.0 software. A volcano plot, a heatmap, and a score plot were created using R software (version 3.6.2; MathSoft, Seattle, WA).
Results
Effects of CsA on serum biochemistry and kidney histopathology in mice
As shown in Figure 2(a)–(c), CsA increased serum creatinine and BUN along with a significant increase in the ratio of kidney weight to body weight. Renal histological observation revealed serious renal damage from CsA-treated mice in comparison with vehicle-treated mice (Figure 2(d) and (e)). These renal damages included vacuolar degeneration, necrosis, and tissue infiltration of inflammatory cells. CsA induced physiological, biochemical, and histological changes in mice. (a) Creatinine level. (b) BUN level. (c) The ratio of kidney weight and body weight. (d) Histological examinations of the kidneys in the control group and CsA group. (e) Kidney injury scores in rats were analyzed. Data are presented as Mean ± SD. n = 10, ***p < .001 versus the Control group. BUN, blood urea nitrogen.
Effect of CsA on miRNA and mRNA expression profiles
A total of 273 miRNAs were detected. As Figure 3(d) shows, the principal component analysis score plot obtained by 273 miRNAs showed a clear separation between the control group and the CsA group. This demonstrates the sharp difference in miRNA profiles. As illustrated in Figure 3(a) and (b), 25 DEMs were significantly changed (Q-value < 0.05 and the |log2 (Fold Change) | ≥ 1) in the CsA group compared with those of the control group. 13 miRNAs were upregulated and 12 miRNAs were downregulated in the CsA group. The red or blue blots in the volcano plot (Figure 3(a)) presents DEMs, while the gray blots indicate other detected miRNAs. Hierarchical clustering of representative miRNA expression demonstrated that an overall high reproducibility in biological replicates. As shown in Figure 3(c), the hierarchical cluster analysis showed that the quantified data could be used for further analysis. In addition, a total of 16,802 genes were detected. The score plot obtained by all mRNAs analyzed showed a clear separation between the control group and the CsA group through principal component analysis (Figure 4(d)). This volcano plot presents DEGs as red blots or blue blots and other detected mRNAs with gray blots (Figure 4(a)). We identified 4,109 DEGs using cutoffs of |log2 (Fold Change) | ≥ 1 and a Q-value < 0.05. Among these genes, 2,307 were downregulated, and 1,802 were upregulated after CsA treatment (Figure 4(b)). The heatmap displayed the sharp difference in mRNA profiles between the control group and the CsA group (Figure 4(c)). Effect of CsA on miRNA expression profile. (a) Volcano plot of DEMs. Red dots represent the up-regulated DEMs, blue dots represent the down-regulated DEMs, and the gray dots represent miRNA with no significant difference; (b) The number of DEMs. Red represent the up-regulated DEMs and blue represent the down-regulated DEMs; (c) Heatmap of the DEMs. The Changes in miRNA expression level are represented with a color scheme from red to blue, among them, with bright red indicating high values and bright blue indicating low values; (d) The PCA score plot derived from the DEMs level of the control and the CsA group. Effect of CsA on mRNA expression profile. (a) Volcano plot of DEGs. Red dots represent the up-regulated DEGs, blue dots represent the down-regulated DEGs, and the gray dots represent mRNA with no significant difference; (b) The number of DEGs. Red represent the up-regulated DEGs and blue represent the down-regulated DEGs; (c) Heatmap of the DEGs. Changes in mRNA expression level is represented with a color scheme from red to blue, among them, with bright red indicating high values and bright blue indicating low values; (d) The PCA score plot derived from the DEGs level of the control and CsA group.

Annotation, target gene identification, and functional enrichment
A Venn diagram showed that 971 (450 up-regulated, and 521 down-regulated) putative target genes overlapped between the 4,367 target genes of 25 miRNAs and 4,109 DEGs (Figure 5(a)). As Figure 5(b) shown, a large part of modulated genes is associated with renal injury. Canonical pathway enrichment results showed that several pathways were also enriched, such as PI3K-Akt signaling, Toll-like receptor signaling, IL-6 signaling, Nrf-mediated oxidative stress response, STAT3 pathway (Figure 5(c)). The top 20 upstream regulators were also enriched, such as IL-6, IL-1β, and TNF (Supplementary Figure 1). Identification of CsA-regulated miRNAs putative target genes and corresponded functional enrichment analysis performed by IPA. (a) The Venn diagram of genes among the 25 miRNA target genes (4367) and identified DEGs (4109); (b) The significant enriched 20 toxicological function of 971 putative target genes. (c) The significant enriched 20 canonical pathways of 971 putative target genes.
Protein-protein interaction network analysis and hub genes as well as key modules recognition
As shown in Figure 6(a), a PPI network of the 971 putative target genes, with 485 nodes and 829 edges, was clearly illustrated. We identified the two significant modules (score ≥ 10) using the MCODE plugin (Figure 6(b) and (c)). Notably, IL-6 showed the highest degree and the highest expression in the key modules (Figure 6(b)). Subsequently, 30 hub genes related to CsA-induced AKI were identified using degree, EPC, MCC, and MNC algorithms in the CytoHubba plugi (Figure 6(d) and Supplementary Table 3). After that, PPI network analysis of 30 hub genes was performed to further investigate the interactions of the proteins. As Figure 6(e) and Supplementary Table 4 shown, Il-6 and Ptk2 showed the highest degree, suggesting that Il-6 and Ptk2 might play an important role in CsA-induced AKI. In addition, PI3K-Akt signaling pathway, Toll-like receptor signaling pathway, chemokine signaling pathway, and cytokine-cytokine receptor interaction were significantly enriched (Figure 6(f)). PI3K-Akt signaling pathway showed the minimum Q value and the largest number of regulated genes according to the result of pathway network analysis (Supplementary Figure 2). Moreover, clusters of these 30 hub genes were significantly enriched in BP associated with inflammatory response (Il-6, Csf1, Myd88, Cxcl2, Cxcl10, Sdc1, Stat3), neutrophil chemotaxis (Cxcl2, Spp1, Cxcl10), cell adhesion (Cd4, Itga5, Itga6, Itga8, Lama3, Spp1), response to cytokines (Il-6, Jun, Stat3), cytokine mediated signaling pathways (Il-6, Kras, Myd88, Stat3), and the integrin-mediated signaling pathway (Ptk2, Itga5, Itga6, Itgb8) (Figure 6(g)). Their CC were most significantly located in the extracellular region, membrane, and endoplasmic reticulum (Supplementary Figure 3A). The MF of 30 hub genes were involved in integrin binding (Actn1, Ptk2, Itga5, Itga6, Itgb8), cytokine activity (Csf1, Cxcl2, Cxcl10, Il-6, Spp1), and chemokine activity (Cxcl10, Cxcl2) (Supplementary Figure 3B). Protein-protein interaction (PPI) network analysis and hub genes as well as key modules recognition. (a) Visualization of the PPI network of 971 target genes. The most (b) and second (c) significant modules of the 971 target genes by MCODE plugin. (d) The intersection of genes using the degree, MCC, MNC, and EPC algorithms. (e) Visualization of the 30-hub gene PPI network. (f) The significant 10 KEGG pathway of 30 hub genes; (g) The significant 10 BP terms of 30 hub genes; The circle node size reflects degree values: the larger the degree is, the larger the circle node size is. A higher degree of gene indicates that it plays a more important role in the network. The expression of mRNA was shown with a color scheme from highly essential (red) to essential (blue). The circle node color reflects RNA expression level, with the bright red indicating high values and bright blue indicating low values. The edge between nodes reflects PPI score values: the wider the edge is, the larger the PPI score is.
Analysis of the miRNA-mRNA regulatory network and miRNA-mRNA-pathway regulatory network
MiRNAs play pivotal roles in regulating mRNA expression. Therefore, we explored the potential miRNA-mRNA regulatory network and the potential impact of deregulated miRNAs on biological pathways. As shown in Figure 7(a) and Supplementary Table 5, mmu-miR-17b-5p, mmu-miR-19b-3p, and mmu-miR-423-5p showed the highest degree in the network, suggesting that these three miRNAs play a core role in CsA-induced AKI. The result of miRNA-mRNA-pathway network analysis demonstrated that PI3K-Akt signaling pathway shows the highest degree, which indicates it might play a core role in CsA-induced AKI (Figure 7(b) and Supplementary Table 6). Interestingly, this approach predicts that three miRNAs play a role in regulating genes associated with cytokines, chemokines, and integrins. Moreover, this approach suggested that these three miRNAs may promote inflammatory response and the occurrence of EMT via mediating a complex network (Figure 7(b)). (a) miRNA-mRNA regulatory network associated CsA-induced AKI. (b) miRNA-mRNA-pathway regulatory network associated CsA-induced AKI. The arrow represents miRNAs, circle node represents mRNAs, and rectangle represents pathways. The expression of miRNA and mRNA were shown by colors with bright red indicating high values and bright blue indicating low values.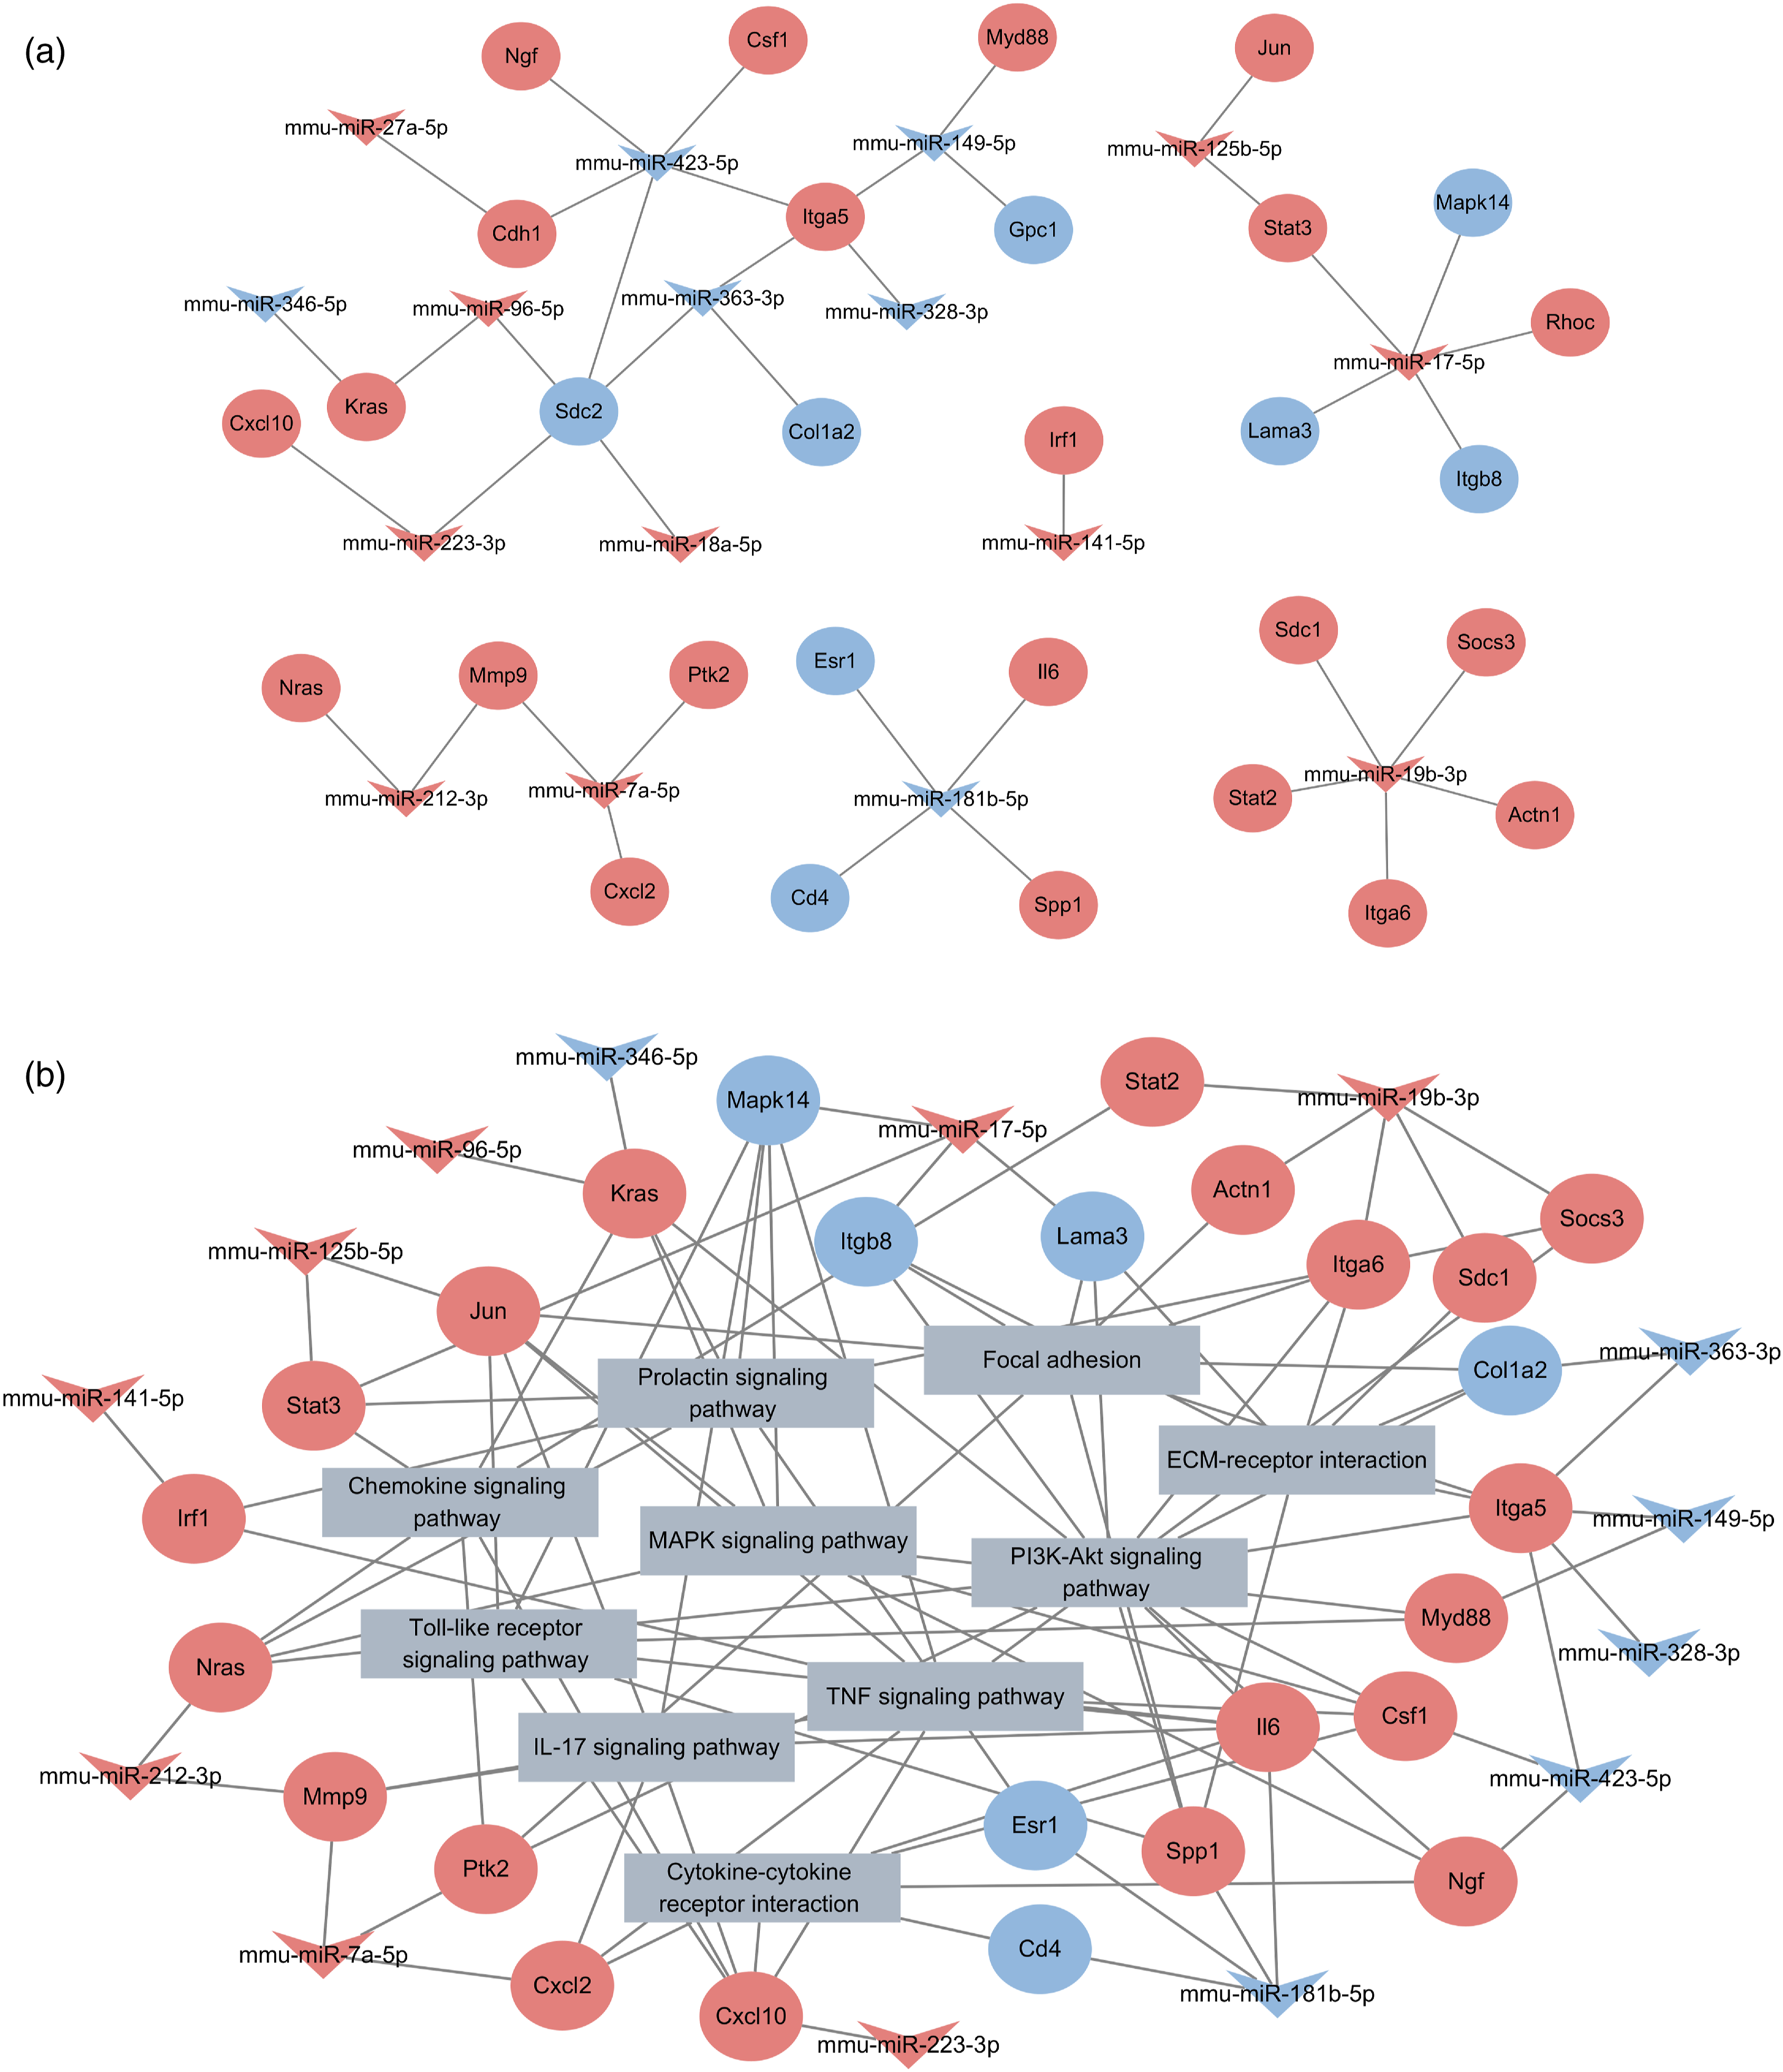
Validation by real time-quantitative polymerase chain reaction
To validate our findings based on small RNA-sequence data, we perform quantitative RT-qPCR experiments to valid the small RNA-sequence data and RNA-sequence data. As shown in Figure 8(a) and (b), the miRNA expression patterns in real-time qPCR data were consistent with small RNA-sequence data, and the mRNA expression patterns in real-time qPCR data were consistent with RNA-sequence data (Figure 8(c) and (d)). IL-6 and MMP9 expression determined by Immunofluorescence ananlysis (Figure 8(e)) was increased in mice with CsA treatment. So, the above results might partially validate the reliability of our sequence data. Validation of several miRNAs and mRNA. (a, b) The relative expression of mmu-miR-17b-5p, mmu-miR-19b-3p, mmu-miR-423-5p expression in mice determined by RT-qPCR and Small RNA-sequence analysis, respectively; (c, d) The relative expression of Il-6, Ptk2, Stat3, Kras, Jun, Myd88, Mmp9, Itga6, and Mapk14 in mice determined by RT-qPCR and RNA sequence analysis, respectively;(e) Representative lmmunofluorescence image of kidney tissue obtained from C57BL/6J male mice in control group and model group using antibodies against IL-6; (f) Representative lmmunofluorescence image of kidney tissue obtained from C57BL/6J male mice in control group and model group using antibodies against MMP9. Data are presented as Mean ± SD. *p < .05, ***p < .001 versus control group, respectively.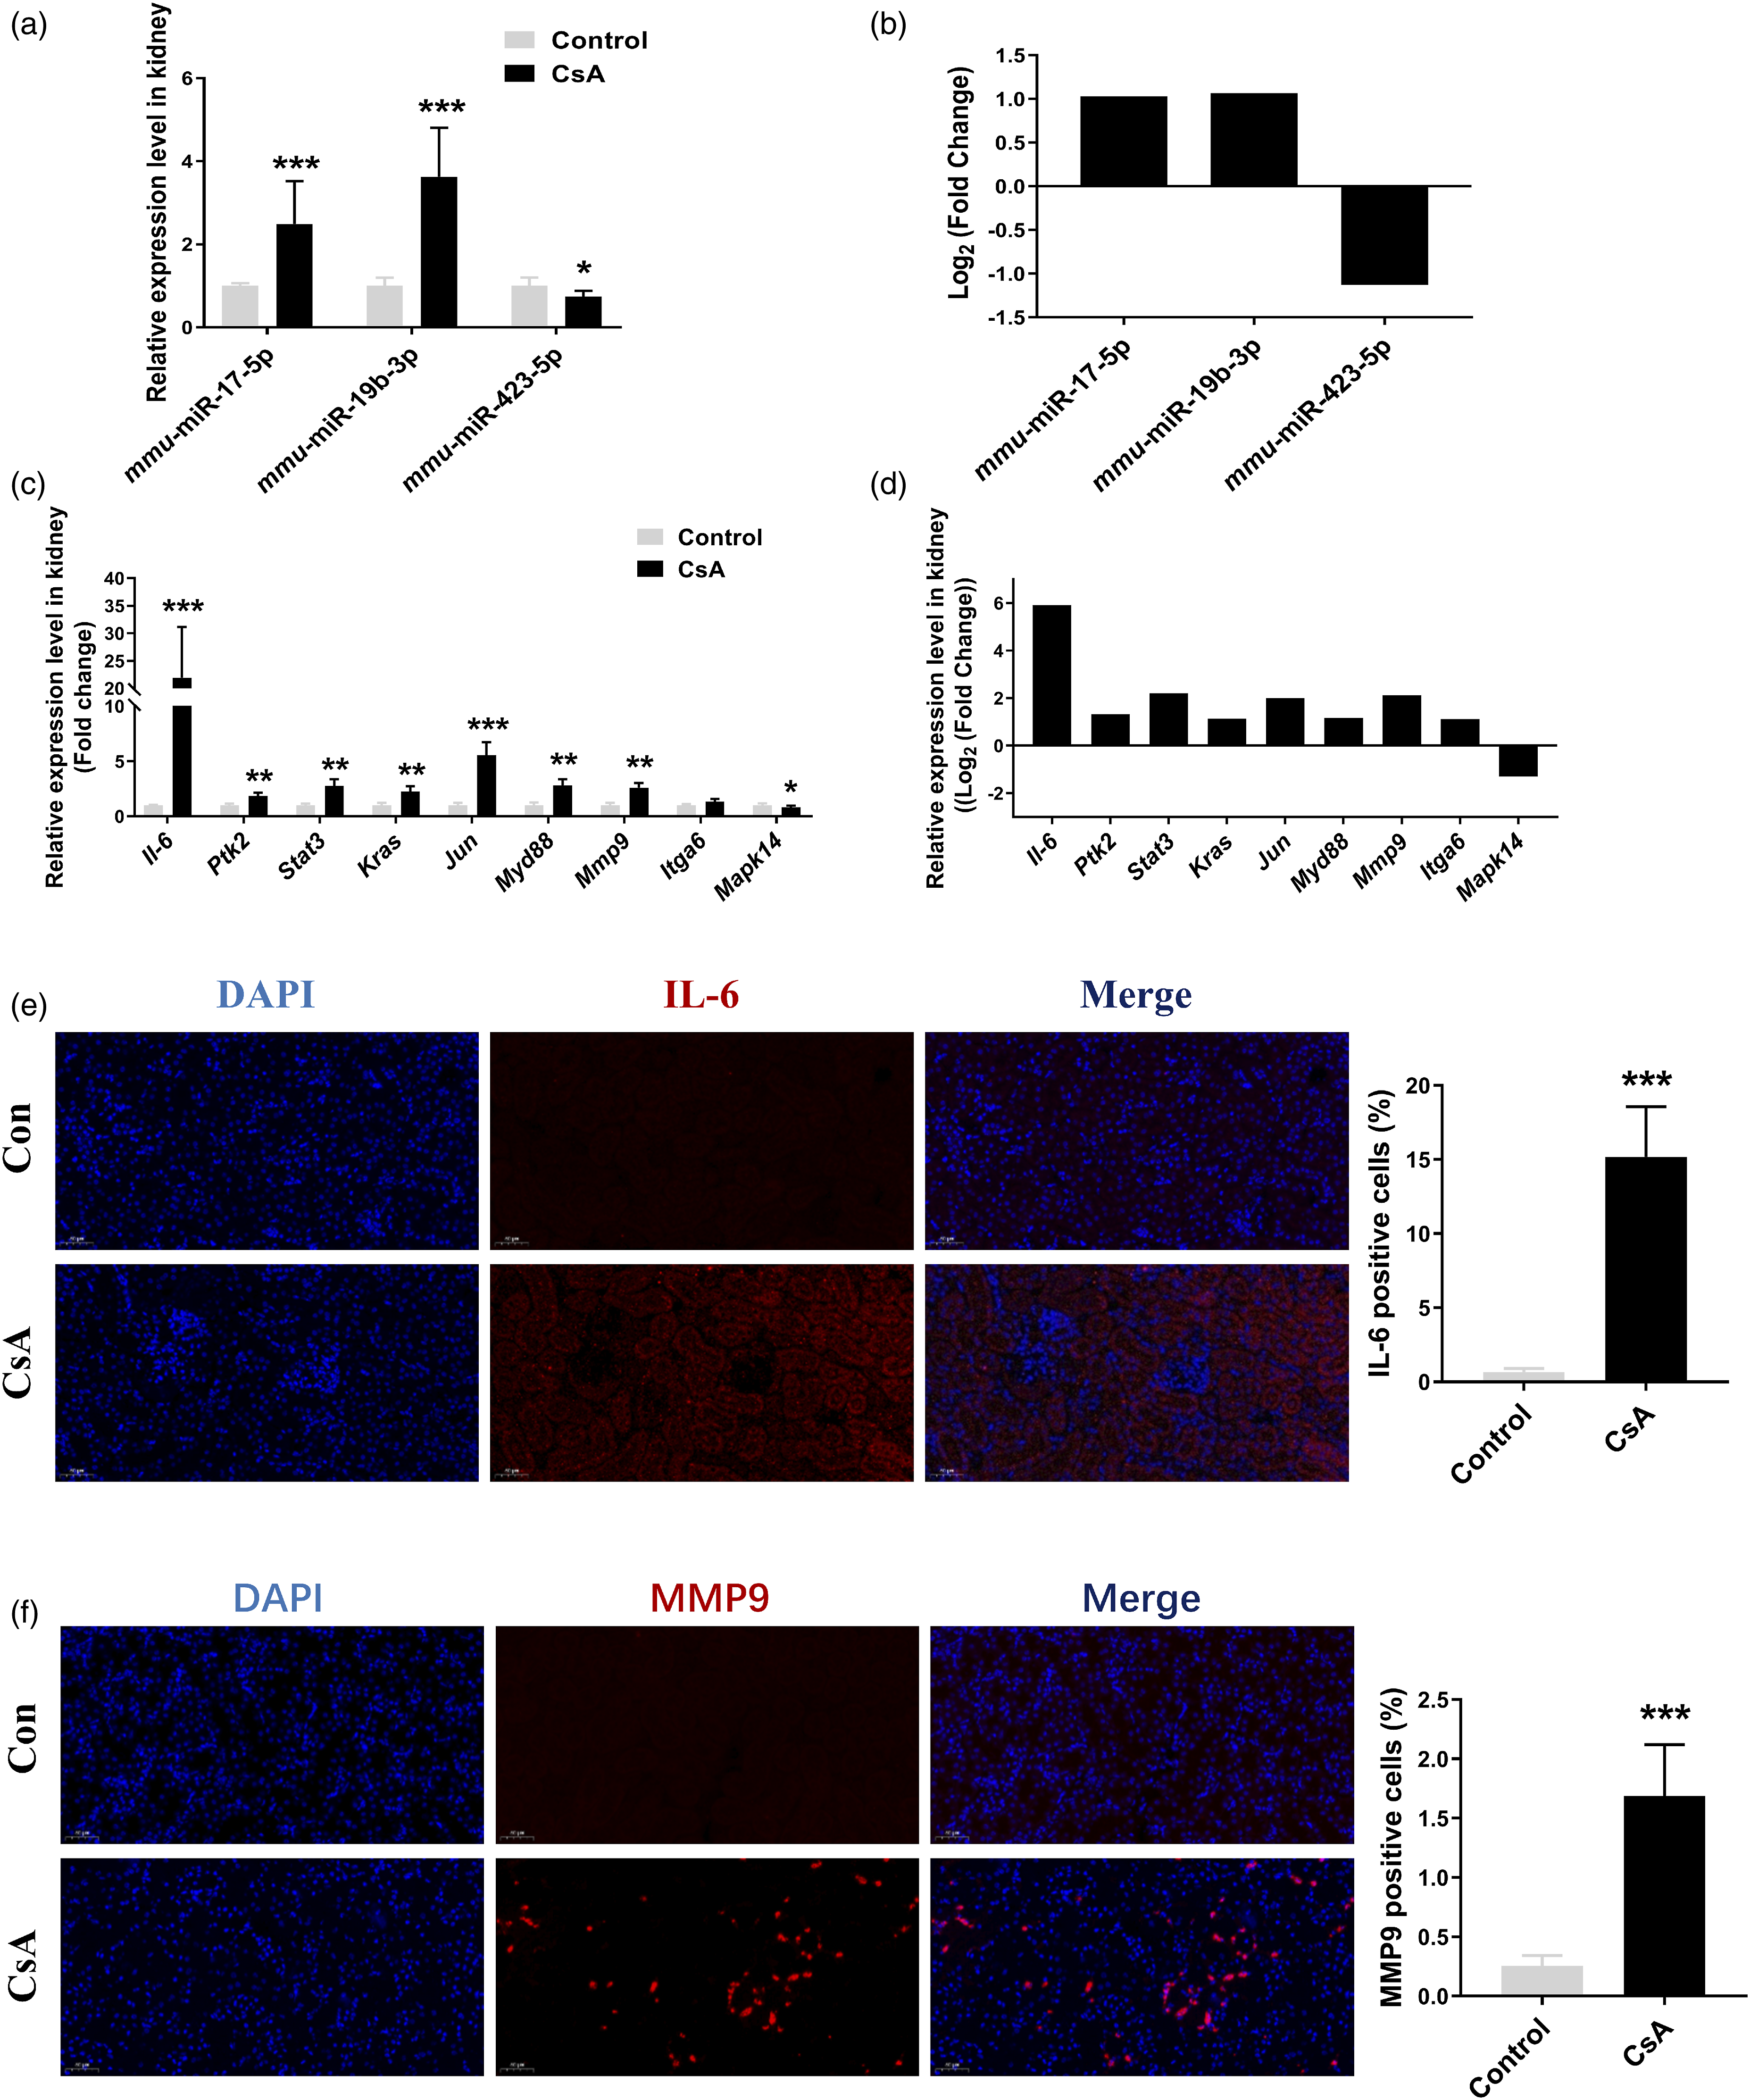
Discussion
Cyclosporine (CsA) is known as a frequent cause of drug-induced AKI. 5 Although several hypotheses concerning CsA-induced AKI have been proposed, the underlying mechanisms remain poorly understood. Recently, more attention to miRNAs has ben paid in investigating the AKI. 22 Integrative analysis of miRNAs and mRNA expression profiles can not only help to elucidate molecular regulatory mechanisms but can also help identify novel therapeutic targets. 23 In this study, we used integrative analysis to understand the molecular mechanisms of CsA-induced AKI.
Hub genes could act as biomarkers of kidney injury, which might be applied to estimate the severity of kidney injury and verify the effectiveness of treatments over time.24–26 In this study, the top 10 hub genes with the highest degrees from PPI network analyses were Il-6, Ptk2, Stat3, Kras, Jun, Mapk14, Myd88, Mmp9, Itga6, and Cd4. Some of the genes identified in this analysis have been reported previously to be related to AKI. Among them, IL-6 is a multifunctional cytokine, which maintains the balance of inflammation throughout the body. 27 It was previously identified that increased IL-6 led to deleterious system effects as well as increased mortality associated with AKI. 28 In our study, the increase of IL-6 was observed in mice with CsA-induced AKI, which is consistent with previous studies reporting that significant increases of IL-6 were observed in mice with ischemia reperfusion-induced AKI and cisplatin-induced AKI.29,30 In addition, we found that IL-6 exhibited the highest fold change in the RNA sequencing analysis and a high degree of PPI networking of the 30 hub genes. This further illustrates the pivotal role of IL-6 in the etiology of CsA-induced AKI. Epithelial-mesenchymal transition (EMT) is observed in not only renal fibrosis,31,32 but also occurs in the acute phase of kidney injury. 33 In this study, the increased expression of EMT-related genes, Ptk2, Mmp9, Jun, and Myd88, were also observed in mice with CsA treatment.34,35 A past study reported that Ptk2 is an important factor in the initiation of c-Jun N-terminal kinase-mediated cellular stress response during renal ischemia-reperfusion injury, and Ptk2 deficiency markedly ameliorated renal injury in mice. 36 In addition, the increased expression of Mmp9 was observed in rats with CsA-induced renal damage. 35 Moreover, EMT marker, vimentin and α-SMA, was increased in mice with CsA-induced AKI (Supplementary Figure 3), which had been seen before by some researchers. 32 Thus, inhibition of EMT-related genes will be effective in mice at risk for progressive kidney injury. Interestingly, the role of Kras, Itga6, and Cd4 in AKI remains unclear. Thus, a thorough exploration of these other hub genes could provide novel insights into the molecular mechanisms of CsA-induced AKI.
PI3K-Akt signaling pathway has a critical role in ameliorating AKI.37,38 Many natural compounds and drugs exert a protective effect against AKI via targeting the PI3K-Akt pathway.39–41 Furthermore, Pi3k-knockout mice exhibited more serious AKI compared with wild-type mice. 42 The above evidences suggest that the PI3K-Akt signaling pathway plays more important role in the overall maintenance of renal function than originally hypothesized. In this study, we found the pathway has a key role in potentially relieving CsA-induced AKI. Notably, IL-6 involvement in the PI3K-Akt signaling pathway was increased in mice with CsA-induced AKI, which is consistent with previously found data. Interestingly, the PI3K-Akt signaling pathway has evidence to support its central role in mediating the process of EMT.43,44 In our study, an increase in EMT-related gene expression involved in the PI3K-Akt signaling pathway was also observed in mice with CsA treatment. Taken together, the PI3K-Akt signaling pathway associated with inflammation and EMT plays a key role in CsA-induced AKI. This new information could be used to screen these genes of interest as potential pharmacological targets for the prevention and treatment of CsA-induced AKI.
Alterations of miRNA expression have been found to contribute to the occurrence of AKI.12,45,46 Previous studies showed that miR-17-5p plays an important role in mediating different kidney diseases. 47 In our study, the upregulation of mmu-miR-17-5p was observed in CsA-induced AKI, which is consistent with previous reports. 47 Notably, Stat3 signaling has a protective role in limiting kidney dysfunction after AKI by mediating the inflammatory response. 48 In our study, Stat3 was predicted as the target gene of mmu-miR-17-5p, and the increase of Stat3 was accompanied by Il-6. This phenomenon is consistent with previous reports of similar increases of inflammatory responses. 49 In addition, the EMT-related gene Itgb8, is also predicted as the target gene of mmu-miR-17-5p. However, the specific role of mmu-miR-17-5p in mediating EMT is still unknown. Therefore, it is worthwhile to explore whether mmu-miRNA-17-5p is involved in the process of AKI by regulating Stat3 and Itgb8 to mediate inflammation response and EMT. A previous study 50 showed that the urinary exosomal miR-19b-3p expression had a positive correlation with the severity of albuminuria and tubulointerstitial inflammation, and an increase of exosomal miR-19b-3p expression was observed in LPS-induced AKI models. However, there are no reports on the relationship between miR-19b-3p and CsA-induced AKI. In our study, CsA treatment induced a markedly high expression of renal mmu-miR-19b-3p compared to that of control mice. We also found that inflammation-related genes are predicted as the target genes of mmu-miR-19b-3p, including Sdc1 and Stat2. In addition, the EMT-related gene, Itga6, is also predicted as the target gene of mmu-miR-19b-3p, while its specific role in mediating EMT is still unknown. Thus, it will be of interest to explore the role of mmu-miR-19b-3p in mediating EMT in future studies. Substantial evidences demonstrate that miR-423-5p is involved in the maintenance of renal function.51,52 It has been revealed that the decrease of miR-423-5p markedly enhanced the secretion of Il-6, Tnf-α, and Il-1β to aggravate inflammation as well as EMT in a diabetic nephropathy model. 53 In our study, we also found that downregulated mmu-miR-423-5p is observed in mice with CsA treatment. Moreover, the gene Itga5 associated with EMT, was predicted as a target gene of mmu-miR-423-5p. Therefore, it is reasonable to estimate that mmu-miR-423-5p may regulate EMT by regulating Itga5 expression in CsA-induced AKI models. Collectively, the above findings demonstrate that mmu-miR-17-5p, mmu-miR-19b-3p, and mmu-miR-423-5p are the critical miRNA in regulating the process of CsA-induced AKI from an integrative bioinformatics aspect. Interestingly, this approach predicts that mmu-miR-17b-5p, mmu-miR-19b-3p, and mmu-miR-423-5p may play a role in promoting inflammatory responses and EMT.
Notably, the DEGs were not enriched in the enrichment analysis or chosen as hub genes that could play an important role in CsA-induced AKI, which is one limitation of this study. Given the small sample size in this study, the bias of the findings should be a consideration as well. In addition, the diverse cellular background in kidney tissue may lead to cell type-specific changes in miRNA expression. This could affect the conclusions that relate to the etiology of CsA-induced AKI. Considering this complexity, future research should delve deeper into the intriguing aspects of cell-specific alterations across diverse cell types.
Conclusion
In summary, our study uncovered the importance of pathways as well as miRNAs associated with inflammation and EMT in CsA-induced AKI. The genes, pathways, and miRNAs identified in this study could be potential targets for the prevention or treatment of CsA-induced AKI. Overall, our study provides a clearer understanding the molecular mechanism of this specific drug-induced AKI by CsA use, which is useful for the discovery of potential targets for gene therapies, and drug development in CsA-induced AKI.
Supplemental Material
Supplemental Material - Integrative analysis of renal microRNA and mRNA to identify hub genes and pivotal pathways associated with cyclosporine-induced acute kidney injury in mice
Supplemental Material for Integrative analysis of renal microRNA and mRNA to identify hub genes and pivotal pathways associated with cyclosporine-induced acute kidney injury in mice by Qiaoling Yang, Xunjiang Wang, Hongjing Li, Xuedong Yin, Hongxia Liu, Wenjuan Hu, Ying Qing, Lili Ding, Li Yang, Zhiling Li and Huajun Sun in Human & Experimental Toxicology
Footnotes
Acknowledgements
We would like to acknowledge the members of Beijing Genomics Institute (Shenzhen, China) for performing small RNA-Sequence and RNA-Sequence analysis.
Author contributions
Conceptualization, HS and LZ; Formal analysis, QL and XW; Data curation, XW, HL, and XY; Funding acquisition, QL, LZ, H.L., and WH; Project administration, QL, LZ, and HS; Supervision, LZ and HS; Validation, HL, WH, HL, and YQ; Visualization, QL, XW, XY and HL; Writing—original draft, QL and XW; Writing—review&editing, HL, WH, LD, LY, YQ, QL, XW, LZ, and HS All authors have read and agreed to the published version of the manuscript.
Declaration of conflicting interests
The author(s) declared no potential conflicts of interest with respect to the research, authorship, and/or publication of this article.
Funding
The author(s) disclosed receipt of the following financial support for the research, authorship, and/or publication of this article: This work is financially sponsored by Interdisciplinary Program of Shanghai Jiao Tong University (No. YG2019QNA03) and to Shanghai Sailing Program (No. 21YF1437900). It is also financially sponsored by Shanghai “Rising Stars of Medical Talent” Youth Development Program “Outstanding Youth Medical Talent” (No. SHWSRS (2021)099), Shanghai Talent Development Funding (No. 2020110). This work is partially supported by Innovative research team of high-level local universities in Shanghai (SHSMU-ZDCX20212200), Shanghai “Rising Stars of Medical Talents” Youth Development Program (SHWSRS (2020)-087), and Research Project established by Chinese Pharmaceutical Association Hospital Pharmacy department (No. CPA-Z05-ZC-2021-002).
Author’s note
Huajun Sun (H. S.) will handle correspondence at all stages of refereeing and publication, also post-publication.
Data availability statement
The datasets presented in this study can be found in online repositories. The names of the repository/repositories and accession number(s) can be found below: https://www.ncbi.nlm.nih.gov/Traces/study/?acc=SRP389447&o=acc_s%3Aa&s=SRR20753719.
Supplemental Material
Supplemental material for this article is available online.
Appendix
References
Supplementary Material
Please find the following supplemental material available below.
For Open Access articles published under a Creative Commons License, all supplemental material carries the same license as the article it is associated with.
For non-Open Access articles published, all supplemental material carries a non-exclusive license, and permission requests for re-use of supplemental material or any part of supplemental material shall be sent directly to the copyright owner as specified in the copyright notice associated with the article.