
Abstract
Background
The role and underlying mechanism of liver macrophages and their derived miR-155-5p in hepatic lymphangiogenesis in liver fibrosis remain unclear. Here, we investigated the mechanism by which macrophages and miR-155-5p were involved in lymphangiogenesis during liver fibrosis and cirrhosis.
Methods
In vivo, hepatic lymphatic vessel expansion was evaluated; the liver macrophage subsets, proportion of peripherally-derived macrophages and expressions of CCL25, MCP-1, VAP-1 and MAdCAM-1 were documented; and miR-155-5p in the peripheral blood and liver was detected. In vitro, macrophages with miR-155-5p overexpression and inhibition were used to clarify the effect of miR-155-5p on regulation of macrophage polarization and the possible signalling pathway.
Results
Hepatic lymphangiogenesis was observed in mice with liver fibrosis and cirrhosis challenged with carbon tetrachloride (CCl4). In the liver, the number of M1 macrophages was associated with lymphangiogenesis and the degree of fibrosis. The liver recruitment of peripherally-derived macrophages occurred during liver fibrosis. The levels of miR-155-5p in the liver and peripheral blood gradually increased with aggravation of liver fibrosis. In vitro, SOCS1, a target of miR-155-5p, regulated macrophage polarization into the M1 phenotype through the JAK1/STAT1 pathway.
Conclusion
MiR-155-5p-SOCS1/JAK1/STAT1 pathway participates in hepatic lymphangiogenesis in mice with liver fibrosis and cirrhosis induced by CCl4 by regulating the polarization of macrophages into the M1 phenotype.
Introduction
Hepatic lymphangiogenesis is present in liver diseases, including viral hepatitis, primary biliary cholangitis, hepatocellular carcinoma, liver fibrosis and cirrhosis. 1 Signalling by VEGF-C/VEGFR-3 is essential for lymphatic vessel development; macrophages participate in lymphangiogenesis by secreting VEGF-C. 2 The polarization of macrophages influences lymphatic vessel regeneration.3,4 Both intrinsic and peripherally recruited macrophages in the liver participate in liver injury through different phenotypes, with continuing M1 polarization promoting the initiation and progression of liver fibrosis. 5
Changes in microRNA expression are closely associated with liver injury.6,7 MiR-155-5p is an important regulator of immune cells and is involved in inflammation and immunity. 8 Macrophages are the origin of miR-155-5p; in addition, macrophage interaction with miR-155-5p plays a critical role in inflammatory diseases. 9 Macrophages mediated by miR-155-5p are involved in liver injury;10–12 more specifically, miR-155-5p has been shown to promote M1 macrophage polarization by targeting various transcription factors and adaptor proteins. 9
The role of liver macrophages and their derived miR-155-5p underlying hepatic lymphangiogenesis in liver fibrosis and cirrhosis has not been fully elucidated. Based on our previous result that miR-155-5p regulates PI3K/AKT-mediated endothelial mesenchymal transition by targeting SHIP-1 in pulmonary fibrosis, 13 we further investigated the mechanism of macrophages and miR-155-5p involved in lymphangiogenesis during liver fibrosis and cirrhosis.
Materials and methods
Animals and CCl4 treatment
Male C57BL/6J mice, 8 weeks old and weighing 15–20 g were purchased from the Laboratory Animal Center of Dalian Medical University. The mice were housed five per cage in an air-conditioned room at 21–23°C with 45–55% humidity and a 12 h light/12 h dark cycle. This research project was approved by the Animal Care and Use Committee of Dalian Medical University (Permit Number: AEE18071) to guarantee that all works involving experimental animals were performed in full compliance with NIH (National Institutes of Health) Guidelines for the Care and Use of Laboratory Animals. Extensive efforts were made to ensure minimal suffering of the included animals.
Liver fibrosis and cirrhosis were induced in mice by CCl4 (20% in olive oil) at a dosage of 2.5 μL/g/mouse twice per week intraperitoneally (i.p.). The sham mice were treated with the same volume of olive oil. The groups were as follows (five mice per group): CCl4-1w (CCl4 treatment for 1 week), CCl4-2w (CCl4 treatment for 2 weeks), CCl4-4w (CCl4 treatment for 4 weeks), CCl4-6w (CCl4 treatment for 6 weeks), CCl4-8w (CCl4 treatment for 8 weeks) and the sham group (olive oil injection). Mice were anesthetized at different time intervals with 1% pentobarbital sodium (70 mg/kg, i.p.). The liver and blood samples were collected and processed for follow-up experiments.
Histological analysis
For the morphometric studies, liver tissues were preserved in 10% formaldehyde, embedded in paraffin, cut into 5-μm-thick sections and stained with haematoxylin-eosin (H and E) and Masson’s trichrome according to the standard protocols.
Immunofluorescence staining
Paraffin slides were deparaffinized with xylene and rehydrated in an ethyl alcohol gradient. Following the antigen retrieval and blocking step, primary antibodies were applied, including rabbit anti-α-SMA (1:100; Wanleibio, China, WLH3879), rabbit anti-LYVE-1 (1:200; Abcam, UK, ab218585), mouse anti-podoplanin (1:50; Santa Cruz Biotechnology, USA, sc-53,553), rabbit anti-VEGFR-3 (1:200; Affinity, China, AF41201), mouse anti-F4/80 (1:50; Santa Cruz Biotechnology, USA, sc-377,009), rabbit anti-CD86 (1:50; Abclonal, China, A1199), rabbit anti-CD206 (1:100; Affinity, China, DF4149), rabbit anti-CCL25 (1:50; Abclonal, China, A2685) and rabbit anti-VAP-1 (1:100; Bioss, China, bs-10,529R), and incubated overnight at 4°C. The sections were incubated with secondary antibodies against mouse/rabbit IgG conjugated with Cy3 (1:200; Beyotime, China, A0521 and A0516) at RT. The samples were mounted with DAPI (Cell Signalling Technology, Danvers, MA) for nuclear staining.
Assessment of lymphatic vessel density and area
Lymphatic vessel density (LVD) and lymphatic vessel area (LVA) were determined based on LYVE-1 staining. The criterion for positive lymphatic vessels was a strip, gap-like isolated or clustered structure formed by fluorescently stained endothelial cells and clearly visible vessels. For samples with cavities, we identified a dense area of tissue lymphatic vessels under a low-power microscope, i.e. a “hot spot” area. We then counted the cells under a high-power microscope and recorded the LVD as the average number of positive lymphatic vessels observed in five high-power microscope fields/slice and represented LVA as the LYVE-1-positive lymphatic luminal area/total area of the visual field.
Determination of serum liver enzymes
Glutamic pyruvic transaminase (ALT) and glutamic oxaloacetic transaminase (AST) levels in the peripheral blood of mice were determined using ALT and AST kits (Wan Lei Biological, China, WLA113) according to the manufacturer’s protocol.
Isolation of liver macrophages
Mouse liver was perfused with Hanks’ balanced salt solution (HBSS; Invitrogen, USA, 14,175,095) via the portal vein. After perfusion, the liver was minced and digested with HBSS containing 0.2% collagenase type IV (Biosharp, China, BS165), 0.4 mg/mL pronase and 0.1 mg/mL DNase I (Roche, R104159001) in a 37°C water bath with shaking. The liver specimens were filtered through 100-μm cell strainers, suspended in 33% Percoll solution (Biosharp, China, BS909) and then centrifuged for 15 min at 500 g at RT. The supernatant was collected and washed twice. Additionally, isolated cells were plated on noncollagen-coated plates for 30 min and washed with PBS three times. Finally, the cell numbers were counted under a microscope.
Isolation of peripheral blood monocytes
Monocytes were isolated using mouse peripheral blood monocyte separation medium kits (Solarbio, China, P5230) according to the manufacturer’s instructions.
Flow cytometry
Markers of macrophages and monocytes were analysed by Flow cytometry (FCM). The following antibodies were used in this analysis: F4/80-FITC (BioLegend, USA, 123,107), CD86-PE (BioLegend, USA, 159,203), CCR9-PE (BioLegend, U.S., 128,709), α4β7-PE (BioLegend, U.S., 120,605), CCR2-PE (BioLegend, USA, 150,609), CD206-PE (BioLegend, USA, 141,705), CD14-PE (BioLegend, USA, 150,105) and CD11b-APC (BioLegend, U.S., 101,211). Flow cytometry was performed according to a standard protocol. The fluorescence of the antibodies was detected using NovoCyte flow cytometers (ACEA, San Diego, CA, USA).
Cell culture and transfection
RAW264.7 cells were cultured at 37°C in a humidified atmosphere with 5% CO2. After the cells were grown to 80% confluence, the culture medium was removed, washed with PBS and digested with 0.25% trypsin. Cells were cultured in DMEM for 24 h to form M0 macrophages, in DMEM supplemented with 20 ng/mL IFN-γ and 100 ng/mL LPS for 24 h to induce M1 macrophages, and in DMEM supplemented with 20 ng/mL IL-4 and 20 ng/mL IL-13 to induce M2 macrophages.
Logarithmic growth phase cells were used for transfection with Lipo3000 (Invitrogen, USA, L3000015) following the manufacturer’s instructions. RAW264.7 cells were transfected with miR-155-5p mimics, inhibitor, or negative control (NC) and then induced to M1 macrophages. RAW264.7 cells were cotransfected with miR-155-5p mimics and recombinant plasmids containing SOCS1 (SOCS1 overexpression vector) and SOCS1 siRNA and then induced to M1 macrophages.
Quantitative PCR
Sequences of the synthesized oligonucleotides and the primers.

Western blot
Proteins were extracted using lysis buffer (Wanleibio, China, WLA019), and equal amounts of proteins were loaded into gels, separated by SDS–PAGE, and transferred to 0.2-μm nitrocellulose membranes (Bio–Rad, Hercules, CA, USA). The membranes were then immunoblotted with primary antibodies, including mouse anti-podoplanin (1:1000; Santa Curz, USA, sc-53,533), rabbit anti-VEGFR-3 (1:1000; Affinity, China, AF4201), rabbit anti-CCL25 (1:1000; Bioss, China, bs-5093R), rabbit anti-VAP-1(1:1000; Abcolonal, China, A2001), rabbit anti-VEGF-C (1:1000; Affinity, China, DF7011), rabbit anti-MCP-1 (1:500; Wanleibio, Chian, WL02966), rabbit anti-MAdCAM-1 (1:1000; ABcolonal, China, A3005), rabbit anti-iNOS (1:500; Wanleibio, China, WL0992a), rabbit anti-SOCS1 (1:500; Wanleibio, China, WL05128), rabbit anti-JAK1 (1:500; Wanleibio, China, WL02188), rabbit anti-p-JAK1 (1:500; Wanleibio, China, WL02997), rabbit anti-STAT1 (1:500; Wanleibio, China, WL02276), rabbit anti-p-STAT1 (1:500; Wanleibio, China, WL02276) and rabbit anti-β-actin (1:1000; Wanleibio, China, WL01372), and then incubated with goat anti-rabbit or mouse IgG-HRP (1:5000; Wanleibio, China). The protein levels were corrected for loading differences by normalization against the β-actin levels.
ELISA
The cell supernatant was collected and filtered with a 22 μm membrane filter and stored at −80°C. TNF-α, MCP-1 and IFN-γ in the supernatant were determined with an ELISA kit (Wanleibio, China, WLE05) following the manufacturer’s protocol. The concentration was determined based on the absorbance values on a standard curve. A higher concentration indicates a higher level of protein expression.
Statistical analysis
All statistical analyses were performed using GraphPad Prism 8 (GraphPad Software, La Jolla, CA, USA). Data were compared between two groups using an unpaired two-tailed Student’s t test and between multiple groups using a one-way analysis of variance followed by Tukey’s post-hoc test. Differences with a p < .05 were considered statistically significant. Data are expressed as the mean ± SD, unless otherwise indicated.
Results
Establishment of liver fibrosis and cirrhosis in mice treated with CCl4
To investigate the degree of liver injury in C57BL/6J mice treated with CCl4, a histopathological analysis was performed. H and E and Masson’s staining showed that CCl4 injection induced serious steatosis, inflammatory cell infiltration and fibrosis in the main block of mouse livers compared with the sham group from the fourth week and induced significant liver cirrhosis at 8 weeks (Figure 1(a) and (b)). Immunofluorescence (IF) staining (Figure 1(c)) showed that the expression of α-SMA in the liver increased gradually from the second week with CCl4 injection. Analysis of serum liver enzymes (Figure 1(d)) demonstrated that ALT and AST levels gradually increased from the second week and peaked at 6 and 8 weeks with CCl4 treatment. These results indicated that the mouse model of CCl4-induced liver fibrosis and cirrhosis was successfully established. Mice with liver fibrosis and cirrhosis were established with intraperitoneal CCl4 injection. (a) Haematoxylin and eosin (H and E)-stained liver sections from mice with CCl4 challenge at different time intervals and olive oil injection as shams. (b) Masson’s trichrome staining of mouse liver sections from different groups. (c) Immunofluorescence of α-SMA in mouse liver tissue from different groups. (d) Determination of serum liver enzymes ALT and AST. DAPI was used to stain nuclei (blue). *p < .05, **p < .01.
Hepatic lymphangiogenesis is present in liver fibrosis and cirrhosis
Following acute liver injury, new lymphatic vessels help to repair liver injury, whereas in chronic liver diseases, lymphatic vessel regeneration triggers an aberrant immune response.5,14 In this study, IF staining (Figure 2(a), (b) and (c)) revealed that the expression of lymphatic endothelial cell (LyEC) markers LYVE-1, podoplanin, and VEGFR-3 in the liver gradually increased from the second week with CCl4 treatment, with the expression being most significant at 8 weeks. Lymphatic vessel density and LVA were determined at different time intervals. Lymphatic vessel density was significantly higher in the second week group than that in the sham group and gradually increased over time, reaching peak levels in the sixth and eighth weeks; LVA presented a trend similar to that of LVD (Figure 2(d) and (e)). In Figure 2(f) and (g), the qPCR results revealed that the expression levels of podoplanin and VEGFR-3 increased from the second week of CCl4 challenge with the levels being most significant in the sixth and eighth weeks. The western blot results were consistent with those from the qPCR; i.e. podoplanin and VEGFR-3 protein levels gradually increased from the second week (Figure 2(h) and (i)). Therefore, we confirmed that liver fibrosis and cirrhosis are accompanied by the regeneration of liver lymphatic vessels. Hepatic lymphangiogenesis is present in liver fibrosis and cirrhosis. (a–c) Immunofluorescence of LYVE-1, podoplanin and VEGFR-3 in mouse liver tissues from different groups. DAPI was used to stain nuclei (blue). (d, e) Lymphatic vessel density (LVD) and lymphatic vessel area (LVA) assessment. (f, g) qPCR of podoplanin and VEGFR-3 in mouse liver tissues from different groups. The results are presented as the mean ± SD of triplicate samples from three repeats. (h, i) Western blot of podoplanin and VEGFR-3 proteins in the liver tissues of mice with CCl4 challenge and sham mice. β-actin was used as a sample loading control. Representative blots of three independent experiments are shown.
Liver M1 macrophages are involved in lymphangiogenesis during liver fibrosis and cirrhosis
The VEGF-C/VEGFR3 signalling pathway is essential for lymphangiogenesis.
15
In addition to the secretion of VEGF-C by macrophages, their polarization also influences the regeneration of lymphatic vessels.
3
To clarify the function of macrophages during liver fibrosis and cirrhosis, the macrophage phenotypes were analysed. The western blot results (Figure 3(a)) demonstrated that the protein level of VEGF-C in the liver was consistent with the degree of liver fibrosis and lymphangiogenesis, i.e. VEGF-C levels at 6 and 8 weeks were higher than those at other time points. IF staining (Figure 3(b)) showed that the number of liver macrophages (F4/80 + cells) increased as CCl4 treatment time increased, with the macrophage number was significantly higher at the eighth week compared with those of the other groups. To further analyse macrophage polarization during liver fibrosis and cirrhosis, IF and qPCR were performed to identify the subsets of macrophages in the liver. IF staining (Figure 3(c)) revealed that the number of M1 macrophages (CD86+ cells) was consistent with the degree of liver fibrosis and lymphangiogenesis. In contrast, M2 macrophages (CD206+ cells) were present at their highest numbers in the second week and then gradually decreased over time (Figure 3(d)). The mRNA levels of TNF-α, CD86, IFN-γ, and iNOS, which are markers of M1 macrophages, gradually increased with increasing CCl4 treatment time, whereas the levels of Arg-1, CD206, CD163 and IL-10, which are markers of M2 macrophages, were highest in the second week and then gradually decreased over time (Figure 3(e) and (f)). Liver M1 macrophages are involved in lymphangiogenesis during liver fibrosis and cirrhosis. (a) Western blot of VEGF-C proteins in the liver tissues of mice from different groups. β-actin was used as a sample loading control. Representative blots of three independent experiments are shown. (b–d) Immunofluorescence of F4/80, CD86 and CD206 in the liver tissue of mice with CCl4 challenge and olive oil injection. Images were obtained from different animals. DAPI was used to stain nuclei (blue). (e) qPCR analysis of TNF-α, CD86, IFN-γ and iNOS mRNA in the mouse liver tissues of different groups. The results are the mean ± SD from triplicate samples of three repeats. (f) qPCR analysis of Arg1, CD206, CD163 and IL-10 mRNA in the mouse liver tissues of different groups. The results are the mean ± SD from triplicate samples of three repeats. *p < .05, **p < .01.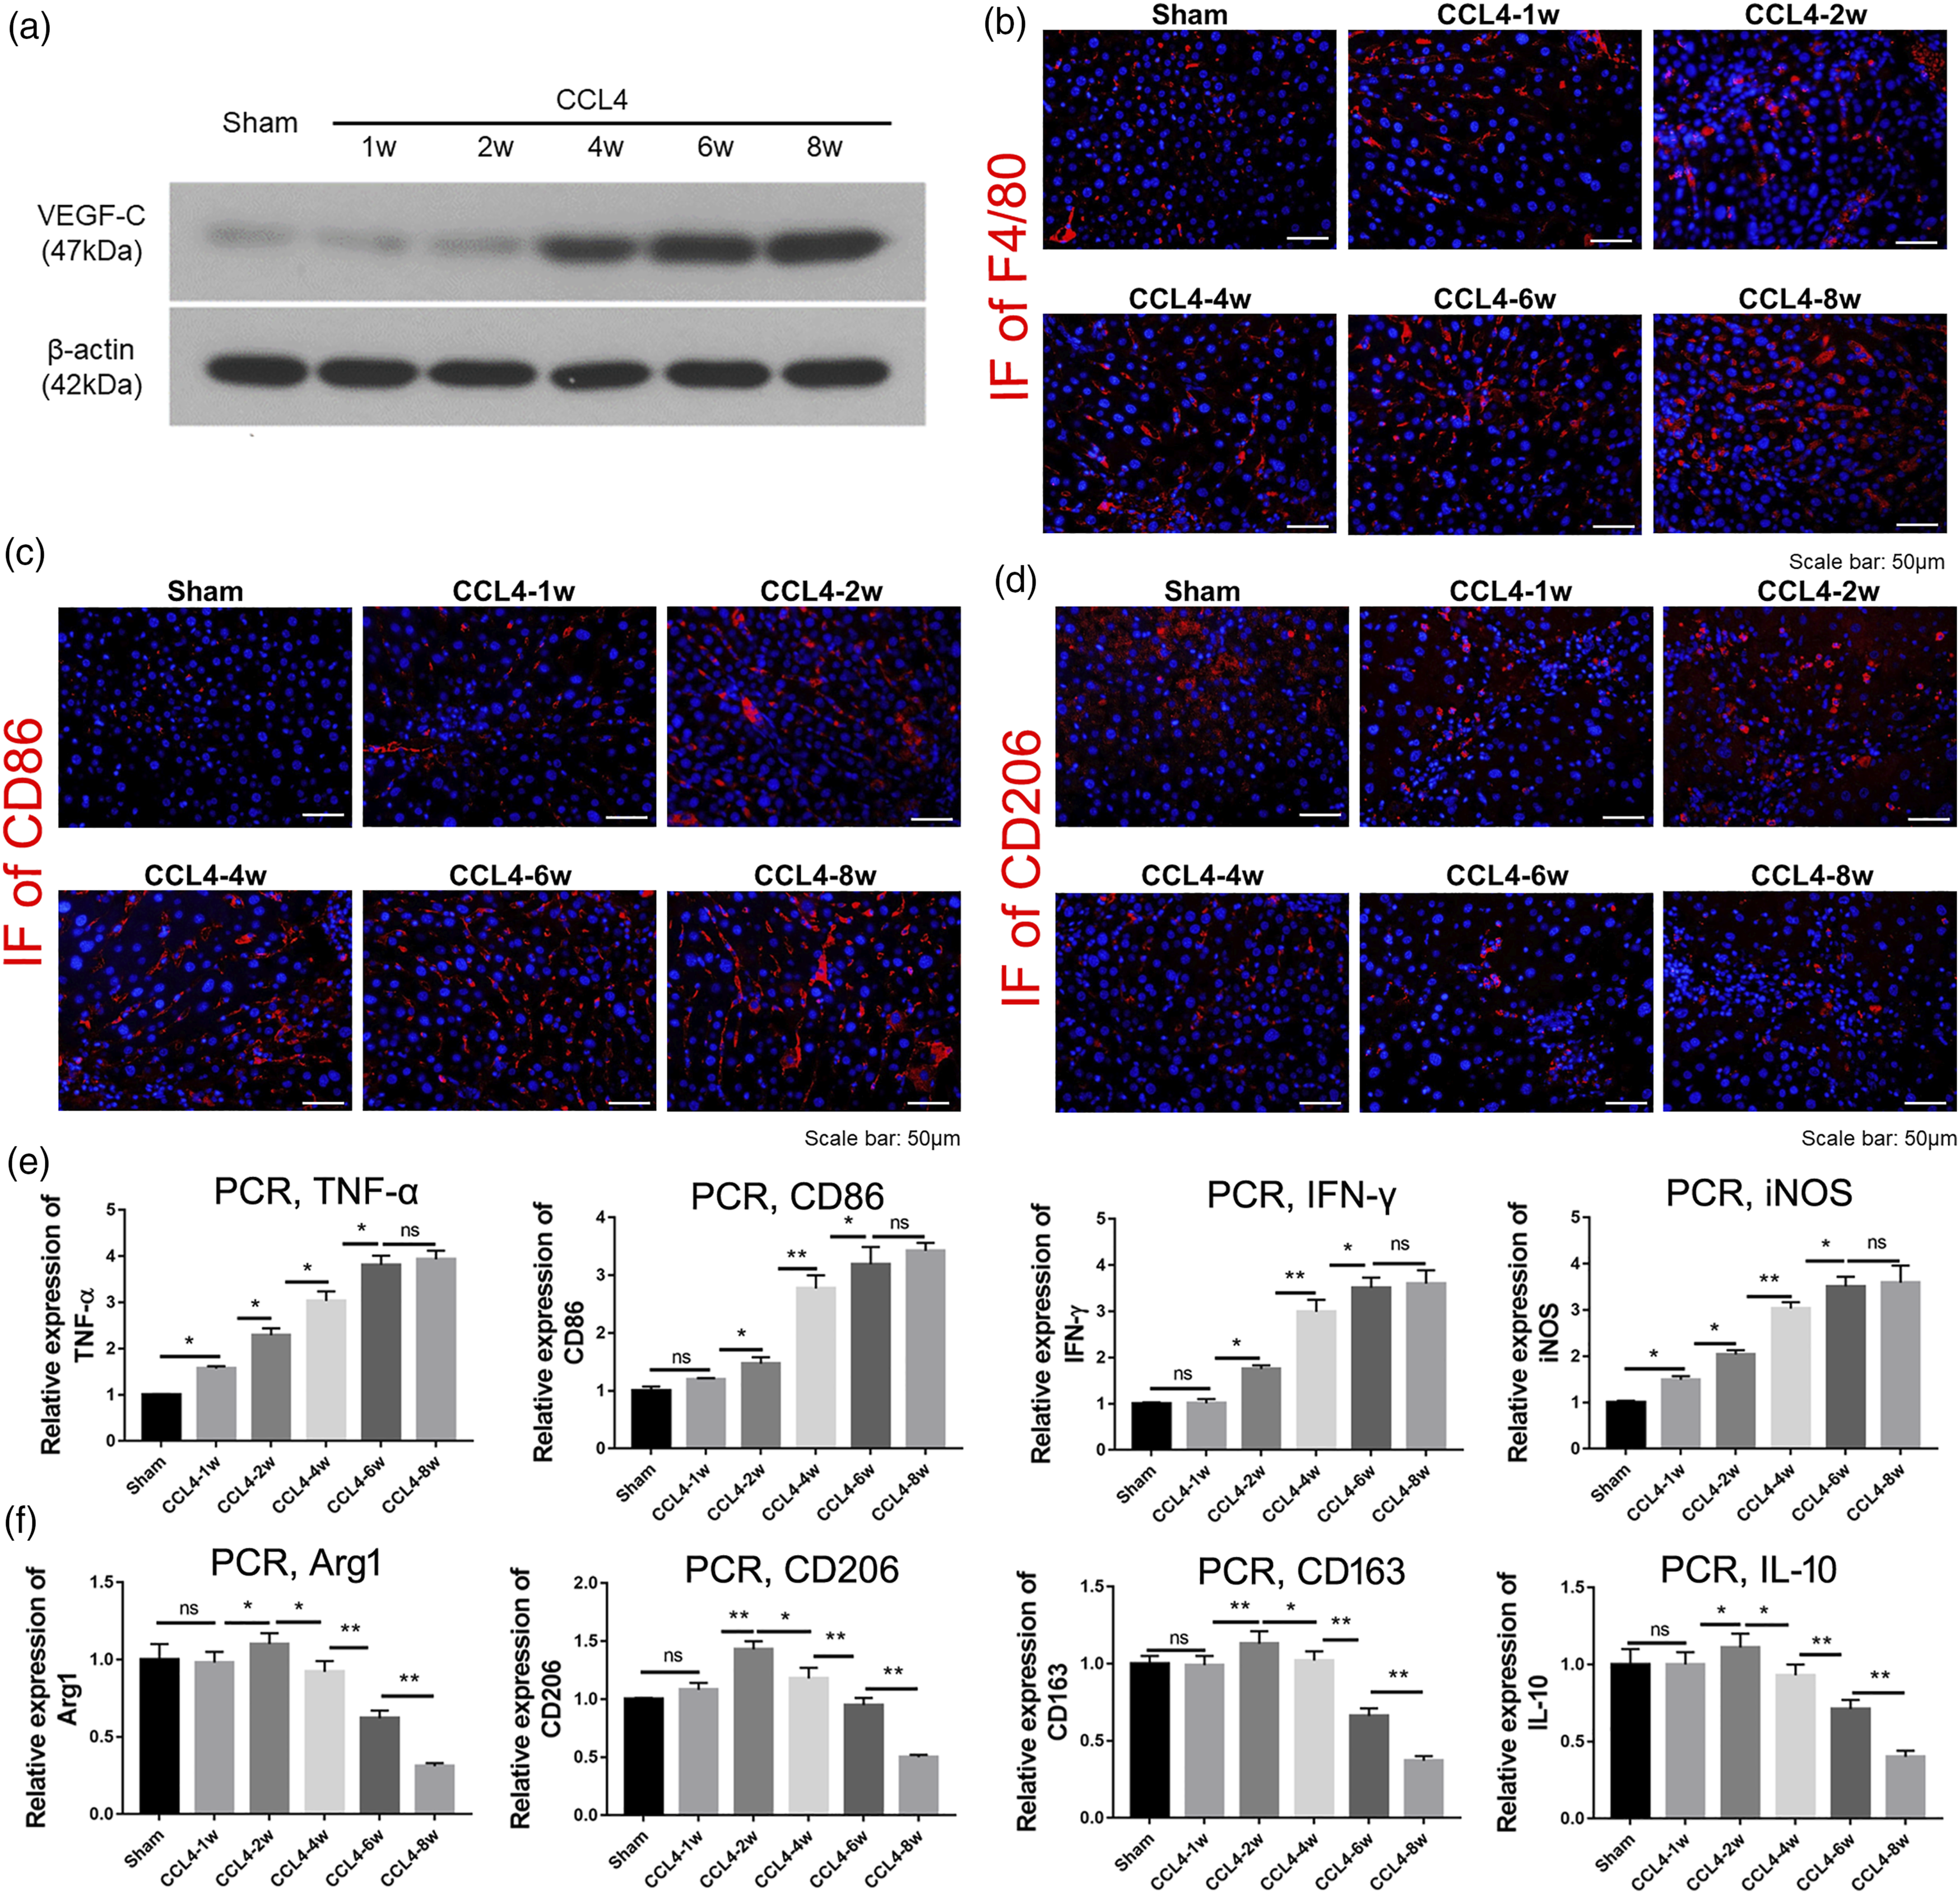
Peripheral macrophages are recruited to the liver during liver fibrosis
Liver macrophages mainly consist of native liver macrophages, i.e. Kupffer cells (KCs) and peripheral macrophages. However, few studies have identified the origins of liver macrophages during liver fibrosis. We observed the infiltration of macrophages into the liver by determining the liver and peripheral macrophage subsets in mice with liver fibrosis. The FCM results demonstrated that the proportions of liver M1 macrophages (F4/80 + CD86+ cells) were significantly higher in mice with fibrosis than those in sham mice, whereas there was no difference in M2 macrophages (F4/80 + CD206 + cells) between the two groups (Figure 4(a) and (b)). Further analysis revealed that some liver macrophages were derived from the peripheral blood (F4/80 + CD11b + cells and F4/80 + CCR2 + cells) and intestine (F4/80 + α4β7+ cells and F4/80 + CCR9 + cells); of greater interest was that the proportion of peripherally-derived macrophages increased significantly in liver fibrosis compared with that of shams (Figure 4(c), (d), (e) and (f)). By analysing the subsets of monocytes in peripheral blood, we found that monocytes expressing CCR2, CCR9 and α4β7 were significantly increased in fibrotic mice compared with those in sham mice (Figure 4(g), (h) and (i)). The qPCR and western blot results (Figure 4(j) and (k)) indicated that the ligand levels of CCL25 and MCP-1, corresponding to the chemokine receptors CCR9 and CCR2, and the ligand levels of VAP-1 and MAdCAM-1, corresponding to α4β7, were significantly higher in mice with fibrosis than those in sham mice. In addition, IF staining also verified that the liver expression levels of CCL25 and VAP-1 were significantly higher in mice with fibrosis than those in sham mice (Figure 4(l)). Peripheral macrophages are recruited to the liver during liver fibrosis. (a–f) Flow cytometry analysis of the proportions of different subsets of macrophages in the liver tissues from fibrotic and sham mice. (g–i) Flow cytometry analysis of the proportions of different subsets of monocytes in peripheral blood from fibrotic and sham mice. (j) q-PCR of CCL25, MCP-1, VAP-1 and MAdCAM-1 in mouse liver tissues from fibrotic and sham mice. The results are presented as the mean ± SD of triplicate samples of three repeats. (k) Western blot of CCL25, MCP-1, VAP-1 and MAdCAM-1 proteins in the liver tissues of mice from different groups. β-actin was used as a sample loading control. Representative blots of three independent experiments are shown. (l) Immunofluorescence of CCL-25 and VAP-1 in the liver sections of fibrotic and sham mice. Images were obtained from different animals. DAPI was used to stain nuclei (blue). *p < .05; **p < .01.
MiR-155-5p participates in macrophage M1 polarization during liver fibrosis
MiR-155-5p is an important regulator of immune cells and is involved in inflammation and immune regulation.
8
In this study, we discovered that the levels of miR-155-5p in the liver and peripheral blood increased with the degree of aggravation of liver fibrosis, and miR-155-5p was significantly elevated in all CCl4-challenged groups compared with that in the shams, with the highest levels at 6 and 8 weeks of intraperitoneal injection with CCl4 (Figure 5(a)). We found that the ability of M1 macrophages to express miR-155-5p was significantly higher than those of M0 and M2 macrophages, indicating that miR-155-5p was mainly released by M1 macrophages (Figure 5(b)). MiR-155-5p overexpression and inhibition were achieved by transfection of miR-155 mimic and inhibitor, respectively, to evaluate the effect on macrophage polarization. As shown in Figure 5(c), aberrantly high expression of miR-155-5p was confirmed in M0 (RAW264.7 cells) and M1 macrophages after mimic transfection. After treatment with IFN-γ/LPS, the mRNA levels of TNF-α, IFN-γ, MCP-1 and iNOS in macrophages transfected with miR-155-5p mimics were significantly increased; in addition, a similar trend in protein levels was also discovered with ELISA and western blot (Figure 5(c), (d) and (e)). The data demonstrated that miR-155-5p significantly promoted M1 macrophage polarization. MiR-155-5p participates in macrophage M1 polarization during liver fibrosis. (a, b) qPCR of miR-155-5p in mouse liver tissues and peripheral blood from different groups as well as miR-155-5p in M0, M1 and M2 macrophages. (c) qPCR of miR-155-5p in M0-and M1-type transfected macrophages. (d) qPCR analysis of TNF-α, IFN-γ, MCP-1 and iNOS mRNA in IFN-γ/LPS-treated macrophages transfected with different genes. (e, f) ELISA of TNF-α, IFN-γ and MCP-1 in cell supernatants as well as western blot of iNOS in cells from IFN-γ/LPS-treated macrophages transfected with different genes. The qPCR results are the mean ± SD from triplicate samples of three repeats. *p < .05, **p < .01. NC, control.
MiR-155-5p promotes M1 macrophage polarization through the SOCS1/JAK1-STAT1 pathway
SOCS1, a suppressor of cytokine signalling (SOCS), is a miR-155-5p target that regulates inflammation and immunity through the JAK-STAT pathway.16,17 As shown in Figure 6(a), we confirmed that SOCS1 recombinant plasmid transfection induced SOCS1 overexpression in RAW264.7 cells. Using qPCR and western blot, we discovered that SOCS1 siRNA3, designated SOCS1 siRNA, could be applied in the following experiments (Figure 6(b)). After miR-155-5p overexpression by transfection with miR-155-5p mimics, SOCS1 expression was dramatically inhibited, suggesting that miR-155-5p might target SOCS1. Subsequently, we determined that there was no significant difference in the mRNA levels of JAK1 and STAT1 in IFN-γ/LPS-treated macrophages, whereas p-JAK1 and p-STAT1 were significantly upregulated in the miR-155-5p mimic groups (Figure 6(c) and (d)). Furthermore, in miR-155-5p mimic-transfected macrophages, SOCS1 inhibition with siRNA significantly increased JAK1/STAT1 phosphorylation, but SOCS1 overexpression with plasmid cotransfection dramatically inhibited phosphorylation (Figure 6(c) and (d)). In contrast, when miR-155-5p was suppressed with miR-155-5p inhibitor transfection, miR-155-5p was inhibited, but SOCS1 was upregulated significantly compared with those in the nontransfection groups. In addition, SOCS1 expression increased significantly after cotransfection with SOCS1 recombinant plasmid, but the expression decreased significantly after cotransfection with SOCS1 siRNA in IFN-γ/LPS-treated macrophages (Figure 6(e) and (f)). JAK1/STAT1 expression was not significantly different in any miR-155-5p inhibitor transfection group, whereas p-JAK1 and p-STAT1 expression increased significantly in the miR-155-5p inhibitor and SOCS1 siRNA cotransfected group compared with those in the other transfected groups (Figure 6(e) and (f)). MiR-155-5p promotes M1 macrophage polarization through the SOCS1/JAK1-STAT1 pathway. (a) qPCR and western blot analysis of SOCS1 in RAW264.7 cells transfected with SOCS1 recombinant plasmid or control. (b) qPCR and western blot analysis of SOCS1 in RAW264.7 cells transfected with SOCS1 siRNAs or control. (c, d) qPCR of miR-155-5p, SOCS1, JAK1 and STAT1 as well as western blot of SOCS1, JAK1, p-JAK1, STAT1 and p-STAT1 in macrophages cotransfected with miR-155-5p mimics and SOCS1 recombinant plasmid or siRNA and induced with IFN-γ/LPS. (e, f) qPCR analysis of miR-155-5p, SOCS1, JAK1 and STAT1 as well as western blot analysis of SOCS1, JAK1, p-JAK1, STAT1 and p-STAT1 proteins in macrophages cotransfected with miR-155-5p inhibitor and SOCS1 recombinant plasmid or siRNA and induced with IFN-γ/LPS. The qPCR results are the mean ± SD from triplicate samples of three repeats. For western blot analysis, β-actin was used as a sample loading control, and representative blots of three independent experiments are shown. *p < .05, **p < .01. NC, negative control.
Discussion
Hepatic lymphangiogenesis, the mechanism involved in the development of lymphatic vessels, plays a critical role in regulating the immune response in liver diseases. 1 The area of the portal lymphatic vessels increases in liver fibrosis, which is associated with the degree of fibrosis and in turn causes an immune response during liver injury. 14 In our study, a mouse model of liver fibrosis and cirrhosis was established with intraperitoneal injection of CCl4; subsequently, hepatic lymphangiogenesis was observed during fibrosis and cirrhosis. More importantly, we found that lymphatic vessel regeneration was associated with liver fibrosis.14,18
Signalling by VEGF-C/VEGFR-3 is essential for lymphatic development 2 ; in addition, the increased expression of VEGF-C in the liver is correlated with the density of microvessels. 19 We clarified that the expression of VEGF-C markedly increased in mice challenged with CCl4 at weeks 6 and 8, indicating that the expanding lymphatic vessels were associated with VEGF-C. Lymphatic vessel abundance increases in chronic liver disease and is associated with areas of fibrosis and macrophage infiltration. 18 Similarly, we found that the number of liver macrophages increased as CCl4 treatment time increased, suggesting that there was a close relationship between the infiltration of liver macrophages and the progression of liver fibrosis and cirrhosis. Infiltrating macrophages at injured sites induce lymphangiogenesis by secreting VEGF-C. 5 Activation of VEGF-C signalling increases lymphangiogenesis and the number of macrophages, both of which might play roles during liver fibrosis and cirrhosis.
Previous studies identified that continuing M1 polarization of liver macrophages promoted the progression of liver injury.20,21 By analysing the subsets of liver macrophages, we found that macrophage polarization exhibited dynamic changes during liver fibrosis, with M1 macrophages being the main subset present during liver fibrosis. The phenotypes or subsets of macrophages determine the regeneration of lymphatic vessels. 4 In addition to the relationship between M1 macrophages and liver fibrosis, we noticed that M1 macrophage infiltration was also consistent with hepatic lymphangiogenesis. In line with this, M1 macrophages are involved in the development of lymphangiogenesis through activation of the VEGF-C/VEGFR3 pathway.3,22 Such interactions between lymphatic vessels and macrophages contribute to the immune system response to inflammatory stimuli. Consequently, lymphangiogenesis may influence tissue repair and immune cell infiltration during liver fibrosis.
Liver macrophages consist of ontogenically distinct populations designated as KCs and monocyte-derived macrophages. 23 By analysing the phenotypes of liver and peripheral macrophages, we discovered that peripheral blood-derived and gut-derived macrophages increased dramatically in mice with liver fibrosis compared with those in controls, illustrating that peripheral macrophages are recruited to the liver during liver fibrosis. Studies have demonstrated that liver macrophage recruitment and activation are major contributors to cholestatic liver injury; 24 gut-derived macrophage recruitment in the liver contributes to persistent liver injury through mechanisms such as enterohepatic circulation in liver diseases.23,25,26 More importantly, it is consistent with our results that during liver injury, peripherally-derived liver macrophages are mainly recruited from circulation through CCL2/CCR2, 27 and gut-derived macrophage recruitment in the liver depends on intestinal-specific CCR9/CCL25 and α4β7/VAP-1/MAdCAM-1.28,29 Splenic macrophages promote hepatic macrophage secretion of CCL2, which in turn facilitates monocyte recruitment and the establishment of an M1-dominant hepatic macrophage phenotype. 30 CCR9 and its ligand CCL25 contribute to the progression of nonalcoholic steatohepatitis and carcinogenesis in humans and mice. 29 VAP-1 expression is increased in the PSC and facilitates adhesion of gut-tropic lymphocytes to the liver endothelium in a substrate-dependent manner. 31 To date, novel strategies to treat liver diseases, including liver fibrosis, aim to target macrophages; these interventions modulate liver macrophage activation and recruitment (e.g. by inhibiting chemokine pathways such as CCR2/CCL2, VAP-1/MAdCAM-1/α4β7, and CCR9/CCL25) or macrophage polarization and differentiation. 32
MiR-155-5p has been shown to promote M1 polarization in macrophages by targeting various transcription factors and adaptor proteins. 9 In live diseases, miR-155-5p promotes the phenotype of M1 macrophages.10–12 We discovered that the levels of miR-155-5p in the liver and peripheral blood increased with the degree of aggravation of liver fibrosis, indicating that miR-155-5p was involved in the process of liver fibrosis. Consistent with the role of miR-155-5p in promoting the M1 macrophage phenotype, we found a higher baseline of M1 markers in macrophages transfected with miR-155-5p mimics compared with those in controls, in vitro. These results support the notion that miR-155-5p expression was altered in both liver tissue and circulation during liver injury, thus regulating liver damage, and miR-155-5p was involved in modulating M1 macrophage polarization in liver fibrosis.12,33
Using Gene Ontology (GO) and KEGG pathway enrichment analyses, the JAK/STAT signalling pathway was determined to participate in regulating macrophage polarization, and SOCS1 was identified as a target of miR-155-5p. MiR-155-5p is a proproliferative regulator in liver regeneration that acts by facilitating the cell cycle and directly targeting SOCS1, 34 and it induces an altered cell cycle through epigenetic modulation of the SOCS1/STAT3 pathway in respiratory injury. 35 In addition, inflammatory mediators induce miR-155-5p expression in intestinal myofibroblasts of patients with ulcerative colitis by downregulating the expression of SOCS1. 36 These results suggest that miR-155-5p and its target SOCS1 are involved in these diseases. In macrophages treated with IFN-γ/LPS, miR-155-5p downregulated the expression of SOCS1 and subsequently upregulated the phosphorylation of JAK1 and STAT1; conversely, antagonizing miR-155-5p upregulated the expression of SOCS1 and then inhibited the phosphorylation of JAK1 and STAT1. These results indicate that the SOCS1/JAK1/STAT1 pathway was involved in the macrophage M1 polarization regulated by miR-55-5p. In addition to the SOCS1/JAK1/STAT1 pathway, miR-155-5p regulates M1 polarization and includes other pathways such as the SOCS1/PD1/PDL1 and SOCS1/NF-κB as previously reported.37,38
Overall, our data suggest that hepatic lymphangiogenesis is present in mice with liver fibrosis and cirrhosis induced by CCl4, and that M1 macrophages are involved in lymphatic vessel development; interestingly, peripherally-derived macrophages are recruited to the liver during liver fibrosis. Additionally, our results indicate that SOCS1, a target of miR-155-5p, regulates macrophage polarization into the M1 phenotype through the JAK1/STAT1 pathway.
Conclusion
In summary, our data demonstrate for the first time that the miR-155-5p-SOCS1/JAK1/STAT1 signalling pathway participates in hepatic lymphangiogenesis in mice with liver fibrosis and cirrhosis induced by CCl4 by regulating the polarization of macrophages into M1.
Footnotes
Acknowledgements
We are very grateful to Dr. Ying-De Wang for providing language assistance, including writing assistance, organization, reading, and correction of this manuscript.
Author contributions
JB, JL and NS performed the experiments. JB, JL, XC and HW analysed the data. JB and JL drafted the manuscript. JM edited and revised the manuscript. JM and HT participated in the research design and confirmed the authenticity of all the raw data. All authors reviewed and approved the final manuscript.
Declaration of conflicting interests
The author(s) declared no potential conflicts of interest with respect to the research, authorship, and/or publication of this article: The authors declare that they have no competing interests.
Funding
The author(s) received no financial support for the research, authorship, and/or publication of this article: This work was supported by grants from the Natural Science Foundation of Liaoning Province (grant no. 20180530055).
Data availability
The datasets used or analysed during the current study are available from the corresponding author on reasonable request.