
Abstract
Exponential development in artificial intelligence or deep learning technology has resulted in more trials to systematically determine the pathological diagnoses using whole slide images (WSIs) in clinical and nonclinical studies. In this study, we applied Mask Regions with Convolution Neural Network (Mask R-CNN), a deep learning model that uses instance segmentation, to detect hepatic fibrosis induced by N-nitrosodimethylamine (NDMA) in Sprague-Dawley rats. From 51 WSIs, we collected 2011 cropped images with hepatic fibrosis annotations. Training and detection of hepatic fibrosis via artificial intelligence methods was performed using Tensorflow 2.1.0, powered by an NVIDIA 2080 Ti GPU. From the test process using tile images, 95% of model accuracy was verified. In addition, we validated the model to determine whether the predictions by the trained model can reflect the scoring system by the pathologists at the WSI level. The validation was conducted by comparing the model predictions in 18 WSIs at 20× and 10× magnifications with ground truth annotations and board-certified pathologists. Predictions at 20× showed a high correlation with ground truth (R 2 = 0.9660) and a good correlation with the average fibrosis rank by pathologists (R 2 = 0.8887). Therefore, the Mask R-CNN algorithm is a useful tool for detecting and quantifying pathological findings in nonclinical studies.
Introduction
With the development of medical imaging techniques over the past few decades, research has been actively conducted on diagnosis and prediction in the clinical field, using the data derived from imaging. 1 Artificial intelligence (AI) methods, including traditional machine learning and deep learning, have offered opportunities to apply medical imaging data, such as radiological and histopathological data, in clinical prediction to reduce the human effort in diagnostics. 2 Since the advent of deep learning, which uses convolutional neural networks (CNNs), computer vision techniques have enabled breakthrough developments in accuracy, which could not be accomplished by traditional machine learning. 3,4
There are 2 main tasks in image analysis where deep learning can be used. One is image classification, which treats each image as an identical category. The other is object detection, which refers to object localization and recognition. In addition to object detection, segmentation classifies the categories of images using pixel-level prediction. 5 Image segmentation has been widely used in the medical field, even before the advent of deep learning, using machine learning methods to detect and track medical instruments in surgical operations, 6 to analyze brains and their tumors from magnetic resonance imaging (MRI), 7 and to visualize colon crypts. 8 After the introduction of deep learning, the implementation of a fully connected network 9 and deconvolution 10 improved accuracy in more challenging segmentation techniques, such as instance segmentation. Instance segmentation can classify each pixel into its category and perform instance-wise segmentation simultaneously; therefore, it is trained to detect each object in an image. This progress has been applied successfully to pixel-level detection of pathological findings observed in highly magnified whole slide images (WSIs), such as those of mitosis, which can be an important indicator of tumor progression and/or malignancy 11 ; moreover, it has been used to discriminate nuclei between normal and pathological lesion. 12 Mask Regions with Convolution Neural Network (Mask R-CNN) is an instance segmentation algorithm. This algorithm performs the combined task of object detection, where the goal is to classify individual objects and localize each object using a bounding box (bbox), and semantic segmentation, where the goal is to classify each pixel into a fixed set of categories without differentiating object instances. 13 The Mask R-CNN algorithm has been recently applied to medical image data to detect lung nodules (using computed tomography images), 14 glomerulosclerosis (using images obtained from MRI), 15 breast cancer (using images obtained from ultrasound data), 16 and nuclei within cancer biopsies. 17
An application of AI for pathological analysis in nonclinical fields of medicine has recently been introduced. Previous studies applied the image classification method to analyze whether deep learning can achieve the pathologist’s grading accuracy in liver fibrosis using the rodent nonalcoholic steatohepatitis model 18 via a classification algorithm; moreover, these studies attempted to quantify hepatic fibrosis using segmentation in picrosirius red-stained slides. 19 Hepatic fibrosis occurs because of an abnormal and repeated tissue repair response generated as a result of multifactorial chronic liver injury, and its pathogenesis is associated with elevated levels of reactive oxidative stress caused by the metabolism and detoxification of drugs in the liver. 20 N-Nitrosodimethylamine (NDMA), a well-known carcinogen, has been administered to rats to induce hepatic fibrosis; this has been a good and reproducible animal model to investigate the early events involved in the pathogenesis of human liver fibrosis. This model has also been used to screen antifibrotic agents that could reverse fibrosis and arrest the progression of liver fibrosis to cirrhosis. 21 Although two segmentation algorithms (U-net 22 and Mask R-CNN 23 ) have been applied to biological samples, neither of the techniques has been applied to hematoxylin and eosin (H&E)-stained slides to detect rodent hepatic fibrosis. In a recent study on the detection of skin lesions and immune cells in immunofluorescence images, Mask R-CNN exhibited more precise segmentation than U-net. 24,25 Therefore, in the present study, we conducted instance segmentation of hepatic fibrosis via Mask R-CNN using the NDMA-induced hepatic fibrosis animal model to test whether instance segmentation by deep learning can be implemented for the detection of lesions for preclinical diagnosis.
Materials and Methods
Animal Treatment
Five-week-old male Sprague-Dawley (SD) rats (Crl: CD) were obtained from Orient Bio, Inc (Republic of Korea) and acclimatized for 5 days prior to study initiation. During the studies, the animals were kept in a room with controlled conditions (temperature 23 ± 3 °C and relative humidity at 30% to 70% on a 12-hour light/12-hour dark cycle with 150-300 lux, ventilation 10-20 cycles/h). A standard rat and mouse pellet diet (Lab Diet #5002 Lab Diet #5053 PMI Nutrition International; irradiated by γ-ray) was provided to the animals ad libitum (except where investigation requires otherwise), and microbial monitoring for diet was performed. The animals had ad libitum access to filtered, ultraviolet light-irradiated municipal tap water. The drinking water was analyzed every 6 months for specified contaminants in the Daejeon Regional Institute of Health and Environment. This experiment was approved by the Institutional Animal Care and Use Committee and conducted in an Assessment and Accreditation of Laboratory Animal Care accredited facility. Test animals were chosen randomly for the control and hepatic fibrosis groups and kept for 7 days before administering the drug.
NDMA was purchased from Wako (147-03781, 99.5% purity). NDMA (10 mg) was dissolved in 10 mL (13.5 mM) of sterile distilled water just before administration. To induce hepatic fibrosis, 10 mg/kg of NDMA was administrated to 6- to 7-week-old SD rats via intraperitoneal injection, 3 times a week for 3 weeks (total of 9 doses). After chemical administration, the test animals were killed using isoflurane, and the livers were collected in 10% neutral buffered formalin. After tissue collection, H&E staining was performed using paraffin-embedded left lateral and median lobes of the liver, and the sections were used for digital archiving.
Data Preparation
Whole slide images of the induced hepatic fibrosis liver sections were scanned using an Aperio Scanscope XT with a 20× objective using bright field illumination. The scan resolution was 0.5 µm per pixel and was saved as TIFF stripes with JPEG2000 image compression. The data preparation for hepatic fibrosis instance segmentation is described in Supplementary Figure 1. The WSIs at 10× magnification were cropped into 448 × 448 pixels of tile images, and all the cropped images were assessed by a pathologist to confirm that the images had apparent hepatic fibrosis. All the labeling was performed using the VGG Image annotator 2.0.1.0 (Visual Geometry Group, Oxford University, United Kingdom), and the annotation information was saved as a json file. Hepatic fibrosis was labeled along the borderline of the lesions, and the annotation lines were drawn as close to the lesion as possible to ensure distinction from normal cells. Blood vessels located inside the lesions were largely excluded for more accurate detection of the lesion. A total of 2,011 image tiles were obtained from 51 WSIs, and the lesions on these images were labeled for the training and testing of Mask R-CNN. The annotated image tiles were divided in the ratio of 7:2:1 for training, validation, and test data sets using the train_test split function embedded in the scikit-learn package. To increase the quality of the data set, the training data set was confirmed once again before the training, and data augmentation was conducted for improving training, as proven in the previous studies. 26 –28 The training data set was augmented 8 times using a combination of image augmentation techniques (reverse, rotation, and brightness). A total of 10,848 images were used for training, and 437 and 218 images were used for validation and testing, respectively.
Structure of Mask R-CNN Algorithm
All the procedures related to algorithm training, including data distribution, were performed using an open-source framework for machine learning (Tensorflow 2.1.0, 29 using Keras 2.4.3 backend) powered by an NVIDIA RTX 2080ti 11G GPU. Matterport Mask R-CNN 2.1 package was used for training, and its requirements were met in this study. 13,30 It is based on the feature pyramid network and ResNet101 backbone and generates bboxs and segmentation masks for each object in the image. Mask R-CNN was developed based on the object detection algorithm “Faster R-CNN.” Faster R-CNN, which inspired Mask R-CNN, consists of 2 stages. The first stage, called the region proposal network (RPN), proposes candidate object bboxs. The second stage extracts features using region of interest pooling (RoIPool) from each candidate box and performs classification and bbox regression. In Mask R-CNN, RoIPool is replaced with RoIAlign to predict pixel-accurate masks. The RoIPool first quantizes a floating number region of interest (RoI) to the discrete granularity of the feature map; however, this quantization may introduce misalignments between the RoI and the extract features, negatively affecting prediction of pixel-accurate masks. 13 RoIAlign uses bilinear interpolation 31 to compute the exact values of the input features at 4 regularly sampled locations in each RoI bin and aggregates the result using max pooling. Unlike Faster R-CNN, the Mask R-CNN architecture has a 2-stage procedure that includes RPN and RoIAlign while simultaneously predicting the class and box offset, and a binary mask prediction network is added for the binary mask for each RoI (Figure 1).
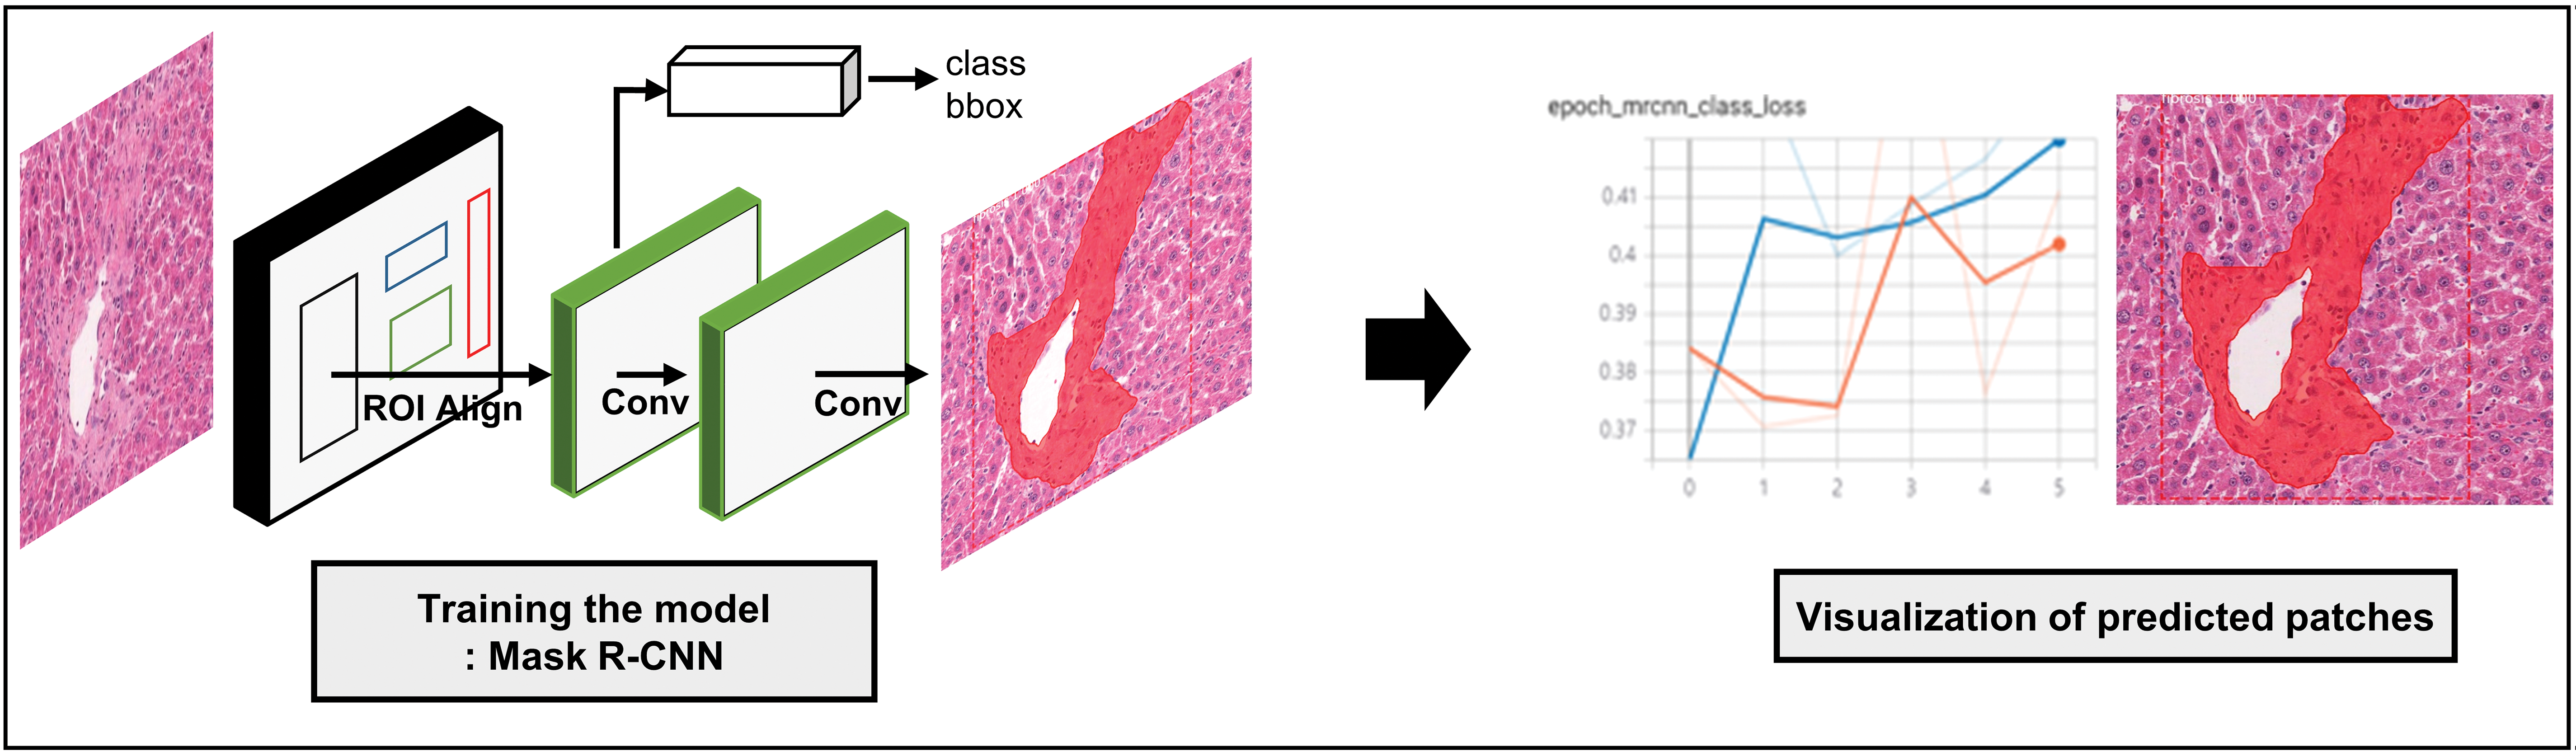
The network architecture of Mask R-CNN and segmentation example of hepatic fibrosis.
Training of Hepatic Fibrosis and Metrics for Model Performance
Hyperparameters
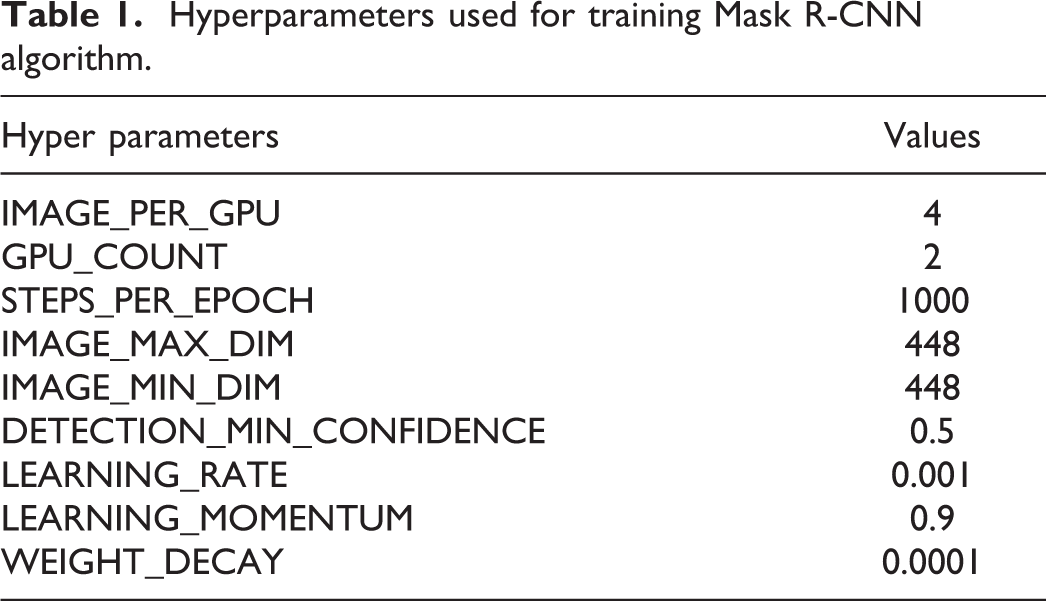
A total of 11,285 images were used to train the model and to validate rat hepatic fibrosis. The hyperparameters used during the training are described in Table 1. All the configurations, except the 5 parameters, were set as default defined by the Matterport package. The 5 parameters that were not set as default were customized to fit the hepatic fibrosis data set. Four images were simultaneously analyzed using IMAGE_PER_GPU, and 2 GPUs were used during the training. The image size was determined as 448 × 448 by IMAGE_MAX_DIM and IMAGE_MIN_DIM according to the tile image size. The threshold of instance classification accuracy, DETECTION_MIN_CONFIDENCE, was adjusted to 0.5.
Hyperparameters used for training Mask R-CNN algorithm.
Loss
The calculation of training and validation losses was performed as follows. Class (label), mask, and bbox losses observed during the training and validation were serialized using the tf.summary module and visualized by a tensorBoard. Class loss was calculated as the multiclass cross-entropy loss. The mask network only predicts whether each pixel belongs to the class by the sigmoid; therefore, the loss for the mask was determined by binary cross-entropy. In the case of bbox, a smooth L1 loss, which calculates the error between the prediction and ground truth, was used. Finally, Mask R-CNN loss (total loss) was calculated as the sum of losses including sparse softmax cross-entropy for label, smooth L1 loss for bbox, and binary cross-entropy loss for mask.
Metrics for model performance
To verify the model performance, mean average precision (mAP) was used. The mAP can be derived from the intersection of the union (IoU), precision, and recall values. The IoU value calculates the ratio of the overlaid area of the union of the predictions and the ground truth. In general, the true positive (TP) of each object detection is defined by an IoU value greater than 0.5. The precision or recall is determined as follows: the former is calculated by the ratio of TPs to all ground truths, and the latter is calculated by the ratio of TPs to total detections. Finally, the average precision (AP) was estimated by calculating the area below the precision-recall curves (Supplementary Figure 2) of each object in an image, and the mean AP was determined by the mean value of the sum of all the APs. Therefore, a higher mAP indicated a more accurate model. In this study, we used transformed mAP, which assumes an mAP value of 0 if there is any misprediction found in an image. From this transformation, we could analyze the error cases in more detail to investigate the cause of the correct and incorrect predictions as well as to evaluate the model performance more strictly.
Testing the Model Performance in WSIs
To test the algorithm performance in real-world data, we conducted a prediction test of the algorithm at the WSI level. Eighteen WSIs that were not used during the training were prepared for the test, consisting of 6 WSIs from the control group and 12 WSIs from the test group. The WSIs were scanned with a 20× objective using bright field illumination. Before the test, the fibrosis lesion including the connective tissue of each WSI was annotated by a board-certified pathologist as the ground truth to be compared with the prediction of the algorithm. After annotation, the annotated region area was calculated and transformed into a percentage of the liver section area. The WSI annotation and calculation of the annotated area were conducted using Aperio Image Scope version 12.4.0 (Leica Biosystems).
The prediction was performed using two magnification-scale images (10× and 20×). Each magnification image of WSI was divided into 448 × 448 pixels of tile images, and fibrosis was inferred using the trained algorithm. After the prediction ended, the cropped images with the prediction masks were merged into a WSI. The areas of prediction masks were calculated and transformed into the percentage of the liver section area to validate how well the algorithm predicted hepatic fibrosis compared to the ground truth data.
In addition, to test whether the algorithm can represent the pathologists’ diagnoses, the hepatic fibrosis rate and rank by the algorithm were compared to the pathologists’ grades. Four board-certified pathologists graded each WSI according to the Ishak hepatic scoring system. 32 The grades of the sample WSIs ranged from grades 0 to 5, and the pathologists also determined the rank of the fibrosis for each WSI. Finally, the average value of grade and rank by pathologists was compared.
Statistical Analyses
To prove that the algorithm can represent the pathologists’ diagnoses, the hepatic fibrosis rate and rank by the algorithm were compared to the average grades and ranks of pathologists’. Linear regression was applied for the correlations between the algorithm and pathologists. Statistical analyses were performed using GraphPad Prism (version 5.01 for Windows, GraphPad Software, www.graphpad.com).
Results
Training and Test of Hepatic Fibrosis by Mask R-CNN
To train the mask R-CNN network to identify hepatic fibrosis, a total of 10,848 annotated tile images, including the augmented samples, were used. During the training, total losses, including class, mask, and bbox, showed 2 times the elevation at epochs 60 and 120 (Supplementary Figure 3A). The incensement of the loss at these 2 points was due to the changing layer inherent in the algorithm for the effective training of the algorithm. In the validation case, the total loss steadily increased until the end. The last loss value, 3.5, is related to the validation mAP of 0.96 (Supplementary Figure 3B).
The mAP value of 0.95 was calculated using the testing results of 218 tile images with annotations. The mAP calculated here is a transformed value for stricter analysis and evaluation as the original calculated value of mAP was 0.96. Therefore, the model performance obtained from this study is outstanding. The algorithm successfully distinguished between the lesions and normal liver cells using image tiles and blood vessels. The predicted hepatic fibrosis lesions were comparable to the annotated lesions (Figure 2).
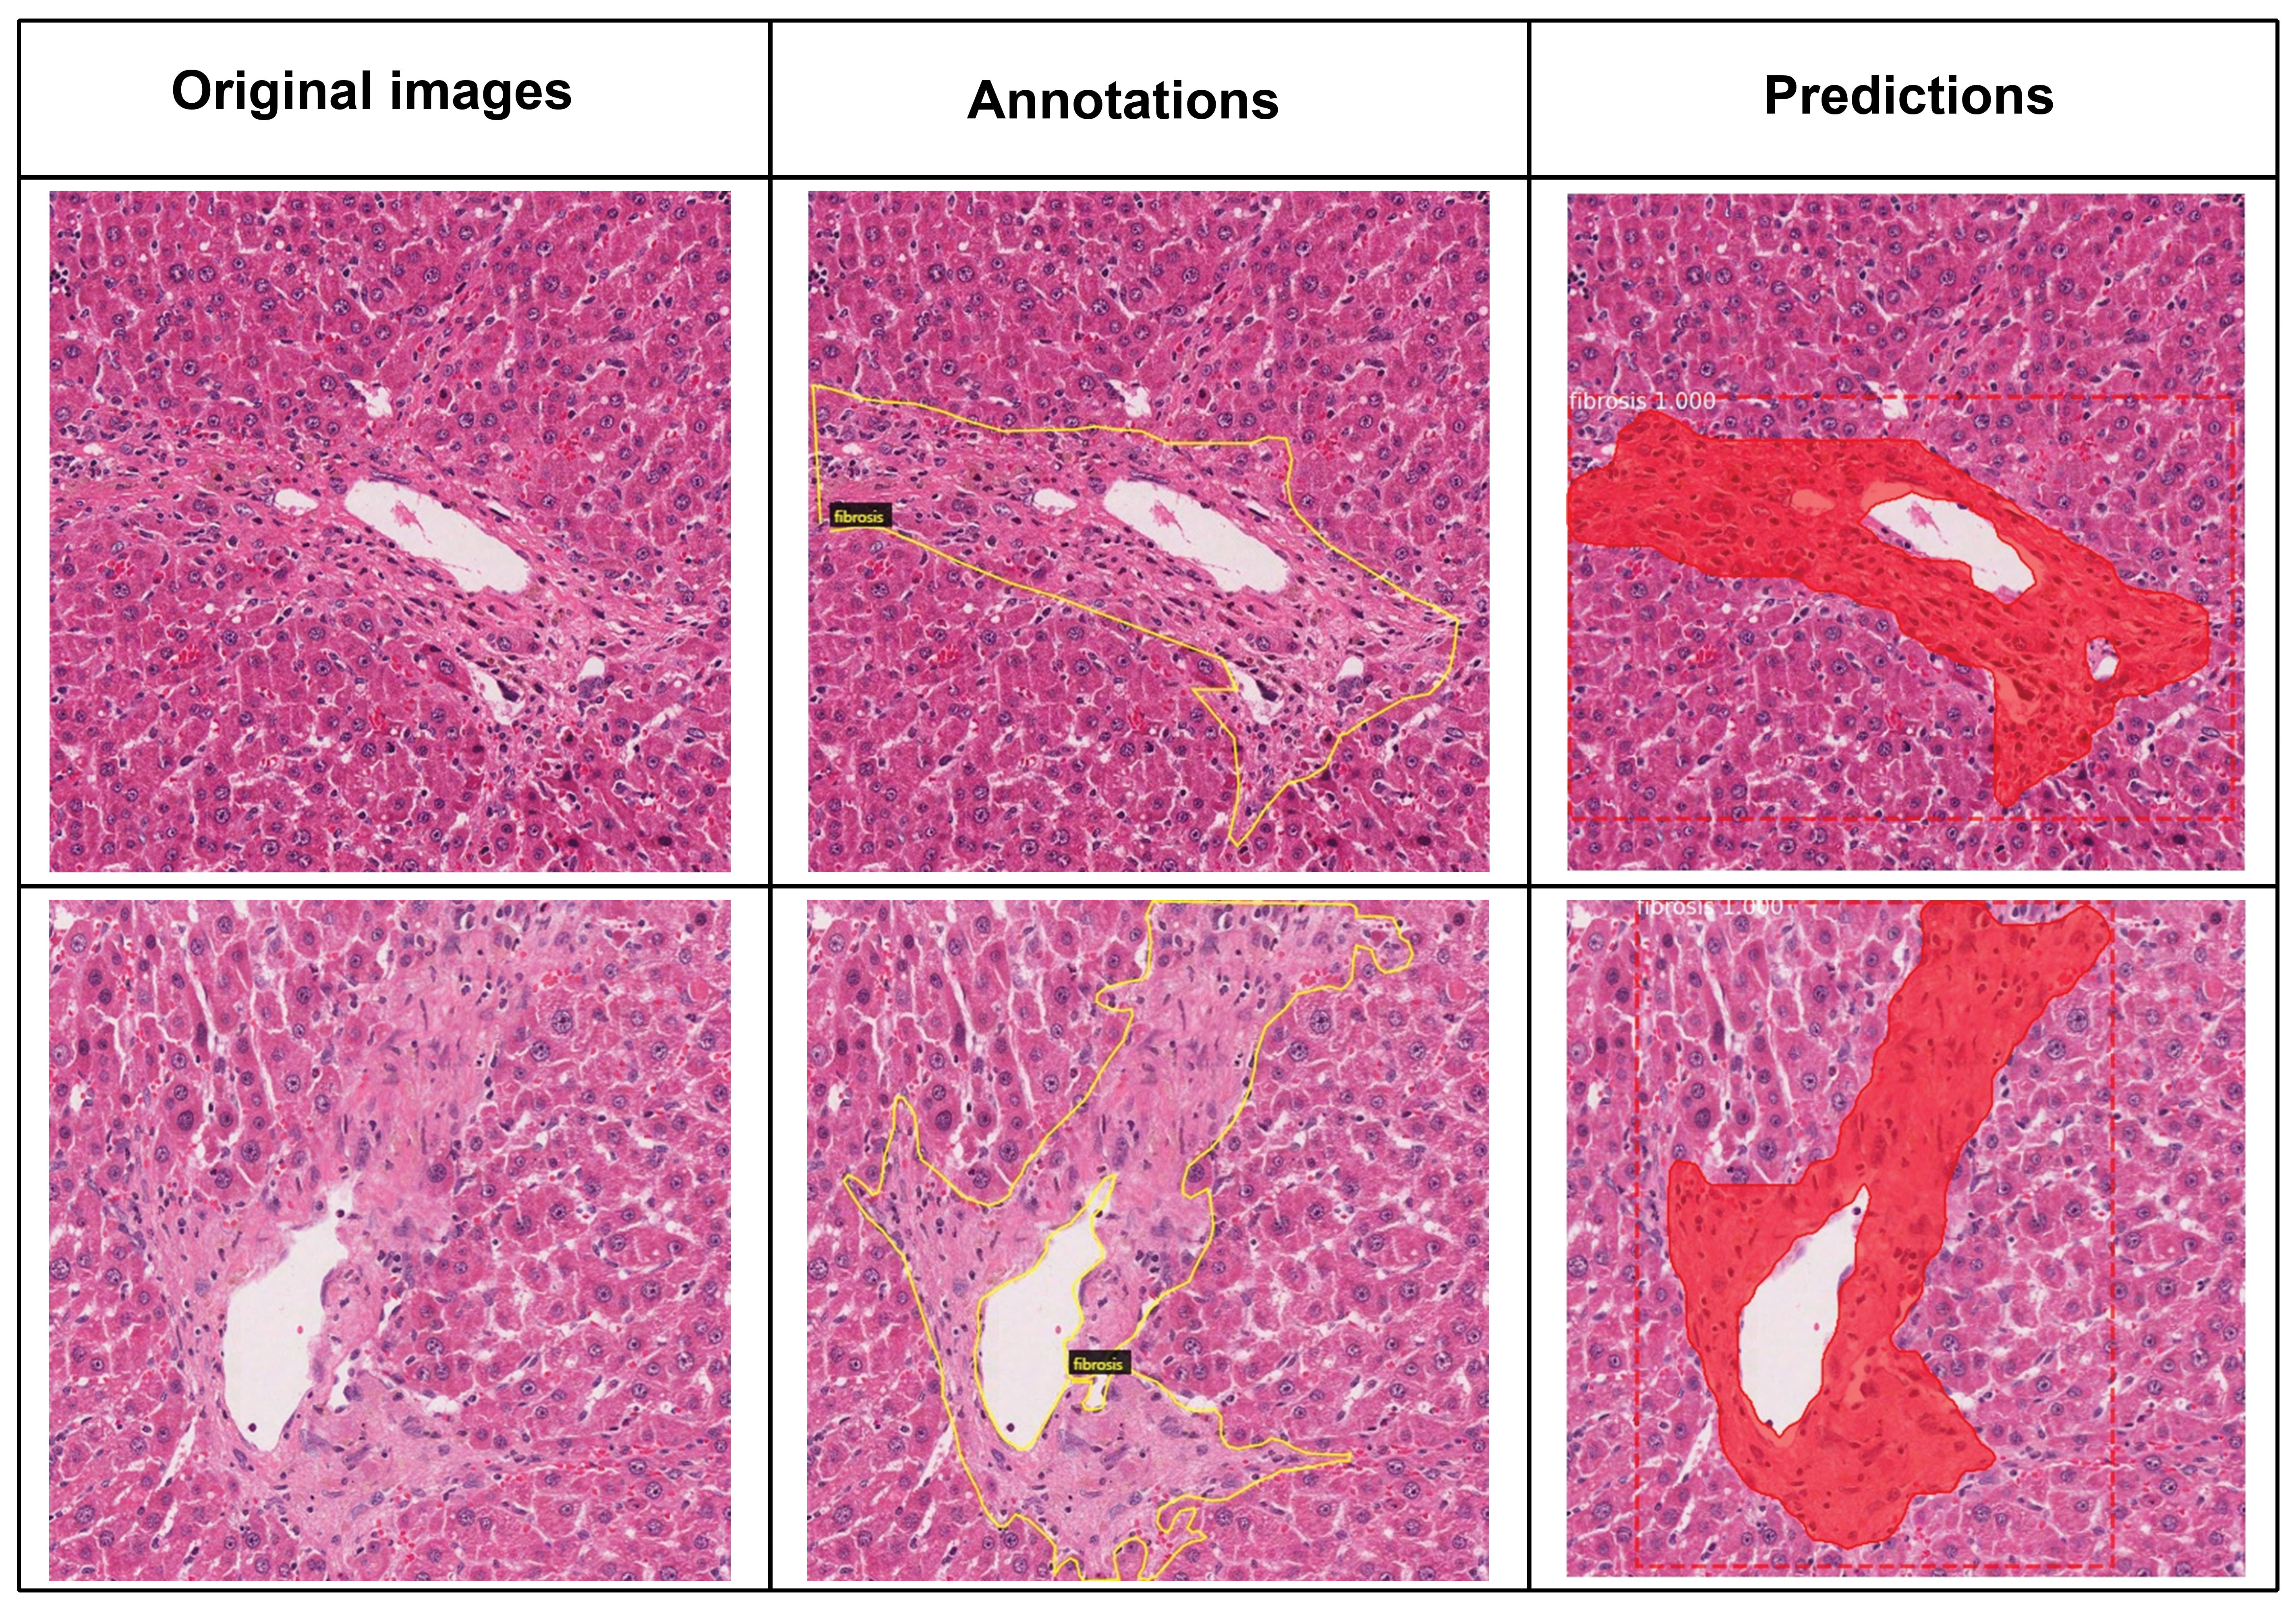
Instance segmentation test results for hepatic fibrosis trained using the Mask R-CNN model. The model performance showed 95% of mAP. The left column shows the original image tiles before annotation, the middle column shows annotated images outlined with a yellow line. The right column shows the predicted area of fibrosis determined by Mask R-CNN. Dashed lines were drawn using the left, top, and right bottom points of predictions, and segmentations were depicted in red. mAP indicates mean average precision; Mask R-CNN, Mask Regions with Convolution Neural Network.
In addition to high accuracy, we identified 5% error cases from the test. We confirmed all the cases of errors to obtain a higher accuracy for further studies. We found 4 patterns from these errors and defined them as type 1 to 4 errors. Type 1 and 2 errors were defined according to the transformed mAP definition that the detection results were not matching the ground truth annotation. Type 1 error: the correct lesion was detected but 2 lesions were recognized as 1. Type 2 error is the opposite case of type 1 error, wherein the correct lesion was detected but 1 lesion was recognized as 2 (Figure 3). Half of the errors belonged to these 2 types. Type 1 and type 2 errors can be considered as correct predictions; however, this was not reflected in mAP.
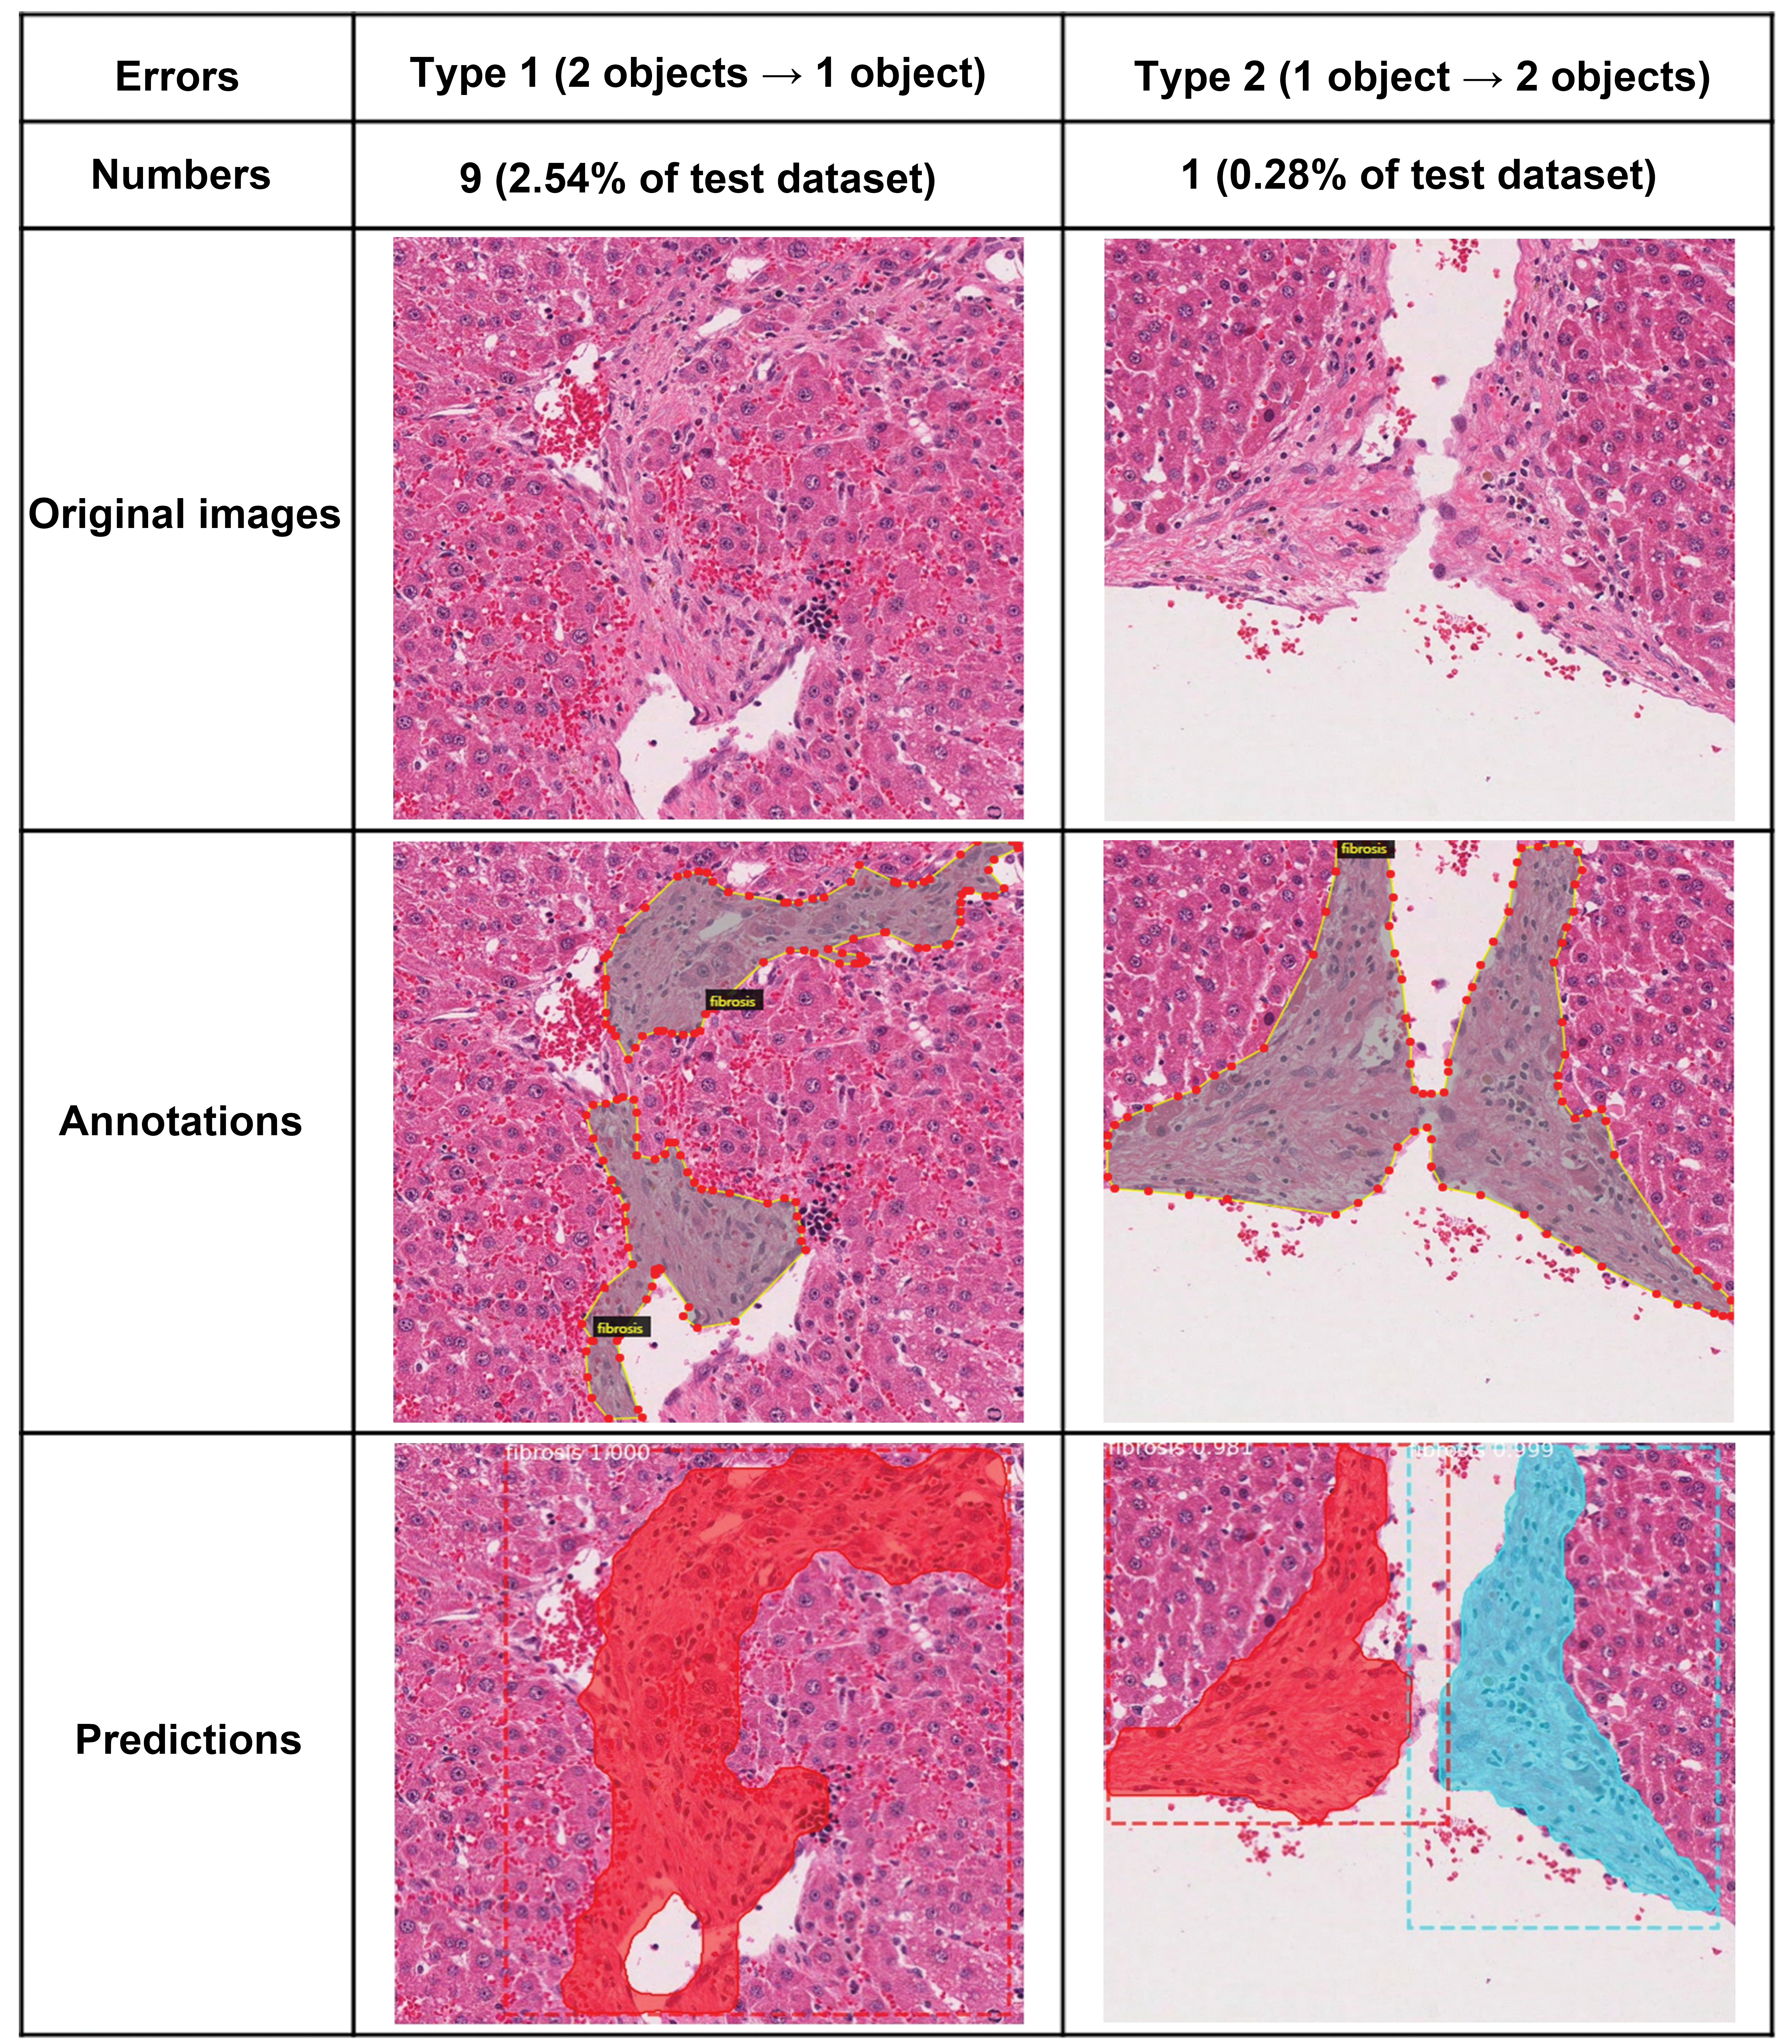
Type 1 and type 2 errors observed from the test. These errors can be assumed as correct detection cases.
Type 3 and 4 errors were classified according to the minimum detection confidence assigned in the hyperparameters when operating the algorithm. The minimum detection confidence is a threshold for accuracy. We set this parameter as 0.5 to detect as many lesions as possible and the test results in which confidence was below 0.5 are classified as errors. Type 3 errors comprise incorrect predictions, compared to the ground truth, owing to confusing labels; this was the second most frequent type of error in the test (Supplementary Figure 4). Confusing label means that the annotations did not perfectly cover the lesions in an image or were confused with the normal cells; therefore, they needed to be confirmed. This result implies that exact and precise lesion annotation is the most important factor for higher accuracy of the algorithm test. Type 4 errors were caused by complex labels and were a result of the failure of the algorithm to detect the exact area of the lesion at the confidence level (Supplementary Figure 4). However, even the pathologists had difficulty separating the lesion from the normal hepatic cells in these original image tiles; therefore, it would be fastidious for the algorithm. On including the type 1 and type 2 errors, which were comparable with the ground truth, the accuracy might be estimated as 0.97. It is known that the human error level for classifying an object is 5%. If we supplement the metric calculation method that classifies type 1 and 2 errors as correct, the model performance would be comparable to human error.
Model Accuracy at the Whole Slide Level
To validate the model performance at the whole slide level, we tested the trained algorithm to predict hepatic fibrosis from 18 WSIs, which were independent of the data set. The test was operated at 2 magnification scales, 10× and 20×. The results showed that the model prediction at 20× was more similar to the ground truth determined by a board-certified pathologist, although the model was trained based on the images from 10× magnification. The predictions from the 20× scale detected more lesions that were not predicted in the 10× scale (Figure 4, yellow boxes). The fibrosis rate inferred by the model at the 20× scale showed a high correlation with the ground truth (Figure 5A, R 2 = 0.9660). In the case of prediction results at the 20× scale, the fibrosis rank coincided with the ground truth (Figure 5B, R 2 = 0.9834).
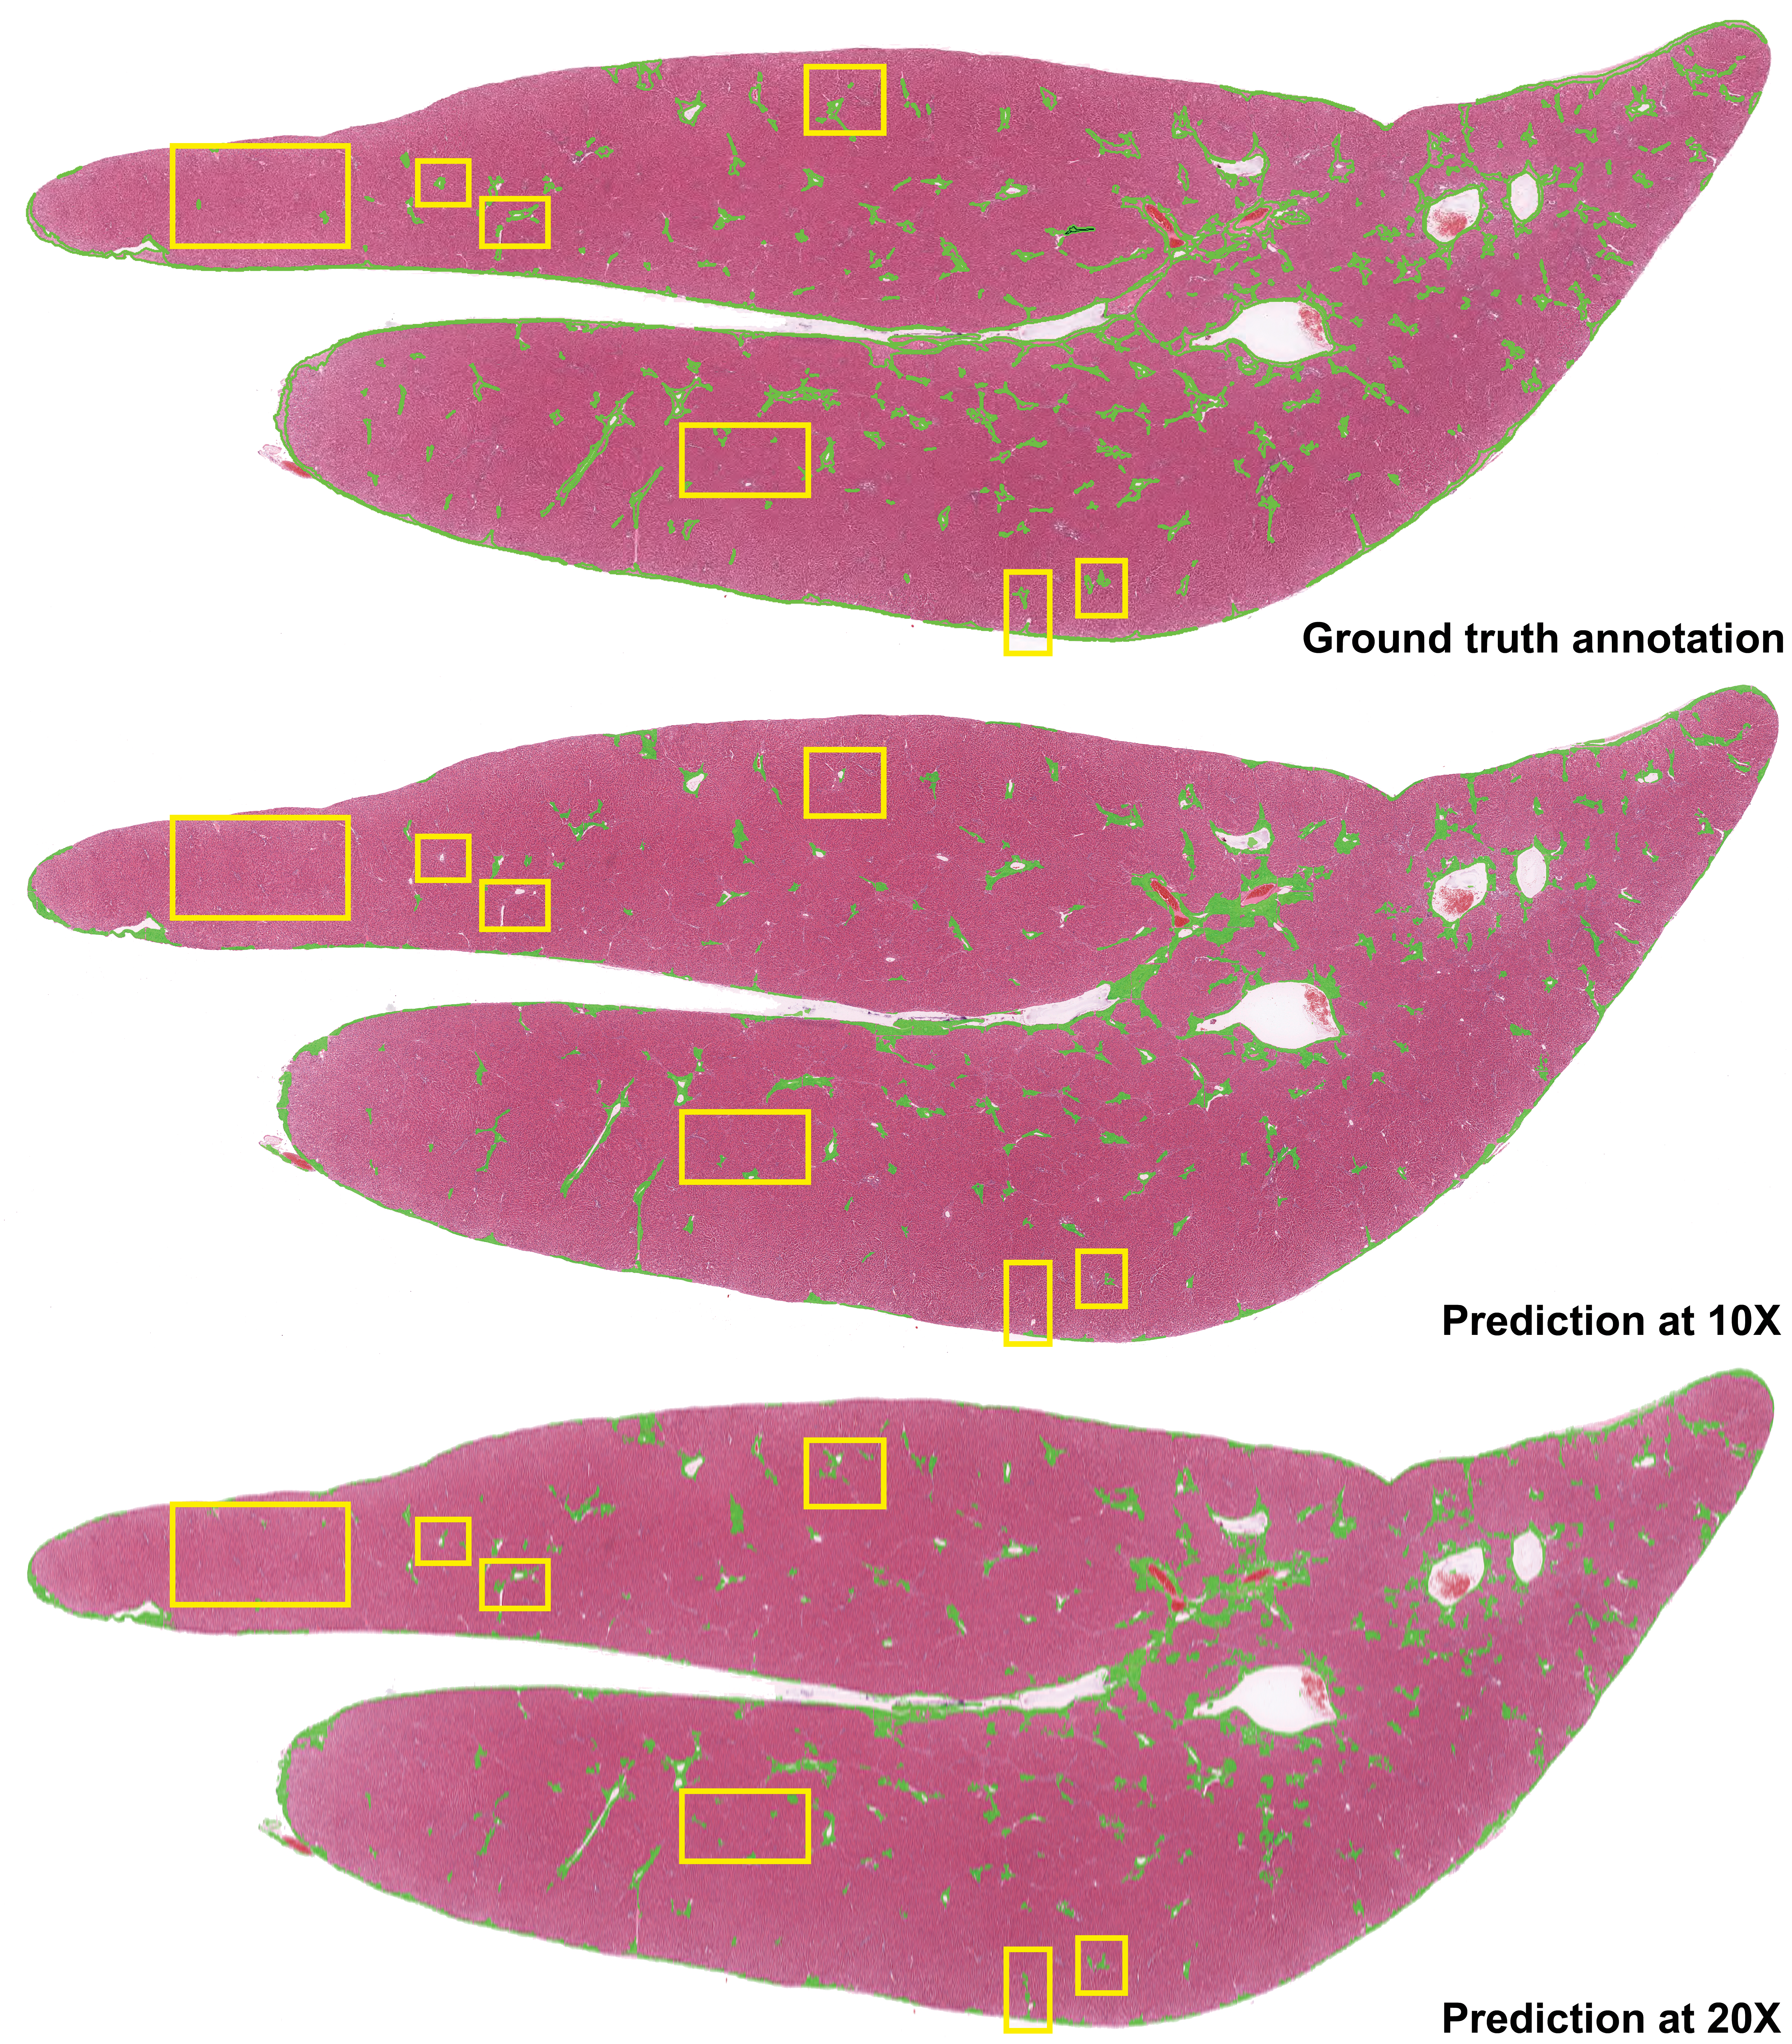
The ground truth annotation by a board-certified pathologist (top) and WSI level detection results of fibrosis lesion from two magnification scales images by Mask R-CNN (middle and bottom). The differences between the predictions and ground truth were marked by yellow boxes. Mask R-CNN indicates Mask Regions with Convolution Neural Network; WSI, whole slide image.
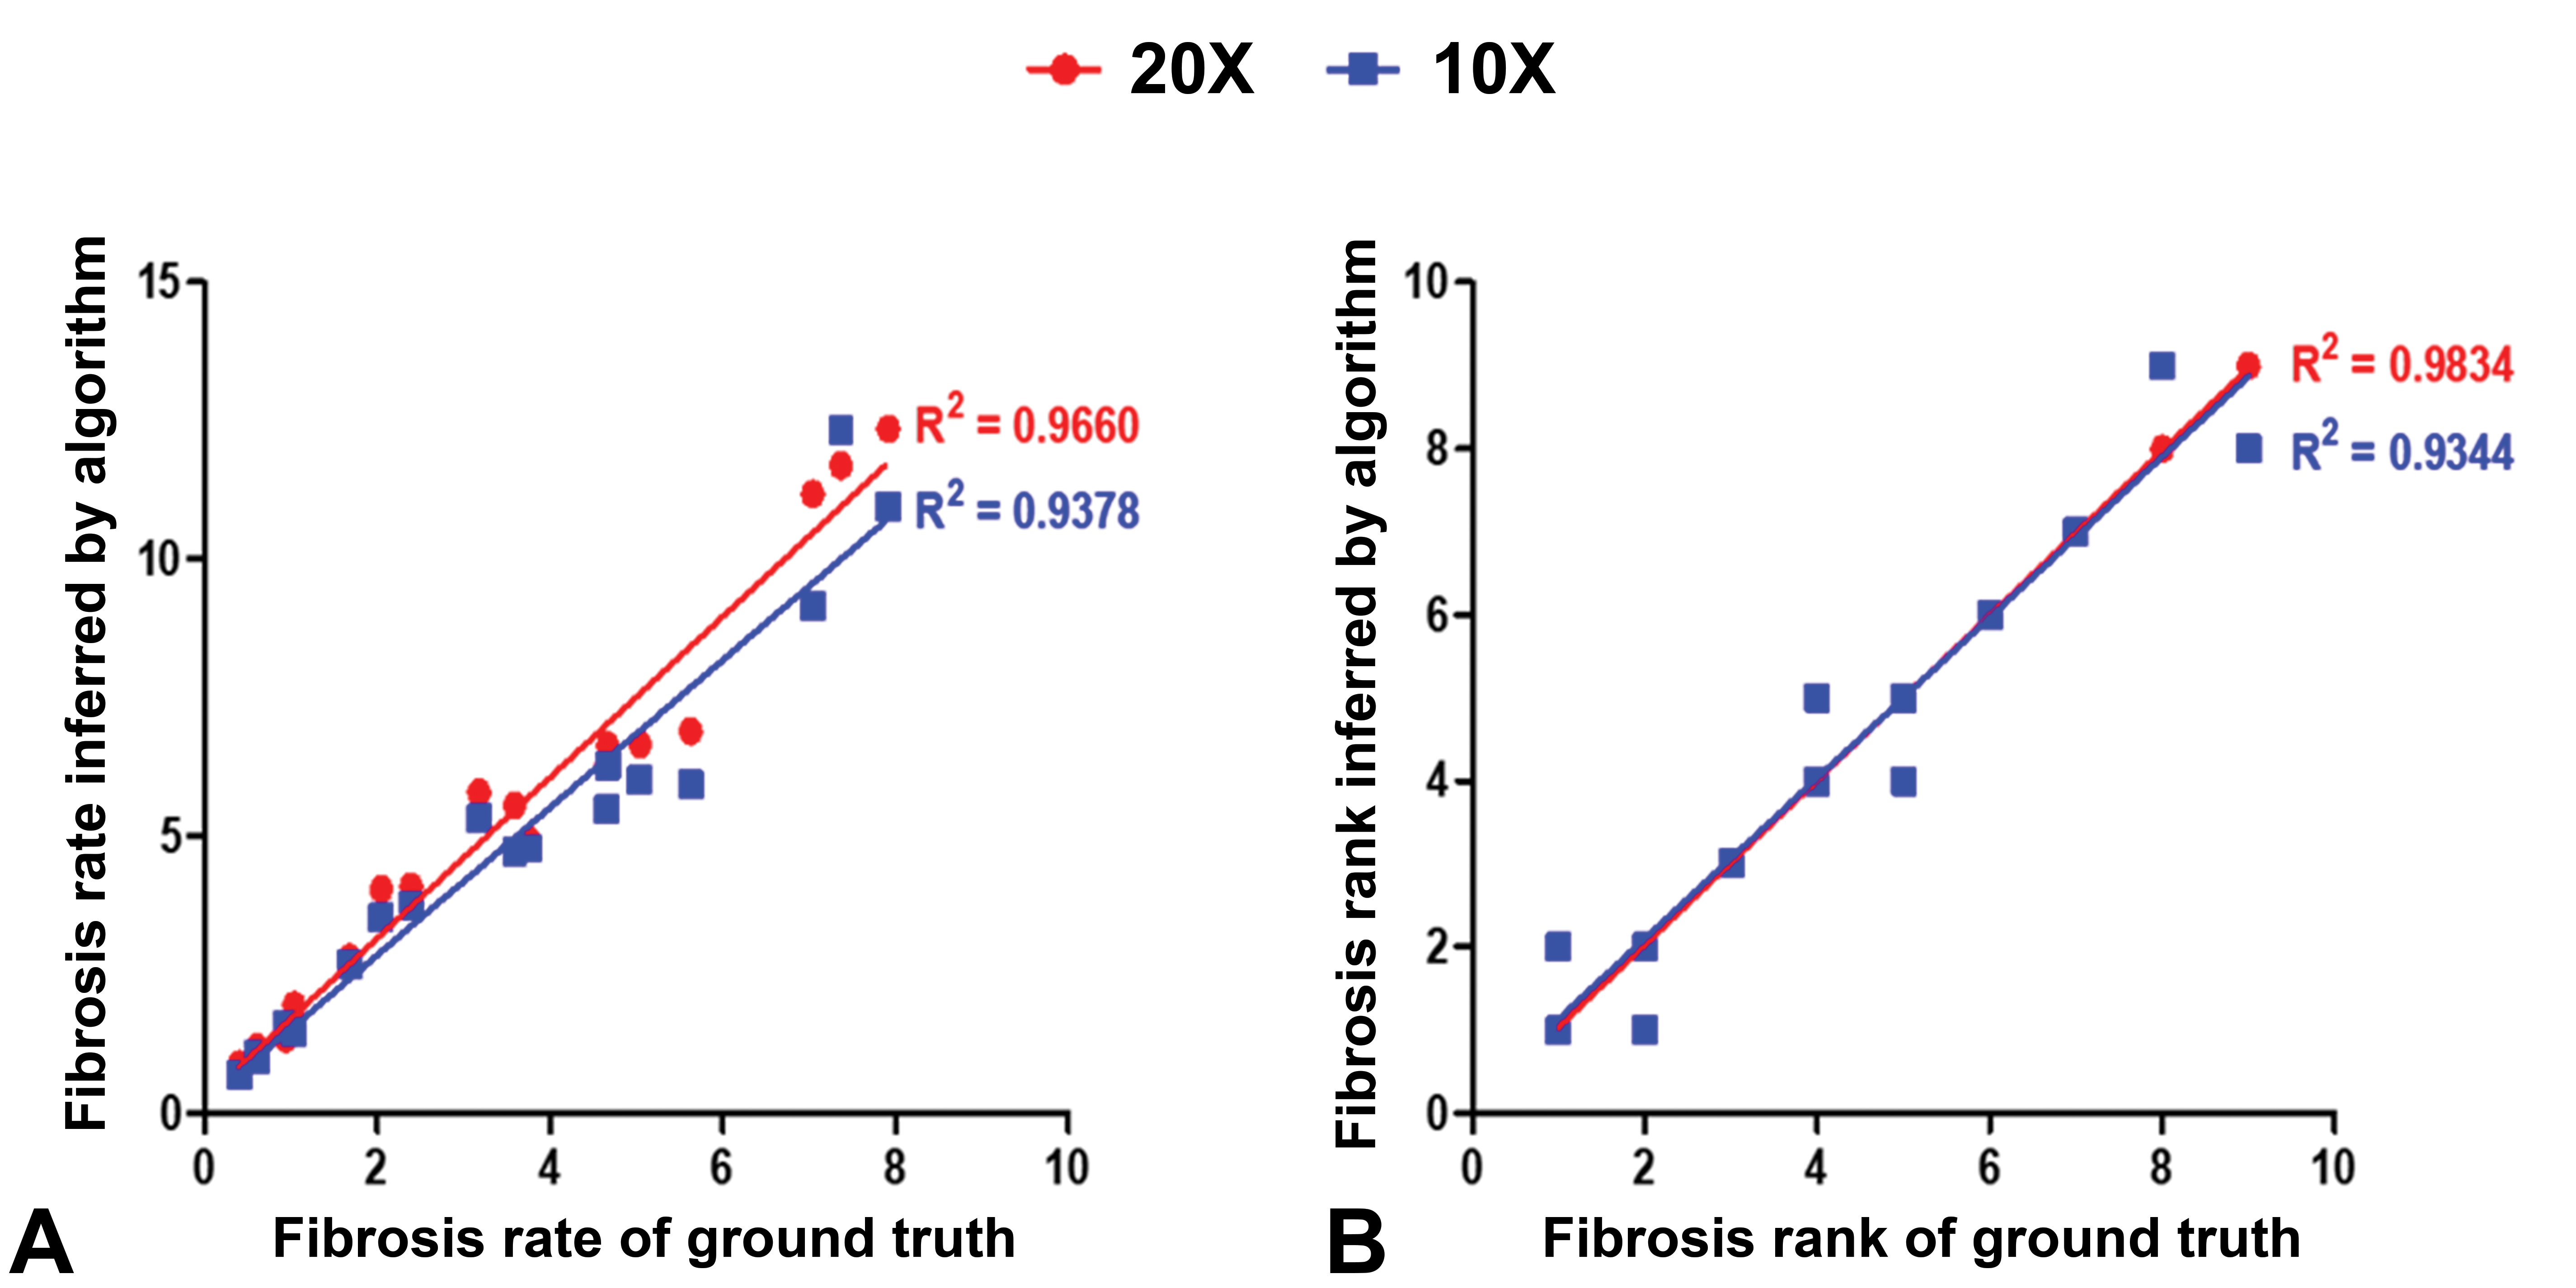
Correlations between fibrosis rate of ground truth and its value inferred by the algorithm (A). Correlations between fibrosis rank of ground truth and inferred rank by the algorithm (B). The red and blue dots represent 20× and 10× magnification, respectively.
After validating the algorithm with the ground truth, we tested the possibility of the algorithm representing the pathologists’ diagnoses. The two parameters, fibrosis ratio and rank by the algorithm, were compared with the average grade and rank determined by pathologists using linear regression. The sample WSIs’ grades ranged from 0 to 5, although they were differently assigned according to the pathologists. Thus, using the average grades of each slide, we analyzed the hepatic fibrosis rate distribution according to the grades before comparing the correlations between the pathologists and the trained algorithm. The result showed that the algorithm tended to predict a greater fibrosis rate than the ground truth, however, the increscent trends according to the grades were similar (Supplementary Figure 5). The correlations between the average grades of the pathologist and the fibrosis ratio determined by the algorithm were lower than those between the algorithm and the ground truth (Figure 6A). The linear regression coefficients between the two magnification scales showed that 20× was rated higher than 10×. The correlations of the rank inferred by the algorithm and the average rank assigned by pathologists had better linear regression coefficients as compared to the grades (Figure 6B). We supposed that the minor numerical differences in the fibrosis ratios between the slides made the pathologists grade them differently. This might have caused the low correlations between the model and the ground truth.
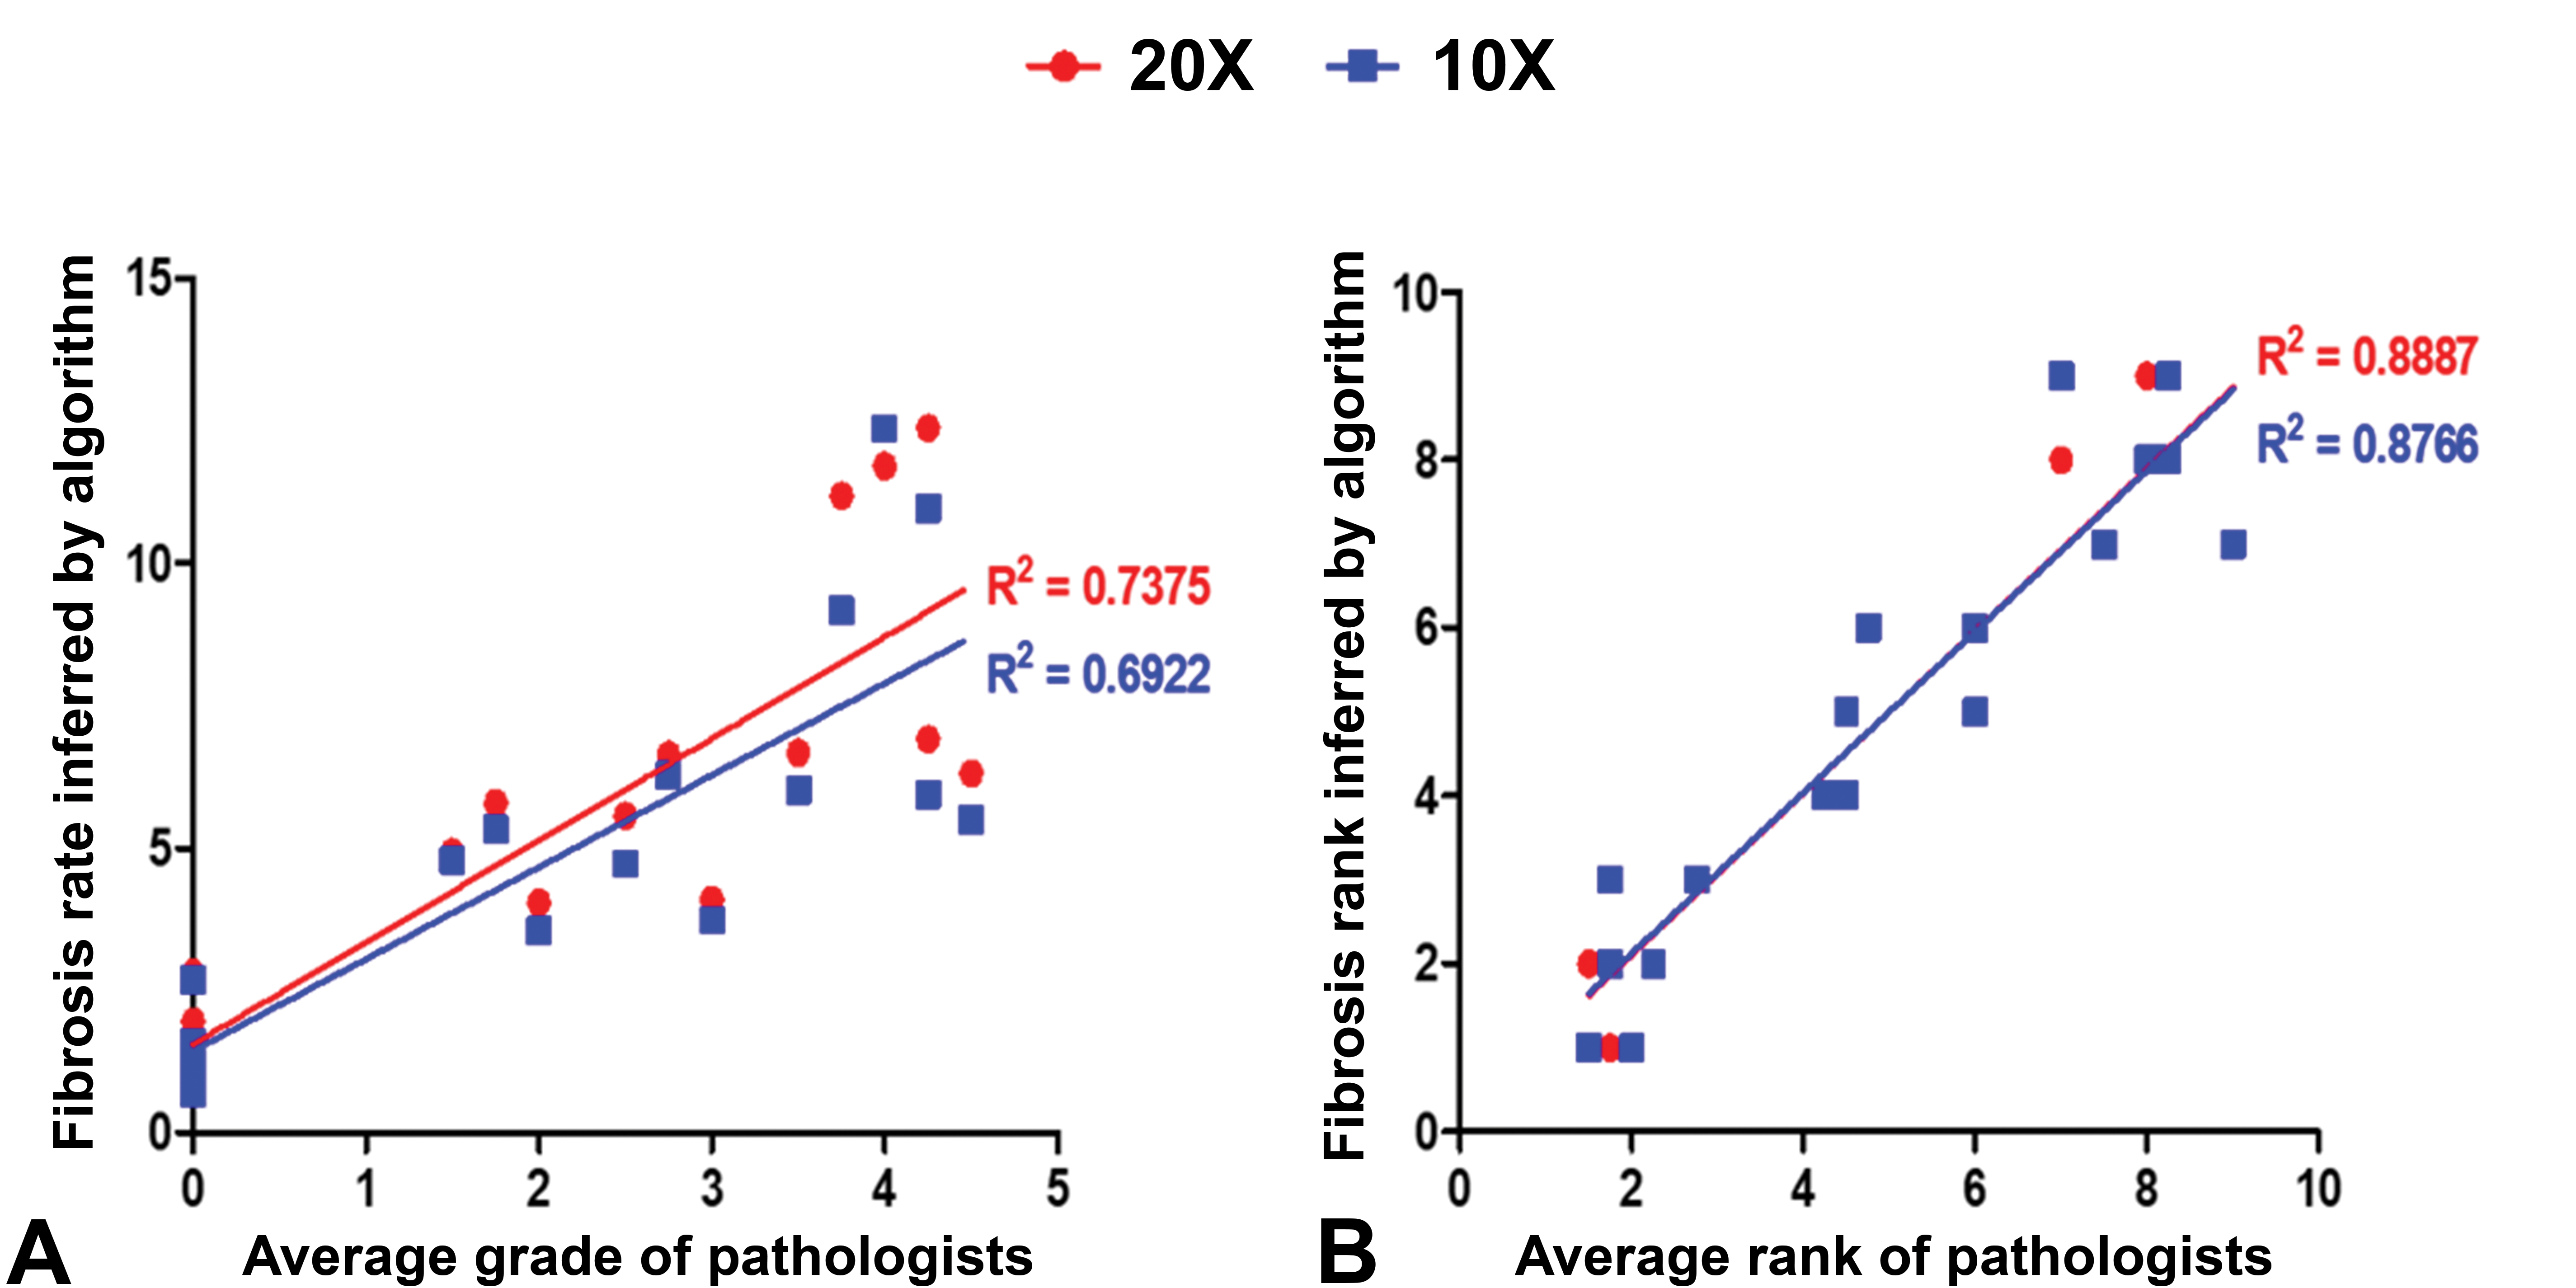
Correlations between average grade of pathologists and fibrosis rate inferred by the algorithm (A). Correlations between average ranks by pathologists and inferred rank by the algorithm (B). The red and blue dots represent 20× and 10× magnification, respectively.
Discussion
Few studies have investigated hepatic fibrosis in animal models using deep learning. Heinemann et al 18 used a classification algorithm that determined the grade (0-4) of hepatic fibrosis lesions based on tile images. The classification accuracy for fibrosis was 86.3%, and Cohen κ, which indicates the agreement between the deep learning-based approach and the ground truth, was 0.81. This result indicated the possibility of implementing deep learning in preclinical studies; however, the accuracy was not satisfactory. A recent study showed automated quantification of liver fibrosis in mice using a segmentation algorithm, U-net, with two magnifications (10× and 40×) of picrosirius red-stained slide images. 19 The study showed a relatively high F1 score (0.8775), which is a value for evaluating model performance, similar to mAP, and a higher correlation with pathologists’ diagnoses at high magnification than with low magnification. Unlike previous studies, we conducted pixel-level detection of hepatic fibrosis in H&E-stained slides obtained from SD rats using the deep-learning instance segmentation algorithm, Mask R-CNN. The trained algorithm exhibited an accuracy of 0.95, which is the highest value compared to the previous studies that aimed to detect hepatic fibrosis during the test. Considering type 1 and type 2 errors, which were comparable with the ground truth, the accuracy might be estimated as 0.97. Thus, our model exhibits the highest accuracy for detecting hepatic fibrosis in rodents.
In addition to the model accuracy test for tile images, we intended to determine the actual accuracy at the WSI level. A total of 18 slides that were independent of the tile image data set were used for the WSI test. Each slide had ground truth annotated by a board-certified pathologist, and the model performance was validated by comparing the prediction results with the ground truth. The predicted fibrosis ratio calculated by the trained model showed a high correlation with that of the ground truth, and slightly higher regression coefficients were observed at 20× magnification than at 10× magnification scale, although the model was trained based on the images from 10× magnification. This might be because highly magnified images would be useful to detect more lesions than images of low magnification. A few studies have used deep learning algorithms to quantify histopathological changes in structures such as ovarian follicles 33 and fatty vacuoles, 34 which are of typical circular shapes that are relatively easier to detect. The strong correlations of fibrosis ratio between the value predicted by the trained model and the ground truth in this study showed the possibility of implementing deep learning techniques to quantify atypically shaped lesions. In addition, the present study showed reliable correlations between the predicted fibro-ratio rank and the average fibrosis rank by pathologists at the WSI level. For prediction of grade or rank, 10× prediction could be acceptable since a slight difference was observed in linear regression coefficients between the two magnifications. However, the objective of pixel segmentation is precise detection and localization of an object, and our data also showed more precise detection at 20× (Figure 4); therefore, we suggest that 20× prediction would be better for future research. Although we used the average rank because of the variation in grades assigned by pathologists due to pathologists’ subjectivity and broad limitation among the grades, the correlation of almost 0.89 is an encouraging result for the implementation of deep-learning techniques in the field of diagnosis for toxicological pathology.
Segmentation using AI networks is a growing methodology in pathology, not only for clinical but also for nonclinical studies. Here, we showed the implementation of pixel-level detection of hepatic fibrosis in H&E-stained slide images, the most commonly used staining method, via the Mask R-CNN network. The model performance observed from the test was encouraging. If complemented by the method for error calculation that covers the errors almost close to the ground truth (type 1 and 2 errors), it might be useful to reduce the errors and improve the model performance. In addition, assigning a ground truth annotation at the WSI level allowed us to confirm the model performance at the slide level, which is inevitable for actual application in nonclinical studies. Although annotation in a slide is laborious, we believe that determining the ground truth at the WSI level and comparing the predicted lesions to the ground truth would be a useful method for model validation. In summary, our study indicates that Mask R-CNN could be a powerful tool to quantify and validate atypical lesions, such as hepatic fibrosis, at the WSI level and is also useful for nonclinical toxicologic pathology diagnosis.
Supplemental Material
sj-doc-1-tpx-10.1177_01926233211057128 – Supplemental material for Implementation and Practice of Deep Learning-Based Instance Segmentation Algorithm for Quantification of Hepatic Fibrosis at Whole Slide Level in Sprague-Dawley Rats
Supplemental material, sj-doc-1-tpx-10.1177_01926233211057128 for Implementation and Practice of Deep Learning-Based Instance Segmentation Algorithm for Quantification of Hepatic Fibrosis at Whole Slide Level in Sprague-Dawley Rats by Ji-Hee Hwang, Hyun-Ji Kim, Heejin Park, Byoung-Seok Lee, Hwa-Young Son, Yong-Bum Kim, Sang-Yeop Jun, Jong-Hyun Park, Jaeku Lee and Jae-Woo Cho in Toxicologic Pathology
Supplemental Material
sj-tif-1-tpx-10.1177_01926233211057128 – Supplemental material for Implementation and Practice of Deep Learning-Based Instance Segmentation Algorithm for Quantification of Hepatic Fibrosis at Whole Slide Level in Sprague-Dawley Rats
Supplemental material, sj-tif-1-tpx-10.1177_01926233211057128 for Implementation and Practice of Deep Learning-Based Instance Segmentation Algorithm for Quantification of Hepatic Fibrosis at Whole Slide Level in Sprague-Dawley Rats by Ji-Hee Hwang, Hyun-Ji Kim, Heejin Park, Byoung-Seok Lee, Hwa-Young Son, Yong-Bum Kim, Sang-Yeop Jun, Jong-Hyun Park, Jaeku Lee and Jae-Woo Cho in Toxicologic Pathology
Supplemental Material
sj-tif-2-tpx-10.1177_01926233211057128 – Supplemental material for Implementation and Practice of Deep Learning-Based Instance Segmentation Algorithm for Quantification of Hepatic Fibrosis at Whole Slide Level in Sprague-Dawley Rats
Supplemental material, sj-tif-2-tpx-10.1177_01926233211057128 for Implementation and Practice of Deep Learning-Based Instance Segmentation Algorithm for Quantification of Hepatic Fibrosis at Whole Slide Level in Sprague-Dawley Rats by Ji-Hee Hwang, Hyun-Ji Kim, Heejin Park, Byoung-Seok Lee, Hwa-Young Son, Yong-Bum Kim, Sang-Yeop Jun, Jong-Hyun Park, Jaeku Lee and Jae-Woo Cho in Toxicologic Pathology
Supplemental Material
sj-tif-3-tpx-10.1177_01926233211057128 – Supplemental material for Implementation and Practice of Deep Learning-Based Instance Segmentation Algorithm for Quantification of Hepatic Fibrosis at Whole Slide Level in Sprague-Dawley Rats
Supplemental material, sj-tif-3-tpx-10.1177_01926233211057128 for Implementation and Practice of Deep Learning-Based Instance Segmentation Algorithm for Quantification of Hepatic Fibrosis at Whole Slide Level in Sprague-Dawley Rats by Ji-Hee Hwang, Hyun-Ji Kim, Heejin Park, Byoung-Seok Lee, Hwa-Young Son, Yong-Bum Kim, Sang-Yeop Jun, Jong-Hyun Park, Jaeku Lee and Jae-Woo Cho in Toxicologic Pathology
Supplemental Material
sj-tif-4-tpx-10.1177_01926233211057128 – Supplemental material for Implementation and Practice of Deep Learning-Based Instance Segmentation Algorithm for Quantification of Hepatic Fibrosis at Whole Slide Level in Sprague-Dawley Rats
Supplemental material, sj-tif-4-tpx-10.1177_01926233211057128 for Implementation and Practice of Deep Learning-Based Instance Segmentation Algorithm for Quantification of Hepatic Fibrosis at Whole Slide Level in Sprague-Dawley Rats by Ji-Hee Hwang, Hyun-Ji Kim, Heejin Park, Byoung-Seok Lee, Hwa-Young Son, Yong-Bum Kim, Sang-Yeop Jun, Jong-Hyun Park, Jaeku Lee and Jae-Woo Cho in Toxicologic Pathology
Supplemental Material
sj-tif-5-tpx-10.1177_01926233211057128 – Supplemental material for Implementation and Practice of Deep Learning-Based Instance Segmentation Algorithm for Quantification of Hepatic Fibrosis at Whole Slide Level in Sprague-Dawley Rats
Supplemental material, sj-tif-5-tpx-10.1177_01926233211057128 for Implementation and Practice of Deep Learning-Based Instance Segmentation Algorithm for Quantification of Hepatic Fibrosis at Whole Slide Level in Sprague-Dawley Rats by Ji-Hee Hwang, Hyun-Ji Kim, Heejin Park, Byoung-Seok Lee, Hwa-Young Son, Yong-Bum Kim, Sang-Yeop Jun, Jong-Hyun Park, Jaeku Lee and Jae-Woo Cho in Toxicologic Pathology
Footnotes
Declaration of Conflicting Interests
The author(s) declared no real, perceived, or potential conflicts of interest with respect to the research, authorship, and/or publication of this article.
Funding
The author(s) disclosed receipt of the following financial support for the research, authorship, and/or publication of this article: This research was supported by a grant (20183MFDS411) from Ministry of Food and Drug Safety in 2021.
Supplemental Material
Supplemental material for this article is available online.
References
Supplementary Material
Please find the following supplemental material available below.
For Open Access articles published under a Creative Commons License, all supplemental material carries the same license as the article it is associated with.
For non-Open Access articles published, all supplemental material carries a non-exclusive license, and permission requests for re-use of supplemental material or any part of supplemental material shall be sent directly to the copyright owner as specified in the copyright notice associated with the article.