
Abstract
The present study was designed to investigate the antidiabetic effect of nerolidol on high-fat diet and streptozotocin-induced diabetic rats. Type 2 diabetes was induced in animals by feeding them a high-fat diet for 4 weeks and administering a single intraperitoneal dose of streptozotocin (35 mg/kg body weight). Diabetic rats were treated with nerolidol (25 mg/kg BW) for 28 days. Results showed that nerolidol treatment significantly reduced (p < 0.05) the level of elevated glucose, glycosylated hemoglobin and improved (p < 0.05) the body weight and insulin level. Nerolidol also considerably improved (p < 0.05) the carbohydrate metabolic enzyme activities and increased the glycogen storage in the liver of diabetic rats. Increased serum triglycerides, total cholesterol (C), low-density lipoproteins-C and very low-density lipoproteins-C levels were significantly lowered (p < 0.05), while reduction of serum high-density lipoprotein-C was alleviated after administration of nerolidol. In addition, nerolidol attenuated oxidative stress markers by significantly increasing (p < 0.05) the levels of superoxide dismutase, catalase, reduced glutathione, and lowering (p < 0.05) the level of thiobarbituric acid reactive substances, and lipid hydroperoxide. Similarly, nerolidol showed its pharmacological effects against hepatic markers via restoring (p < 0.05) the alleviated level of alanine transaminase, aspartate aminotransferase, and alkaline phosphatase. Finally, it improved insulin-dependent glucose transport in skeletal muscle by enhancing and activating glucose transporter protein-4. These findings confirmed the antidiabetic potential of nerolidol in type 2 diabetic rats. This may be related to a high antioxidant capacity, the restoration of plasma insulin and lipid levels, and the activation of insulin signaling in STZ/HFD-induced diabetic rats.
Introduction
Diabetes is becoming more prevalent due to sedentary lifestyles, high-calorie diets, obesity, a longer life expectancy, and other factors. 1 Diabetes mellitus is a metabolic condition with chronic hyperglycemia and abnormal carbohydrate, lipid, and protein metabolism. These abnormalities are caused by total or relative insulin secretion and/or action. 2 Chronic hyperglycemia in diabetes is associated with prolonged damage, dysfunction, and eventually the failure of organs, particularly the eyes, cardiovascular, kidneys, and nervous system. 3 Along with hyperglycemia, various other variables such as dyslipidemia or hyperlipidemia contribute to the development of cardiovascular problems in diabetes, the leading cause of morbidity and mortality. 4 Type 2 diabetes mellitus (T2DM) is a chronic metabolic condition developing worldwide. T2DM accounts for nearly 95% of all diabetes cases and affects 8.3 % of the world population, imposing a significant economic burden on humanity. 5
Insulin and oral hypoglycemic agents such as biguanides, sulfonylurea derivatives, thiazolidinediones, and α-glucosidase inhibitors are used to treat type 2 diabetes. These drugs have adverse effects; for example, thiazolidinediones can cause obesity, osteoporosis, and sodium retention; sulfonylurea derivatives can cause severe hypoglycemia, and biguanide (metformin) can cause lactic acidosis. 6 Further, oral monotherapy with lifestyle changes is not sufficient for most diabetic patients and requires various oral combinations or the addition of insulin. 7 Thus, there is an increasing need to search for more effective antidiabetic agents with fewer side effects.
Plants are the primary source of many conventional medicines used in several countries such as China for hundreds of years. 8 Recently, a growing body of research suggests that functional foods and their bioactive ingredients may be utilized in conjunction with conventional diabetic treatment. 9 Several bioactive compounds found in spices, vegetables, food ingredients, and other natural sources are being investigated for their potential benefits in preventing and/or controlling diabetes directly or indirectly. 10 Nerolidol is sesquiterpene alcohol found in various plants and flowers. Nerolidol has been widely used as a flavor enhancer in different food products in the food industry. It was certified as a safe food flavoring ingredient by the United States Food and Drug Administration. Nerolidol can be found in neroli, ginger, citronella, lemongrass, rose, and tea tree essential oils. 11 Despite the well-documented antioxidant, anti-inflammatory, antimicrobial, and anticancer properties of nerolidol. However, no scientific investigation has been conducted to demonstrate the antidiabetic properties of nerolidol in a type 2 diabetes model. Thus, the present study aims to evaluate the antihyperglycemic efficacy of nerolidol by assessing the activities of key metabolic enzymes of glucose metabolism with insulin signaling mechanism in high-fat diet (HFD) with streptozotocin (STZ)-induced diabetic rats.
Materials and methods
Ethics statement
Procedures involving animals and their care were conducted according to the Institutional Animal Ethics of Haimen People’s Hospital (Ethical No: NTUN20210032), Nantong, Jiangsu Province, 226100, China. Five-week-old adult male Wistar rats weighing 180–200 g were used in this experiment and maintained at 22 ± 2°C temperature, 55 ± 5% humidity, and 12-h light/dark cycle. The animals were given food and water ad libitum.
Development of T2DM
After 7 days of acclimation, 24 rats were divided into two categories: the control group (n = 12) was fed commercial feed, and the HFD-STZ group (n = 12) was fed an HFD with 66.5% commercial feed, 13.5% lard, and 20% sugar. After 2 weeks, HFD-STZ rats received a single low dose of STZ (35 mg/kg BW) by intraperitoneal injection. 12 The fasting blood glucose (FBG) level was tested 5 days after induction of diabetes by STZ. Rats with FBG levels greater than 250 mg/dl were considered diabetic. The treatment began the following day, which was designated as the first day of treatment. After this, the control group was divided into two groups: one group (n = 6) continued to take the standard chow alone, while the other group (n = 6) was fed normal chow with nerolidol (25 mg/kg BW) for the last 4 weeks. Likewise, in HFD-STZ groups, one group (n = 6) continued to receive the HFD alone (Diabetes group) whilst the other group (n = 6) was fed with the HFD and supplemented with nerolidol (25 mg/kg BW) for the last 4 weeks. Nerolidol dissolved in a vehicle solution of olive oil was administered orally daily in the morning for 28 days. 13
Experimental design
Group 1: Normal rats treated with a standard pellet diet
Group 2: Normal rats treated with nerolidol (25 mg/kg BW/day for the last 4 weeks only)
Group 3: HFD fed + STZ (35 mg/kg BW) induced experimental diabetic rats
Group 4: Diabetic rats orally treated with nerolidol (25 mg/kg BW/day for the last 4 weeks only)
Sample collection
After 28 days of treatment, the animals were starved overnight before being decapitated and sacrificed. Blood was drawn and centrifuged to collect the plasma, which was then used to calculate glucose, insulin, and lipid profiles. After the plasma separation, the buffy coat enriched in white cells was removed. The remaining erythrocytes were washed three times with physiological saline and used to estimate the antioxidant activity. The liver tissue was immediately removed and cleaned in ice-cold normal saline to remove the blood. Tissues with known weights were chopped and homogenized with Tris-HCl buffer (pH 7.4) and the supernatant was utilized to calculate the activity of carbohydrate metabolic enzymes in the liver. Every week of the treatment period, the body weights of all the animals were recorded.
Oral glucose tolerance test (OGTT)
After 2 weeks, an OGTT was carried out on the experimental rats. After overnight fasting, the experimental rats received an oral glucose solution (2 g/kg BW). Blood samples were obtained from the tail vein at times 0 (before the glucose load) and 30, 60, and 120 min after glucose injection. A glucometer was used to determine the blood glucose concentration.
Inference of the level of glucose and insulin in plasma
An enzyme-based assay measured plasma glucose levels (Cell Biolabs, INC, USA). A commercial kit was used to measure plasma insulin levels using the enzyme-linked immunosorbent (ELISA) technique (Abcam insulin assay kit, Cat. No. ab277390). The Insulin-specific antibody is coated on a 96-well plate for this test. The wells are pipetted with standards and samples, and the immobilised antibody binds insulin in a sample to the wells. After cleaning the wells, anti-mouse insulin antibodies that have been biotinylated are added. After washing away unbound biotinylated antibodies, HRP-conjugated streptavidin is pipetted into the wells. A substrate solution containing 3,3′,5,5′-tetramethylbenzidine is added to the wells, and colour develops in proportion to the amount of insulin bound to the plate. The stop solution changes the colour from blue to yellow, and 450 nm is used to measure the color’s intensity. Homoeostatic model appraisal (HOMA) was calculated with the formula of HOMA = Insulin (μU/mL) x Glucose (mmol/L)/22.5.
Estimation of Glycosylated hemoglobin (HbA1c)
HbA1c levels in blood were determined using a commercial kit (Cat. No. R032K11) obtained from Bioway Chemistry Reagent Series in China. Hemolysate was made by combining 1 mL of hemolysis reagent with 20 μl of whole blood, mixing thoroughly, and waiting 5 min. Add 8 μl of hemolysate and 300 μl of R1 (Latex 0.1% in Glycine buffer) and incubate at 37°C for 300 s. Then add 100 μl of R2 (goat anti-mouse IgG polyclonal antibody 0.8 mg/dl in Glycine buffer), thoroughly mix, and incubate at 37°C. Take an optical density measurement at 620 nm at 370 s and 600 s. The ΔOD was obtained by subtracting OD 2 from OD 1. The calculated OD can be used to identify the corresponding percent HbA1c on a calibration curve to calculate the HbA1c %.
Estimation of glycogen
Liver glycogen was estimated by the method of Morales et al. 14 50 mg liver tissue digested with 3 mL of 30% potassium hydroxide solution. The tubes were frozen overnight with 1M ammonium acetate to precipitate glycogen. Glycogen was collected after 20 min at 3000 rpm. The residue was dissolved by heating, and glycogen was reprecipitated with alcohol and 1 M ammonium acetate. The final precipitate was dissolved in saturated ammonium chloride solution in a boiling water bath. After diluting glycogen solution, 4 mL of anthrone reagent was added and heated for 20 min. After cooling, absorbance at 640 nm was measured against a water blank.
Estimation of Glucokinase (GK; EC 2.7.1.2)
The activity of GK in the liver homogenate was estimated by the method of Goward, et al. 15 In a total volume of 5.0 mL, the reaction mixture contained the following ingredients: 1.0 μl of glucose solution, 0.5 μl of ATP, 0.5 μl of magnesium chloride, 0.5 μl of potassium chloride, 0.1 μl of sodium fluoride solution, and 2.5 μl of Tris-HCl buffer (pH 8.0). Add 1.0 mL of tissue homogenate and 1 mL of 10% TCA to start the reaction. After 30 min of incubation at 37°C, centrifuge the tubes and use the supernatant to estimate the remaining glucose. The supernatant was mixed with 4 mL of O-toluidine reagent following 15 min of heating in a boiling water bath. At 620 nm, the colourimetric measurement of the newly-emerging green hue was made. Each test included the use of a reagent blank. The difference between the two measurements determined the quantity of glucose phosphorylated. The amount of protein phosphorylated each hour by the enzyme was measured in mol of glucose.
Estimation of Glucose-6-phosphate dehydrogenase (EC 1.1.1.49) activity
Glucose 6-phosphate dehydrogenase in the liver was assayed by the method of Bergmeyer. 16 Briefly, 0.5 mL of the enzyme sample was added to the 5 mL of (final volume) incubation mixture containing 1.0 mL of tris buffer, 0.1 mL of magnesium chloride, 0.1 mL of NADP+, 0.5 mL of phenazine methosulphate, 0.4 mL of the dye solution. To start the reaction, glucose 6-phosphate was added to the mixture. A UV spectrophotometer was used to measure the absorbance of the sample against a water blank every minute for 3.5 min. The molar extinction coefficient of the reduced enzyme activity was calculated by multiplying the change in OD/min by the factor 6/17.6. The molar extinction coefficient of NADPH is 6/17.6 at 37°C. The enzyme activity was expressed as IU/mg of protein for tissue.
Estimation of Glucose 6-phosphatase (EC 3.1.3.9) activity
Glucose 6-phosphatase was assayed by Koide and Oda (1959) method. 17 Briefly, the incubation mixture contained 0.3 mL buffer, 0.5 mL glucose 6- phosphate and 0.2 mL tissue homogenate. This was incubated at 37°C for 1 h. 1 mL 10% TCA was added to the tubes to terminate the enzyme activity, then centrifuged and the phosphate content of the supernatant was estimated. To 1 mL of the aliquot of supernatant, 1 mL of ammonium molybdate and 0.4 mL ammonium 1-anilinonaphthalene-8-sulfonate (ANSA) were added. The blue colour developed was read after 20 min at 620 nm. The enzyme activity was expressed as mol of inorganic phosphorus liberated/min/mg of protein.
Estimation of Fructose-1, 6-bisphosphatase (EC 3.1.3.11) activity
Fructose 1, 6-bisphosphatase was assayed by Gancedo and Gancedo (1971). 18 The assay medium in a final volume of 2.0 mL contained 1.0 mL buffer, 0.4 mL of the substrate, 0.1 mL each of magnesium chloride, 0.2 mL potassium chloride, 0.1 mL of EDTA, and 0.2 mL of enzyme source. The incubation was carried out at 37°C for 15 min. The reaction was terminated by the addition of 1.0 mL of 10% TCA. The suspension was centrifuged, and the phosphorus content of the supernatant was estimated. To 1 mL of an aliquot of the supernatant, 0.3 mL of distilled water and 0.5 mL of ammonium molybdate were added. After 10 min, 0.2 mL of ANSA was added. The tubes were shaken well, kept aside for 20 min, and the blue colour developed was read at 620 nm. The values were expressed as μmol of inorganic phosphorus liberated/h/mg protein.
Estimation of lipid profile
Enzymatic methods were used to determine serum total cholesterol (TC), triglycerides (TG), and high-density lipoprotein cholesterol (HDL-C) levels using commercial test kits (Cell Biolabs, INC, USA) according to the manufacturer protocol. Friedewald equation (LDL-C = TC-[HDL-C+(TG/5)]) for serum low-density lipoprotein cholesterol (LDL-C) calculation was used to compute plasma LDL-C level.
Estimation of thiobarbituric acid reactive substances (TBARS)
Niehaus and Samuelson’s (1968) method was used to estimate the amount of plasma TBARS. 19 0.5 mL of serum was mixed with 0.5 mL of double-distilled water, and 2.0 mL of thiobarbituric acid-TCA-HCl reagent was added. The mixture was boiled for 15 min, then centrifuged at 1000 g for 10 min, and the absorbance of the supernatant was measured at 535 nm. Plasma concentrations were given in mmol/dL.
Estimation of lipid hydroperoxides (LOOH)
LOOH in the plasma was estimated by the method of Jiang et al. (1992). 20 0.2 mL of serum and 0.9 mL of FOX reagent was mixed, incubated for 30 min at room temperature, and the absorbance read at 560 nm. Lipid hydroperoxides was expressed as mmol/dL of plasma.
Assay of superoxide dismutase (SOD; EC. 1.15.1.1)
SOD activity was estimated according to Beyer and Fridovich (1987). 21 The reaction mixture contained 50 mM of tissue hemolysate in potassium phosphate buffer (pH 7.8), 0.1 mM EDTA, 13 mM L-methionine, 2 mM riboflavin and 75 mM nitro blue tetrazolium (NBT). The developed blue colour in the reaction was measured at 560 nm. Units of SOD activity were expressed as the amount of enzyme required to inhibit the reduction of NBT by 50%. The activity was expressed as units/mg of Hb for erythrocytes.
Estimation of catalase (CAT; EC. 1.11.1.6)
The Sinha method was used to measure the CAT activity in the erythrocytes (1972). 22 The reaction was started by mixing 0.1 mL of hemolysate with 0.4 mL of hydrogen peroxide. The reaction was stopped by adding 2.0 mL of the dichromate-acetic acid mixture, after 15, 30, 45, and 60 s of incubation at 37°C. After 10 min in a boiling water bath, the tubes were allowed to cool, and the color developed was measured at 620 nm. Standards in the concentration range of 20–100 μmol were taken and put through the same process. The activity of CAT was expressed in μmol of H2O2 per minute per mg of Hb for erythrocytes.
Estimation of glutathione peroxidase (GPx; EC. 1.11.1.19)
The activity of GPx in the erythrocytes was measured by the method of Rotruck et al. (1973). 23 The reaction mixture contained 0.5 mL of hemolysate, 0.2 mL of tris buffer, 0.2 mL of EDTA, and 0.1 mL of sodium azide. To the mixture, add 0.2 mL of GSH followed by 0.1 mL of H2O2 was added. The contents were mixed well and incubated at 37°C for 10 min, along with a control containing all reagents except hemolysate. After 10 min, the reaction was arrested by adding 0.5 mL of 10% TCA. The tubes were centrifuged, and the supernatant was assayed for GSH. The activity was expressed as μmol of GSH consumed/min/mg of protein for tissues or μg of GSH consumed/min/mg of Hb for erythrocytes.
Estimation of reduced glutathione (GSH)
Reduced glutathione (GSH) was estimated by the method of Ellman (1959). 24 To 0.5 mL of sample, 2.0 mL of 5% TCA was added and allowed to stand for 5 min. 2.0 mL supernatant was taken after centrifugation, and 1.0 mL of Ellman’s reagent and 4.0 mL of 0.3 M disodium hydrogen phosphate was added. The yellow colour developed was read at 412 nm. A series of standards (20–100 μg) was treated similarly, along with a blank containing 1.0 mL of buffer. The amount of glutathione was expressed as mg/dL plasma or μg/mg protein for tissue.
Assay of aspartate aminotransferase (AST, EC 2.6.1.1)
AST assay kit (Cat. No. CE-P015-02) was purchased from Gcell, China. The reaction mixture contains 80 mmol/l TRIS buffer, 240 mmol/l L-aspartate, 600U/l Malate Dehydrogenase, 600U/l lactate dehydrogenase, 0.18 mmol/l NADH, 12 mmol/l 2-oxoglutarate. To this, add 10 μl of serum to initiate the reaction. Absorbance was recorded at 340 nm, and the results were expressed as IU/L of serum.
Assay of alanine aminotransferase (ALT, EC 2.6.1.2)
ASL assay kit (Cat. No. CE-P016-02) was purchased from Gcell, China. The reaction mixture contains 100 mmol/l TRIS buffer, 500 mmol/l L-alanine, 1200 U/L lactate dehydrogenase, 0.18 mmol/l NADH, and 15 mmol/l α-ketoglutarate. To this add 10 μl of serum to initiate the reaction. Absorbance was recorded at 340 nm, and the results were expressed as IU/L of serum.
Assay of serum alkaline phosphatase (ALP, EC 3.1.3.1)
ALP assay kit (Cat. No. CE-P021-02) was purchased from Gcell, China, based on the International Federation of Clinical Chemistry (IFCC). An incubation mixture containing 2.0 mmol/L Magnesium sulphate, 1.0 mmol/L Zinc sulphate, 2.0 mmol/L EDTA, 0.35 mol/l 2-Amino-2-Methyl-1-Propanol (pH = 10.4) and 16 mmol/l p-Nitrophenylphosphate. Add 10 μl of serum to start the reaction and incubate at 37°Cfor 1 min. Absorbance was recorded at 405 nm, and the results were expressed as IU/L of serum.
Western blot analysis
Radioimmunoprecipitation assay buffer (RIPA) with a phosphatase inhibitor cocktail was used to lyse skeletal muscle. After thorough homogenization, the tissue samples were centrifuged at 13,000 rpm for 15 min at 4°C. After the SDS-PAGE, the proteins were moved to a polyvinylidene difluoride (PVDF) membrane. Then, the membrane was blocked for 2 hours with 5% fat-free milk at room temperature. Then, the membrane was incubated with the respective primary antibodies, Anti-IRS-1 (Cat. No. sc-8038, dilution 1:4000, Santa Cruz), p-Akt (Cat. No. sc-135,650, dilution 1:400; Santa Cruz), Anti-GLUT 4 (Cat. No. sc-1607 dilution 1:500; Santa Cruz), β-actin (Cat. No. sc-47,778, dilution 1:500, Santa Cruz), Anti-rabbit IgG secondary antibodies coupled with horseradish peroxidase (HRP) were employed for the identification of specific protein bands using an ECL technique.
Statistical analysis
Data presented means Standard deviation (SD) and subjected to statistical significance were evaluated by One-Way analysis of variance (ANOVA) using SPSS Version 16.0 (SPSS, Cary, NC, USA) and the individual comparisons were obtained by Duncan’s Multiple Range Test (DMRT). Values are considered statistically significant when p < 0.05.
Results
Effect of nerolidol on body weight
The data in Figure 1 shows the influence of nerolidol on body weight changes in control and experimental rats. The body weight was significantly decreased (p < 0.05) in diabetic rats compared to normal control rats. On the other hand, diabetic rats treated with nerolidol (25 mg/kg BW) improved body weight to near normal, comparable with diabetic control rats. Effect of nerolidol on body weight of normal and experimental rats. HFD: High-fat diet, STZ: Streptozotocin. Values not sharing a common superscript differ significantly at p < 0.05. bp < 0.05, compared with normal values; cp < 0.05, compared with HFD/STZ diabetic values.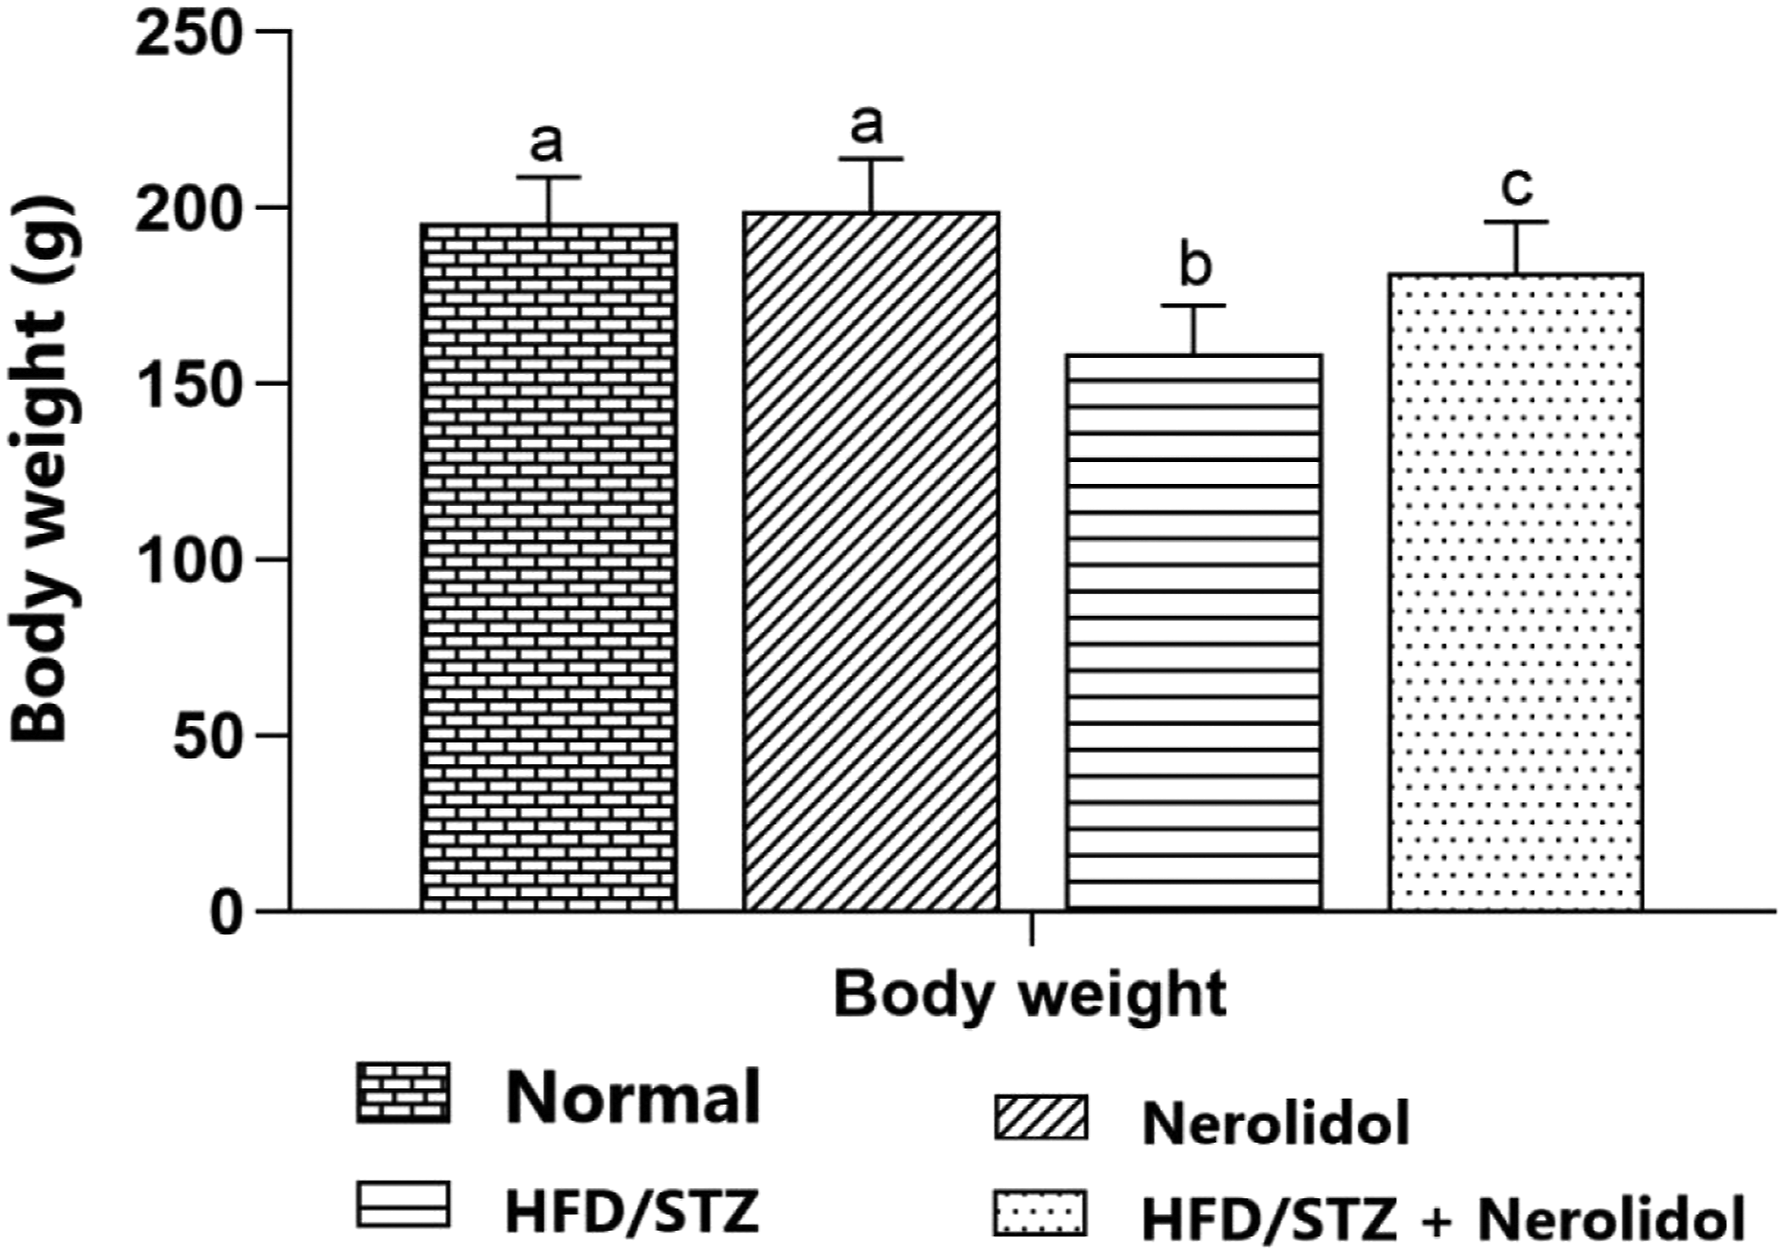
Effect of nerolidol on OGTT
As seen in Figure 2, all groups had a considerable increase in blood glucose levels at 30 min. In diabetic rats, it remained unaltered for the next 120 min. Treatment with nerolidol (25 mg/kg BW) significantly reduced the increase in blood glucose levels at 60 and 120 min after glucose delivery (p < 0.05) compared to diabetic rats. Effect of nerolidol on OGTT of normal and experimental rats. OGTT: oral glucose tolerance test, HFD: High-fat diet, STZ: Streptozotocin. Values are means ± S.D. for six rats. Values not sharing a common superscript differ significantly at p < 0.05. bp < 0.05, compared with normal values; cp < 0.05, compared with HFD/STZ diabetic values.
Effect of nerolidol on glucose
The effect of nerolidol on glucose levels for 4 weeks in normal and diabetic rats is depicted in Figure 3. The administration of HFD with STZ led to a substantial increase (p < 0.05) in fasting blood glucose levels in the diabetic group throughout the 4 weeks compared to the normal control group throughout the 4 weeks. In addition, diabetic rats treated with 25 mg/kg nerolidol for 4 weeks had dramatically decreased (p < 0.05) fasting blood glucose levels. Effect of nerolidol on blood glucose level in normal and experimental rats. HFD: High-fat diet, STZ: Streptozotocin. Values are means ± S.D. for six rats. Values not sharing a common superscript differ significantly at p < 0.05. bp < 0.05, compared with normal values; cp < 0.05, compared with HFD/STZ diabetic values.
Effect of nerolidol on insulin, HOMA index, and HbA1c levels
Effect of nerolidol on insulin, homeostatic model assessment, and glycated hemoglobin levels in normal and experimental rats.

HOMA: Homeostatic Model Assessment; HbA1c: Glycated hemoglobin; HFD: High-fat diet; STZ: Streptozotocin.
Values are given as mean ± SD from six rats in each group.
Values not sharing a common superscript differ significantly at p < 0.05.
bp < 0.05, compared with normal valuesa.
cp < 0.05, compared with HFD/STZ diabetic valuesb.
Effect of nerolidol on lipid profile
Figure 4 shows the TC, TG, HDL-C, and LDL-C levels in the serum of diabetic rats. The diabetic rats had significantly elevated (p < 0.05) serum TC, TG, and LDL-C levels and decreased HDL-C levels. Nerolidol-treated rats reduced the TC, TG, LDL-C considerably (p < 0.05) and increased HDL-C. Effect of nerolidol on lipid profile in normal and experimental rats. TC: Total cholesterol, TG: Triglycerides, HDL-C: High-density lipoprotein-Cholesterol, LDL-C: Low-density lipoprotein-Cholesterol, HFD: High-fat diet, STZ: Streptozotocin. Values are means ± S.D. for six rats. Values not sharing a common superscript differ significantly at p < 0.05. bp < 0.05, compared with normal values; cp < 0.05, compared with HFD/STZ diabetic values.
Effect of nerolidol on glycogen level and carbohydrate metabolic enzyme
Effect of nerolidol on the activities of carbohydrate metabolic enzymes and glycogen level in the liver of normal control and experimental rats.

HFD: High-fat diet; STZ: Streptozotocin.
Values are given as means ± S.D. for six rats in each group.
Values not sharing a common superscript differ significantly at p < 0.05.
bp < 0.05, compared with normal valuesa;
cp < 0.05, compared with HFD/STZ diabetic valuesb.
U* - μmol of glucose phosphorylated per hour.
U# - nmol of NADPH formed per minute.
U@-μmol of Pi liberated per min;
U$- μmol of Pi liberated per hr.
Effect of nerolidol on lipid peroxidation and antioxidant status
Effect of nerolidol on lipid peroxidation and antioxidant level in the normal and experimental rats.

TBARS: Thiobarbituric acid reactive substances, LOOH: lipid hydroperoxides, SOD: Superoxide dismutases, CAT: Catalase, GPx: Glutathione peroxidase, GSH: Reduced Glutathione, HFD: High-fat diet, STZ: Streptozotocin.
Values are means ± S.D for six rats in each group.
Values not sharing a common superscript differ significantly at p < 0.05.
bp < 0.05, compared with normal valuesa;
cp < 0.05, compared with HFD/STZ diabetic valuesb.
U* - Enzyme concentration required for 50% inhibition of NBT reduction/minute.
U
U
Effect of nerolidol on AST, ALT, and ALP in HFD fed-STZ-induced diabetic rats
As illustrated in Figure 5, the AST, ALT, and ALP activities were significantly elevated (p < 0.05) in diabetic control rats compared to normal control rats. Nerolidol (25 mg/kg) administration for 28 days significantly (p < 0.05) improved AST, ALT, and ALP activity to near-normal levels. Effect of nerolidol on the activities of hepatic biomarkers in normal and experimental rats. AST: Aspartate transaminase, ALT: Alanine transaminase, ALP: Alkaline phosphatase, HFD: High-fat diet, STZ: Streptozotocin. Values are means ± S.D. for six rats. Values not sharing a common superscript differ significantly at p < 0.05. bp < 0.05, compared with normal values; cp < 0.05, compared with HFD/STZ diabetic values.
Effect of nerolidol on insulin signaling
Figure 6 represents the expression of IRS 1, p-Akt, and GLUT-4 proteins in the skeletal muscle of control and experimental rats. The expression levels of IRS-1, GLUT-4 significantly decreased (p < 0.05), and the level of p-Akt was significantly increased in diabetic mice, compared with the control group. Administration of nerolidol significantly (p < 0.05) up-regulated expressions of IRS 1, and GLUT 4 and downregulated the p-Akt when compared to diabetic rats. (a) Effect of nerolidol on IRS-1, GLUT-4, and p-Akt protein expressions in the skeletal muscle of control and HFD fed mice by western blot. Lane 1. Control; Lane 2. Nerolidol; Lane 3. HFD/STZ; Lane 4. HFD/STZ + Nerolidol. (b) Effect of nerolidol on IRS 1, PI 3 Kinase, and p-Akt protein band intensities scanned by a densitometer. The histogram depicts the quantitation of three independent experiments (means ± S.D), with data normalized by defining the control group, with IRS-1, p-Akt protein, and GLUT-4, as 1 unit. Values that have different superscript letters (* and **) differ significantly from each other (p < 0.05, DMRT). HFD: High-fat diet, STZ: Streptozotocin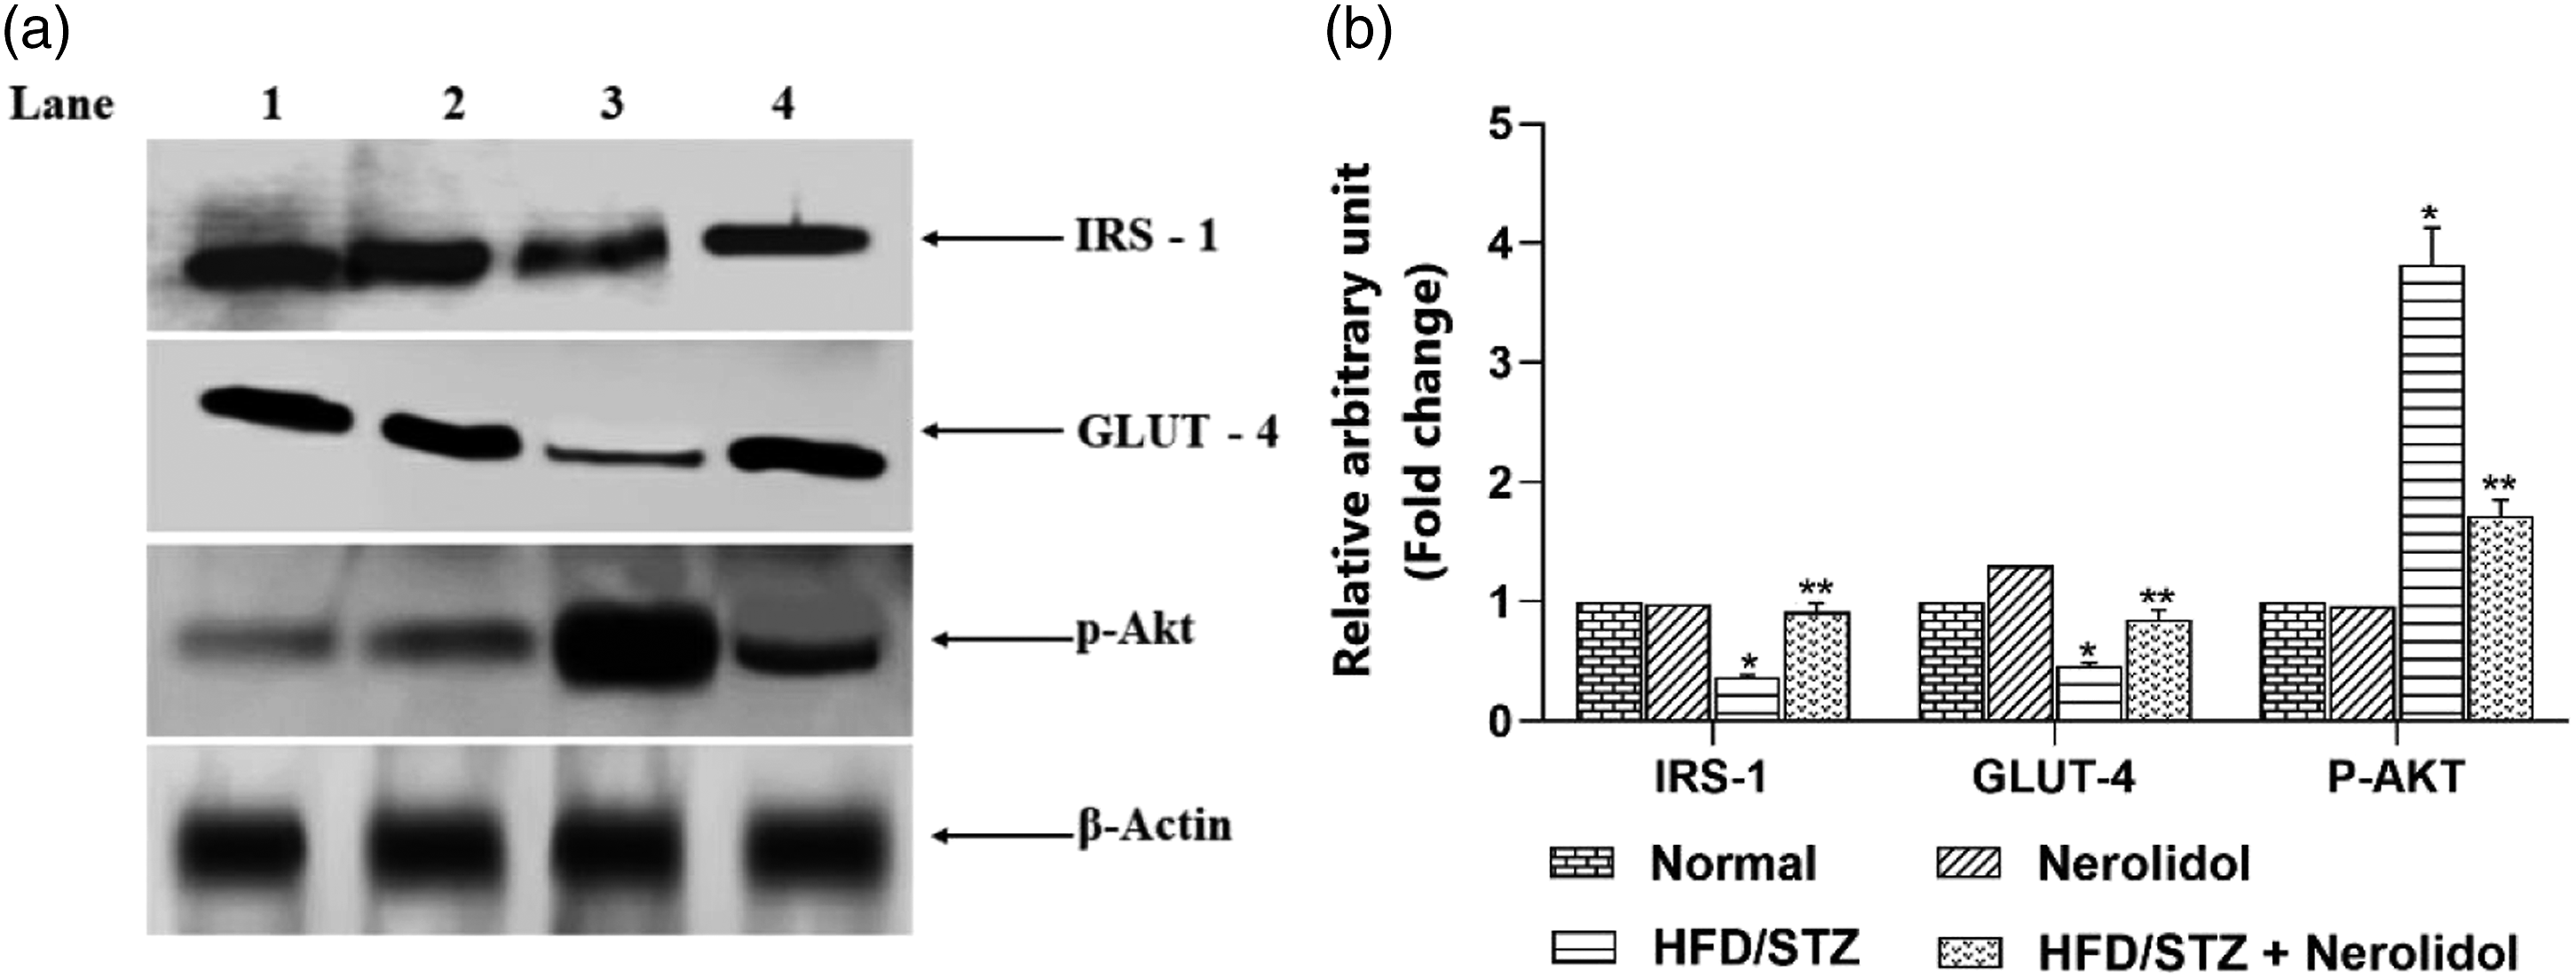
Discussion
Type 2 diabetes mellitus is one of the most prevalent chronic and progressive metabolic illnesses characterised by decreased insulin secretion, insulin resistance, and elevated hepatic glucose production. 25 To investigate the therapeutic efficacy of nerolidol on T2DM, it is essential to develop an animal model that resembles the human disease process. Numerous studies have shown that rats treated with a low dose of STZ followed by HFD lead to hyperglycemia, insulin resistance, and insulin deficiency, resembling T2DM in humans. 26 In the present study, T2DM was induced in rats by a single injection of a low dose of STZ followed by the HFD for 4 weeks. We evaluated the antidiabetic, antidyslipidemic, and antioxidant effects of nerolidol in this model. The present results showed that nerolidol could significantly decrease fasting blood glucose, improve lipid profiles, ameliorate oxidative stress, regulate the carbohydrate key enzymes and translocate the GLUT-4 into the cell membrane through improved insulin signaling. We have reason to demonstrate that nerolidol exhibits an antidiabetic effect in HFD/STZ-induced T2DM, and its underlying mechanism might be partially associated with insulin signaling property.
The administration of an HFD to experimental rats combined with STZ resulted in decreased glucose tolerance, glycemic imbalance, dyslipidemia, and an imbalance in antioxidant status. These findings revealed that the diabetic animal model closely reflects the metabolic parameters of type 2 diabetes in humans. Numerous researchers have developed T2DM using this experimental animal model.27,28 The considerable weight loss seen in diabetic rats in the current study could be attributable to enhanced muscle wasting caused by structural protein breakdown and the inability of carbohydrates to be used as an energy source. 29 However, nerolidol dramatically raised the bodyweight of HFD/STZ-induced T2DM rats, resulting from enhanced tissue protein synthesis due to glycemic management.
Controlling blood glucose levels is critical for preventing or delaying the onset of acute or long-term diabetes problems. 30 The current study discovered that supplementing diabetic rats with nerolidol considerably increased their glucose-lowering effects in the OGT compared to the diabetic control group. These findings suggested that nerolidol-treated diabetic rats had improved glucose tolerance due to increased insulin secretion from pre-existing β-cells and enhanced glucose transport and utilization. Plasma insulin levels were dramatically decreased in diabetic rats, whereas plasma insulin levels were significantly elevated in diabetic rats treated with nerolidol. The present study plasma insulin levels demonstrated a substantial effect of nerolidol treatment on β-cell function in STZ rats. These findings are comparable to prior research.31,32 Numerous mechanisms could account for these effects: stimulation of insulin release, regeneration of pancreatic β-Cell, and improved insulin sensitivity of target organs.33,34 Additionally, nerolidol significantly recovered HOMA-IR levels in diabetic rats, implying that nerolidol possessed an insulin-sensitizing action related to β-cell dysfunction.
HbA1c is the most accurate and widely used marker for determining the degree of protein glycation in diabetes mellitus. In diabetic rats, the increasing level of HbA1c is precisely related to the decreased total haemoglobin level. 35 Glycation of proteins is a non-enzymatic reaction when excess glucose in the blood reacts with free amino groups on hemoglobin. The HbA1c level provides insight into long-term glycemic control and correlates with various problems associated with diabetes.36,37 Diabetic rats had significantly more glycosylated hemoglobin, indicating poor glycemic control. Nerolidol treatment significantly decreased HbA1c levels in diabetic rats compared to untreated diabetic rats. This suggests that the decreased HbA1c level is most likely the result of glucoregulatory systems, as seen by a drop in protein glycation condensation processes.
Glycogen is the primary intracellular storage form for glucose. Its presence in various tissues, most notably the liver and skeletal muscles, directly reflects insulin activity, as insulin regulates glycogen storage by boosting glycogen synthase and suppressing glycogen phosphorylase. 38 Due to the destruction of islets of Langerhans cells, which results in a considerable decrease in insulin levels, the glycogen content of liver and muscle tissues decreases in the absence of insulin since glucose entry into the liver is impeded.39,40 Our results indicate that feeding diabetic rats with nerolidol significantly increased the glycogen content of both hepatic and skeletal muscles by increasing glycogen synthase and inhibiting glycogen phosphorylase, possibly due to elevated insulin levels.
In hepatocytes, GK plays an essential role in controlling blood glucose levels and maintaining cellular metabolic functions. 41 The pivotal role of GK in controlling blood glucose has made it attractive as a potential drug target for treating type 2 diabetes. 42 In the present study, a significant decrease in GK activity in the liver of diabetic rats is in agreement with previous studies.43,44 The markedly decreased level of insulin observed in the diabetic animals ultimately leads to the impairment in the activity of GK. Nerolidol treatment significantly improved GK activity in rats fed a high-fat diet or streptozotocin. We speculate that the nerolidol-induced enhanced insulin production plays an active modulatory role in liver GK activity.
Glucose-6-phosphatase and fructose-1, 6-bisphosphatase are gluconeogenic enzymes essential for glucose delivery to other organs during diabetes, extended fasting, or starvation. 45 Glucose-6-phosphatase catalyzes the dephosphorylation of glucose-6-phosphate to glucose. Fructose-1,6-bisphosphatase catalyzes the dephosphorylation of fructose-1,6-bisphosphate to fructose-6-phosphate, which acts as a site for gluconeogenesis regulation. 46 Increased glucose-6-phosphatase and fructose-1, 6-diphosphatase activity in the livers of diabetic rats produced with the HFD and STZ may result from insulin shortage. In diabetic rats, nerolidol administration dramatically lowered glucose-6-phosphatase and fructose-1, 6-diphosphatase activity. This could be due to enhanced insulin secretion because of nerolidol, which is required to regulate the significant gluconeogenic enzymes.
Increased lipid level in the blood is a crucial factor for the pathophysiology of T2DM, which is responsible for 80% of diabetic mortality. 47 Scientific evidence suggests that insulin production or sensitivity deficits are associated with lipid abnormalities contributing to conditions such as atherosclerosis and fatty liver disease. 48 The data indicated that treatment with HFD combined with STZ showed marked elevation in TC, TG, LDL-c and low HDL-c. According to some researchers, increased triglycerides, LDL-c, and lower HDL-c levels in diabetic rats could be attributed to their higher HFD intake. 49 Nerolidol administration to diabetic rats significantly reversed the abnormalities in lipid profile levels; additionally, the observations were consistent with Lin et al. 50 These findings suggested that nerolidol could help diabetic complications by regulating lipid metabolism and reducing dyslipidemia.
Hyperglycemia creates free radicals, deplete antioxidant defenses, impede cellular activities, induce oxidative damage to membranes, and make lipid peroxidation more susceptible. 51 Increased peroxidation of lipids results in the generation of lipid hydroperoxides. According to a study, individuals with type 2 diabetes have much greater TBARS and hydroperoxides than healthy individuals. 52 Our investigation discovered that diabetic rats had significantly higher lipid peroxides and hydroperoxides. Both enzymatic (SOD, CAT, and GPx) and non-enzymatic (GSH) antioxidants were dramatically lowered. Due to its antioxidative and antiperoxidative effects, oral treatment of nerolidol improved the antioxidant status of diabetic rats by lowering lipid peroxidation and hydroperoxides. Nerolidol treatment boosted antioxidant enzymes and decreased lipid peroxidation in isoproterenol-induced cardiac injury in Wistar rats in earlier investigations.53,54
Diabetes leads to liver dysfunction, and changes result in increased circulating levels of liver enzymes. 55 Our findings indicated a significant rise in the serum AST, ALT, and ALP activities of diabetic rats compared to controls, implying that hepatic dysfunction may be caused due to hepatotoxic effects of STZ and HFD. Elevated ALT and AST levels suggest that amino acids are being used for oxidation or glucogenesis to assess liver impairment. 56 However, nerolidol therapy restored serum ALT, AST, and ALP activity to near-normal levels in diabetic rats, demonstrating that liver cells retain their function.
Glucose clearance in skeletal muscle is essential because of the insulin-signaling cascade’s translocation of the glucose transporter. Insulin generally affects skeletal muscle metabolism by stimulating glucose transport, glycogen synthesis, and protein synthesis via the PI3K/AKT signalling pathway. 57 Glucose clearance dysfunction relates to irregular insulin signalling via changes in PI3K/Akt expression. 58 Nerolidol therapy dramatically enhanced the amount of IRS-1 phosphorylation in skeletal muscle. We observed that Nerolidol administration elevated GLUT4 levels, which was associated with increased p-Akt expression in skeletal muscle of diabetic rats. This unequivocally demonstrates that nerolidol can successfully induce glucose transport via GLUT4 migration and restore cell glucose utilization.
Conclusion
In conclusion, the current investigation found that nerolidol significantly decreased fasting blood glucose and plasma insulin levels while also modifying the activities of carbohydrate metabolizing enzymes in the hepatic tissues of HFD/STZ-induced diabetic rats. Further, nerolidol therapy improves lipid profile, antioxidant status and enhanced insulin signalling pathway in diabetic rats. As a result, nerolidol could be a promising target for developing alternative medicine in treating and managing diabetes and its secondary problems.
Footnotes
Declaration of conflicting interests
The author(s) declared no potential conflicts of interest with respect to the research, authorship, and/or publication of this article.
Funding
The author(s) received no financial support for the research, authorship, and/or publication of this article.