
Abstract
Chlorpromazine hydrochloride (CH) and N-acetyl-p-amino-phenoltriptolide (APAP) are typical acentral dopamine receptor antagonists and antipyretic analgesics in clinical applications, respectively. However, it has been reported that these 2 drugs could cause liver damage. Lysophosphatidylcholines (LPCs) have multiple physiological functions and are metabolized primarily in the liver, where it undergoes significant changes when the liver is damaged. In the study, 15 LPCs in the rat serum with CH- and APAP-induced liver injury were quantified based on ultra-performance liquid chromatography quadrupole time-of-flight mass spectrometry, and multivariate statistical analyses including principal component analysis (PCA) and orthogonal partial least squares discriminate analysis (OPLS-DA) were combined to understand CH- and APAP-induced liver injury from the perspective of LPC metabolic profiling. The quantitative results showed that there were significant changes in 10 LPCs and 5 LPCs after CH- and APAP-administration, separately. The results of PCA and OPLS-DA indicated that CH- and APAP-induced liver injury could be well distinguished by the LPC metabolic profiling, and 7 LPCs and 1 LPC biomarkers that could characterize CH- and APAP-induced liver damage in turn had been screened. This study will not only provide a new perspective for the clinical diagnosis of CH- and APAP-induced liver injury, but also offer a reference for further study of their hepatotoxicity mechanisms.
Keywords
Introduction
Chlorpromazine hydrochloride (CH) is a phenothiazine drug, which functions as a central dopamine receptor antagonist; it is widely used for treating psychosis. 1 N-acetyl-p-amino-phenol (APAP) is a widely used over-the-counter pain reliever and antipyretic available worldwide. However, both drugs can cause liver injury.2,3 The mechanisms of CH-induced liver injury may be related to the interference of bile secretion and hypersensitivity reaction. 4 The metabolites of CH can covalently bind to proteins in liver cells to form new neoantigens, inducing an immune response and mediating the apoptosis of liver cells through Fas. 5 After APAP overdose, the production of N-acetyl-p-benzoquinone-imine (NAPQI), a toxic free radical metabolite, exceeded the detoxification ability of glutathione (GSH), resulting in the covalent binding of NAPQI with sulphur-containing groups in proteins resulting in protein adducts. 6 At present, CH- and APAP-induced liver injury are clinically diagnosed using glutamatergic transaminase (ALT) and aspartate transaminase (AST) assays, but the specificity and sensitivity of such techniques are poor. Metabolomics-based techniques were first proposed by Nicholson et al. in 1999. 7 Using high-throughput instruments, endogenous metabolites can be dynamically analysed to study the overall biological status and functional regulation of the organism. It has been widely used in disease diagnosis, mechanism exploration, and drug development. 8 Using metabolomics to investigate the metabolite changes associated with CH- and APAP-induced liver injury will provide a basis for the mechanism exploration and early biomarker identification of such liver injury.
Lysophosphatidylcholines (LPCs) are bioactive lipids that regulate various cellular functions. Their general structure is shown in Figure 1. As the most important carrier of fatty acids in serum, LPCs can participate in many physiological and pathological processes through the G protein-coupled receptor p38 MAPK and NF-κB pathways; they also affect various biological functions mediated by Toll-like receptors, such as inducing the migration of lymphocytes and macrophages, increasing the production and release of pro-inflammatory cytokines, exacerbating oxidative stress, and promoting apoptosis.9,10 Moreover, they contribute to various diseases, including cardiovascular disease,
11
Alzheimer’s disease,
12
atherosclerosis,
13
and diabetes.
14
The liver is the primary organ for LPC synthesis and catabolism. Lysophosphatidylcholines are a death effector of hepatocyte apoptosis, leading to apoptosis mediated by GSK/JNK and caspase activation in hepatocytes; their levels closely correlate with liver injury status and liver reserve function. LPCs are the most abundant class of phospholipids in serum. Considerable changes in serum LPC levels can occur due to liver disease and drug-induced liver injury (DILI). The serum levels of LPC(16:0), LPC(18:0), LPC(18:2), LPC(18:3), LPC(20:3), and LPC(20:5) in patients with liver cirrhosis caused by hepatitis B virus decreased significantly.
15
The concentrations of LPC(16:0), LPC(18:0), and LPC(18:1) in the serum of mice with non-alcoholic steatohepatitis deviated from normal values.
16
LPCs may be key biomarkers for liver disease and DILI. General formula of LPC structure. LPC(A:B), A: The number of carbon in “-R=O-”, B: The number of double bonds in “-R”.
Here, liquid chromatography-triple quadrupole tandem mass spectrometry (LC-QqQ-MS/MS) was used for quantitatively analysing LPCs in biological samples. QqQ-MS/MS cannot effectively exclude interferences in complex matrices. TOF-MRM acquisition mode in ultra-performance liquid chromatography quadrupole time-of-flight mass spectrometry (UPLC-Q-TOF-MS/MS) has a target gain function to selectively increase the duty ratio of target fragments, improving the response and selectivity for determining LPC level in serum. 17 In this study, based on the pharmacological experiments on rats with CH- and APAP-induced liver injury, the targeted metabolomics method based on TOF-MRM was used to analyse the changes in serum LPC metabolic profile after CH and APAP administration to explore the correlation between the hepatotoxicity of CH and APAP and metabolic profile of LPCs and to screen biomarkers characterizing CH- and APAP-induced liver injury, providing a new method for clinically diagnosing such liver injury.
Materials and methods
Chemicals and reagents
The reference standards of LPC(13:0) (internal standard, IS), LPC(14:0), LPC(16:0), LPC(17:0), LPC(18:1) and LPC(20:0) were purchased from Avanti Polar Lipids Inc. (Alabaster, AL, USA). Mass spectrometry grade-methanol and acetonitrile were obtained from Merck Inc. (Darmstadt, HE, Germany). Analytical reagent-chloroform and HPLC grade-formic acid were purchased from Xilong Technology Co., Ltd. (Shantou, China). Phosphate buffer saline (PBS) was supplied by Servicebio Technology Co., Ltd. (Wuhan, China). Bovine serum albumin (BSA) was provided by Energy Chemical Technology Co., Ltd. (Shanghai, China). CH and APAP were purchased from Tokyo Chemical Industry Co., Ltd. (Tokyo, Japan). Isoflurane was supplied by RWD Life Science CO., Ltd. (Shenzhen, China)
Animal treatment
32 Sprague-Dawley male rats (SPF grade, Certificate number: SCXK2020-0002) weighting 200 ± 20 g at 7 to 9-week-old were provided by Hunan Shrek Jingda Experimental Animal Technology Co. Ltd. (Changsha, China). Before starting the experiment, the animals were asked to acclimatize in ordinary cages for 7 days under normal laboratory conditions of 12 h-light/dark cycle, relative humidity of 60 ± 5% and room temperature of 24 ± 2°C, and with free access to commercial pellet diet and tap water. All the animals were handled in accordance with the Guide for the Care and Use of Laboratory Animals of the National Institutes of Health. The study protocols were approved by Animal Ethics Committee of Jiangxi Science and Technology Normal University. After one-week of adaptive feeding, the rats were left unfed overnight and divided randomly into four groups. The CH-treated group (n = 8) was administered by intraperitoneal injection with CH (90 mg·kg−1, 25 mg·mL−1 in normal saline), while CH vehicle group (n = 8) treated with an equal volume of the vehicle. The APAP-treated group (n = 8) were given orally with 180 mg·mL−1APAP (1500 mg·kg−1) dissolved in 0.5% sodium carboxymethyl cellulose (CMC-Na), while APAP vehicle group (n = 8) dosed with oral gavage of 0.5% CMC-Na. After CH and APAP treatment 24 h, blood samples were collected and then centrifuged for 5 min (4°C, 3500 × g) to obtain serum for biochemical indicators assay and LPC metabolic profile analysis. All the rats were sacrificed by lasting and high-density isoflurane, and then livers were subsequently collected for histopathological study.
Biochemical assays and histopathology examination
Serum biomedical indicators containing alanine aminotransferase (ALT), and aspartate aminotransferase (AST) were estimated by automatic biochemical analyser (Chemray 240, Rayto, China) according to the according to the instructions of the commercial analyte-specific kit (Rongsheng Biotech, China). Hematoxylin and eosin (H&E) sections of liver were prepared for histopathology examination by optical microscope (Eclipse E100, Nikon, Japan).
Preparation of stock solutions
2 mg∙mL−1 analyte stock solution was prepared with LPC(14:0), LPC(16:0), LPC(17:0), LPC(18:1) and LPC(20:0) standards dissolved in methanol-chloroform (1:1, v/v). The same method was utilized to produce 2 mg∙mL−1 LPC(13:0) as the IS stock solution. All the stock solutions were stored at −20°C and diluted during use.
Sample preparation
Serum samples (20 μL) spiked with 20 μL IS (100 μg·mL−1) were vortex-mixed with 160 μL methanol-chloroform (1:1, v/v) for 5 min. After centrifuging for 10 min (4°C, 12,000 × g), 40 μL supernatant was taken out and then diluted with 760 μL methanol-acetonitrile (3:1, v/v). 2 μL aliquots were injected into the UPLC-Q-TOF-MS/MS for analysis.
UPLC-Q-TOF-MS/MS analysis
TOF-MRM parameters of LPCs.

Method validation
Both quality control (QC) samples at three different concentrations (low, 0.050 μg/mL; medium, 0.500 μg/mL; high, 7.500 μg/mL) and 10 calibration samples (0.025, 0.050, 0.125, 0.250, 0.500, 1.000, 2.500, 5.000, 7.500 and 10.000 μg/mL) were prepared with simulated serum composing 1% BSA in PBS, in view of the endogenous level of LPCs in serum. 18 The method was validated by testing parameters concerning linearity, precision, accuracy, extraction recovery and matrix effect with reference to U.S. FDA and EMEA guidance for bioanalytical method validation.19,20 The calibration curves were established by plotting the peak area ratio (y) of LPC to the IS versus the nominal concentration (x) of LPC standards, calculated with weighted least square linear regression. The constructed calibration curves will be used for the relative quantitative analysis of the LPCs in the serum. Intra- and inter-day precision and accuracy were evaluated with QC samples and lower limit of quantification (LLOQ, 0.025 μg/mL) samples at the 3 consecutive days. Extraction recovery and matrix effect were examined with QC samples.
Data analysis
Concentration data was acquired and processed using the MassLynx 4.1 (Waters, Milford, MA, USA). Principal component analysis (PCA) and orthogonal partial least squares-discriminate analysis (OPLS-DA) were performed by SIMCA-P 14.1. Two-tailed student’ s t-test and Pearson’s correlation analysis were conducted through SPSS 25.0 (SPSS Inc., Chicago, IL, USA).
Results
Biochemical indicators and histopathological observations
The serum levels of ALT and AST were assayed at 24 h after CH and APAP administration. In the CH-treated group, the values of ALT and AST were 379.75 ± 66.24 U/L and 447.89 ± 124.01 U/L, respectively, which were markedly higher than the values of CH vehicle group, 226.54 ± 23.25 U/L (p < 0.001) and 282.11 ± 23.30 U/L (p < 0.001). Besides that, compared with the APAP vehicle group, the ALT and AST values in the APAP-treated group showed a significant increase, where the ALT and AST values were 144.77 ± 24.36 U/L and 192.57 ± 47.94 U/L in APAP-treated group in turn, while the those of APAP vehicle group were 108.47 ± 12.91 U/L (p < 0.001) and 133.58 ± 27.08 U/L (p < 0.01), respectively.
As shown in Figure 2, histological evaluation showed that all the vehicle groups displayed normal liver histology whereas CH- and APAP-treated groups showed several pathological damages that are irregular arrangement, membrane rupture, nuclear shrinkage for liver cells. The changed levels of biochemical indicators and histopathological alterations all indicated that the rats suffered from liver injury 24 h post-CH and APAP treatment. Histopathology of liver tissue 24 h after CH and APAP administration. Representative slides were shown at 400× magnifications. A/B, CH- and APAP-vehicle group; C/D, CH- and APAP-treated group.
Method validation
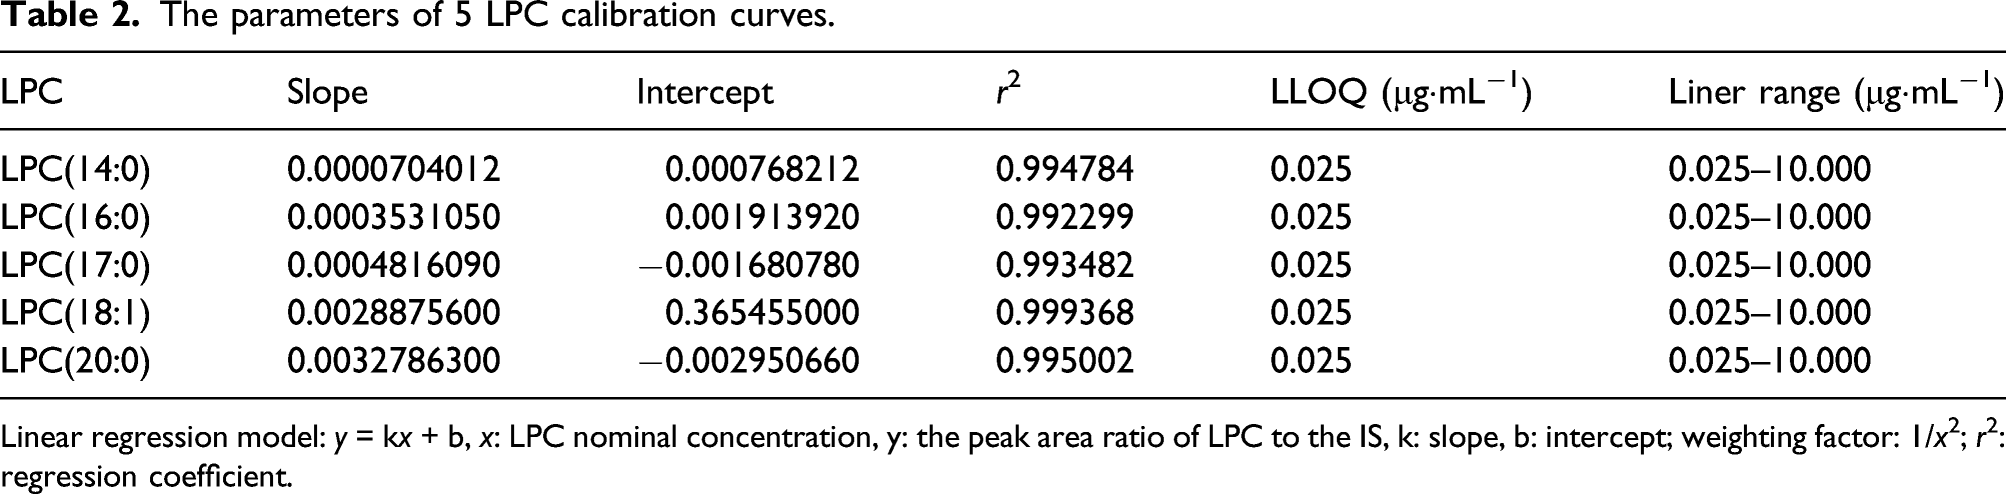
The TOF-MRM chromatograms of LPCs obtained from standards were shown in Figure 3. The 5 LPC calibration curves had good linearity in the range of 0.025–10.000 μg·mL−1 with linear regression coefficients (r2) greater than 0.99, and the relevant parameters were listed in Table 2. Accuracy was expressed as the ratios (calculated concentration/nominal concentration). Precision was displayed as the relative standard deviation (RSD%). The accuracies were in the range of 88.80%–104.33% and precisions were less than or equal to 14.31% for LLOQ. The accuracy and precision results of QCs were summarized in Table 3. In QCs, the accuracies were between 80.21% and 113.35% with precisions less than or equal to 9.83%. The results of recovery and matrix at three different levels were displayed in Table 3. The recoveries, except for 77.03% in medium QC sample of LPC(20:0), were in the range of 85.53%–104.41% with RSD% less than 8.35%. The matrix effects were between 87.65% to 115.4% with RSD% less than 9.23%. Taken together, the method proved to be reliable and applicable for LPCs analysis in serum. TOF-MRM chromatograms of LPC standards. 5 analyte standards including LPC(14:0), LPC(16:0), LPC(17:0), LPC(18:1) and LPC(20:0), and IS standard LPC(13:0). The parameters of 5 LPC calibration curves. Linear regression model: y = kx + b, x: LPC nominal concentration, y: the peak area ratio of LPC to the IS, k: slope, b: intercept; weighting factor: 1/x2; r2: regression coefficient. The results of accuracy, precision, extraction recovery and matrix effect.

Accuracy was expressed as calculated concentration/nominal concentration, and precision was represented as RSD%; extraction recovery and matrix effect denoted as mean ± SD.
UPLC-Q-TOF-MS/MS analysis of LPCs in rat serum
The validated analysis method was applied to determine the concentration of LPCs in rat serum. The TOF-MRM chromatograms of LPCs in rat serum were shown in Figure 4. LPCs could be separated well without interference from other endogenous metabolites in serum. Currently, due to a shortage of commercial LPC standards, serum LPCs without corresponding standards were quantified relatively using existing LPC curves with similar carbon atomic numbers. (Table 4). TOF-MRM chromatograms of LPCs from rat serum. 15 LPCs in the rat serum were well separated and detected by the method. The concentration results of serum LPCs in CH vehicle rats and CH -treated rats, as well as APAP vehicle rats and APAP-treated rats ( Concentration data were represented as mean ± SD, *p < 0.05, **p < 0.01 and ***p < 0.001 versus corresponding vehicle groups.

The concentrations of 15 LPCs were simultaneously quantified in the rat serum. The concentration results were presented in Table 4, and the concentration ratio results of the administered group over the vehicle group were shown in Figure 5. Most LPC levels showed a downward trend, after APAP and CH treatment. 10 LPCs were significantly lower in the CH-treated group than the CH vehicle group, with a 3-fold reduction in LPC(16:1). 5 LPCs showed remarkable changes between the APAP-treated group and the APAP vehicle group, where LPC(20:5) was marvellous with a 36-fold increase in the APAP treatment group over the corresponding vehicle group. The ratio of serum LPCs concentration in the CH-treated group (a) and APAP-treated group (b) compared to their corresponding vehicle group. Statistical tests were performed by using the two-tailed Student’s t test (*p < 0.050, **p < 0.010, ***p < 0.001).
Multivariate statistics analysis
To further investigate the role of metabolic profiling of LPC in the discrimination of hepatotoxicity, multivariate statistics analyses including PCA, OPLS-DA and correlation analysis were performed.
After data standardization, 15 variables were analysed by PCA with two principal components (PC1 and PC2). The two explained 78.3% and 93.2% of the systematic variation in CH and APAP, respectively. As shown in the two-dimension score plot (Figure 6), the APAP-treated group and CH-treated group discriminated from the corresponding vehicle groups, suggesting that the APAP- and CH-induced liver injury was closely related to the serum LPC metabolic profile. The two-dimensional score plot of the OPLS-DA model (Figure 7) displayed that the CH-treated and APAP-treated groups were clearly distinguished and both deviated from the corresponding vehicle groups, indicating that the types of CH- and APAP-induced liver injury could be discriminated through the LPC metabolic profile. The PCA score plot of serum LPCs in CH vehicle rats and CH-treated rats (a), as well as APAP vehicle rats and APAP-treated rats (b). Two-dimensional visualization of the two PC scores for samples. The score plots indicated a clear separation between the CH/APAP-treated and vehicle groups. The OPLS-DA score plot of serum LPCs from vehicle groups and APAP- and CH- treated rat groups. The score plots showed that the two vehicle groups gathered, and the CH and APAP-treated groups were obviously separated and all deviated from the vehicle groups.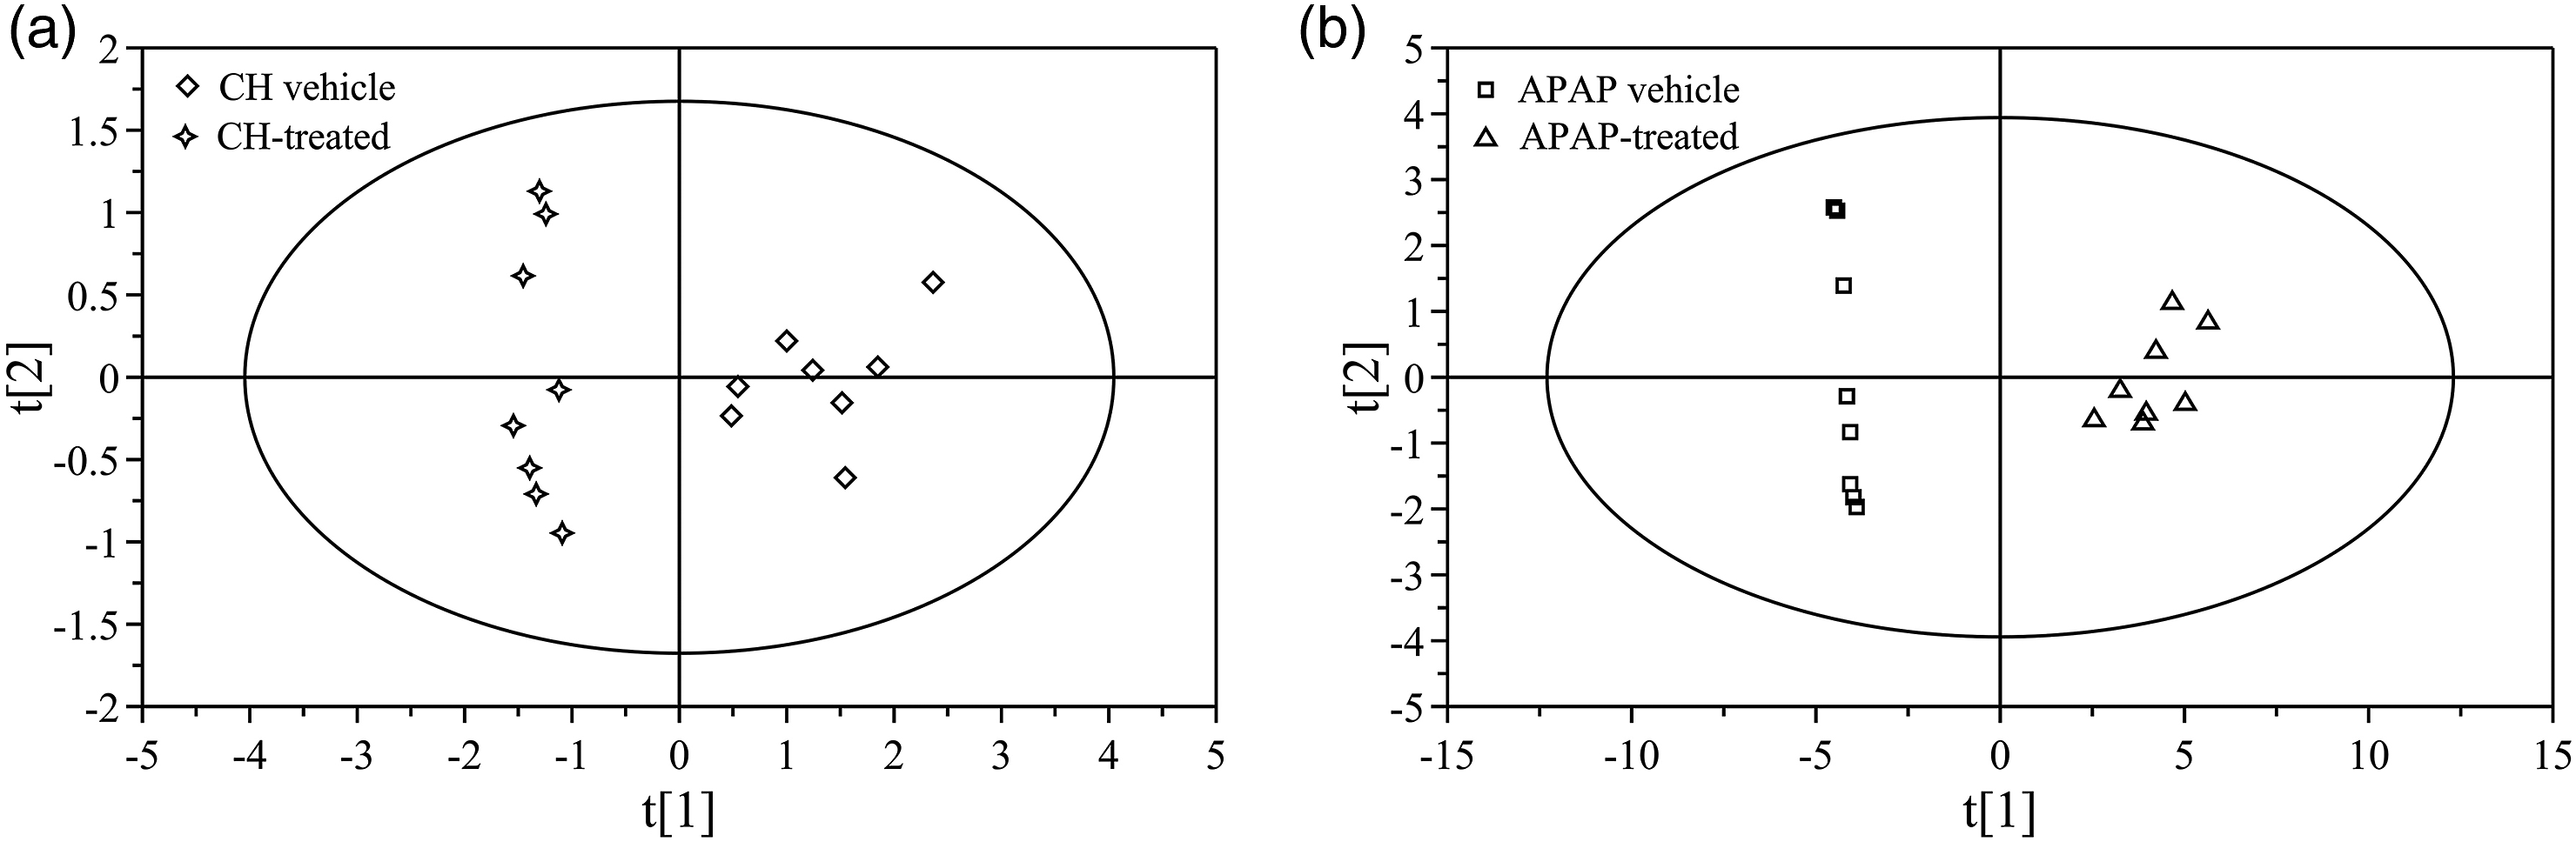

The OPLS-DA models of CH and APAP were constructed, separately. The R2X, R2Y and Q2Y in the former were 73%, 97.6% and 94.9%, respectively, and those of the latter were 86.5%, 98.1% and 95.8% in turn, which indicated that the OPLS-DA models had good explanatory ability and high prediction accuracy for the original data.
21
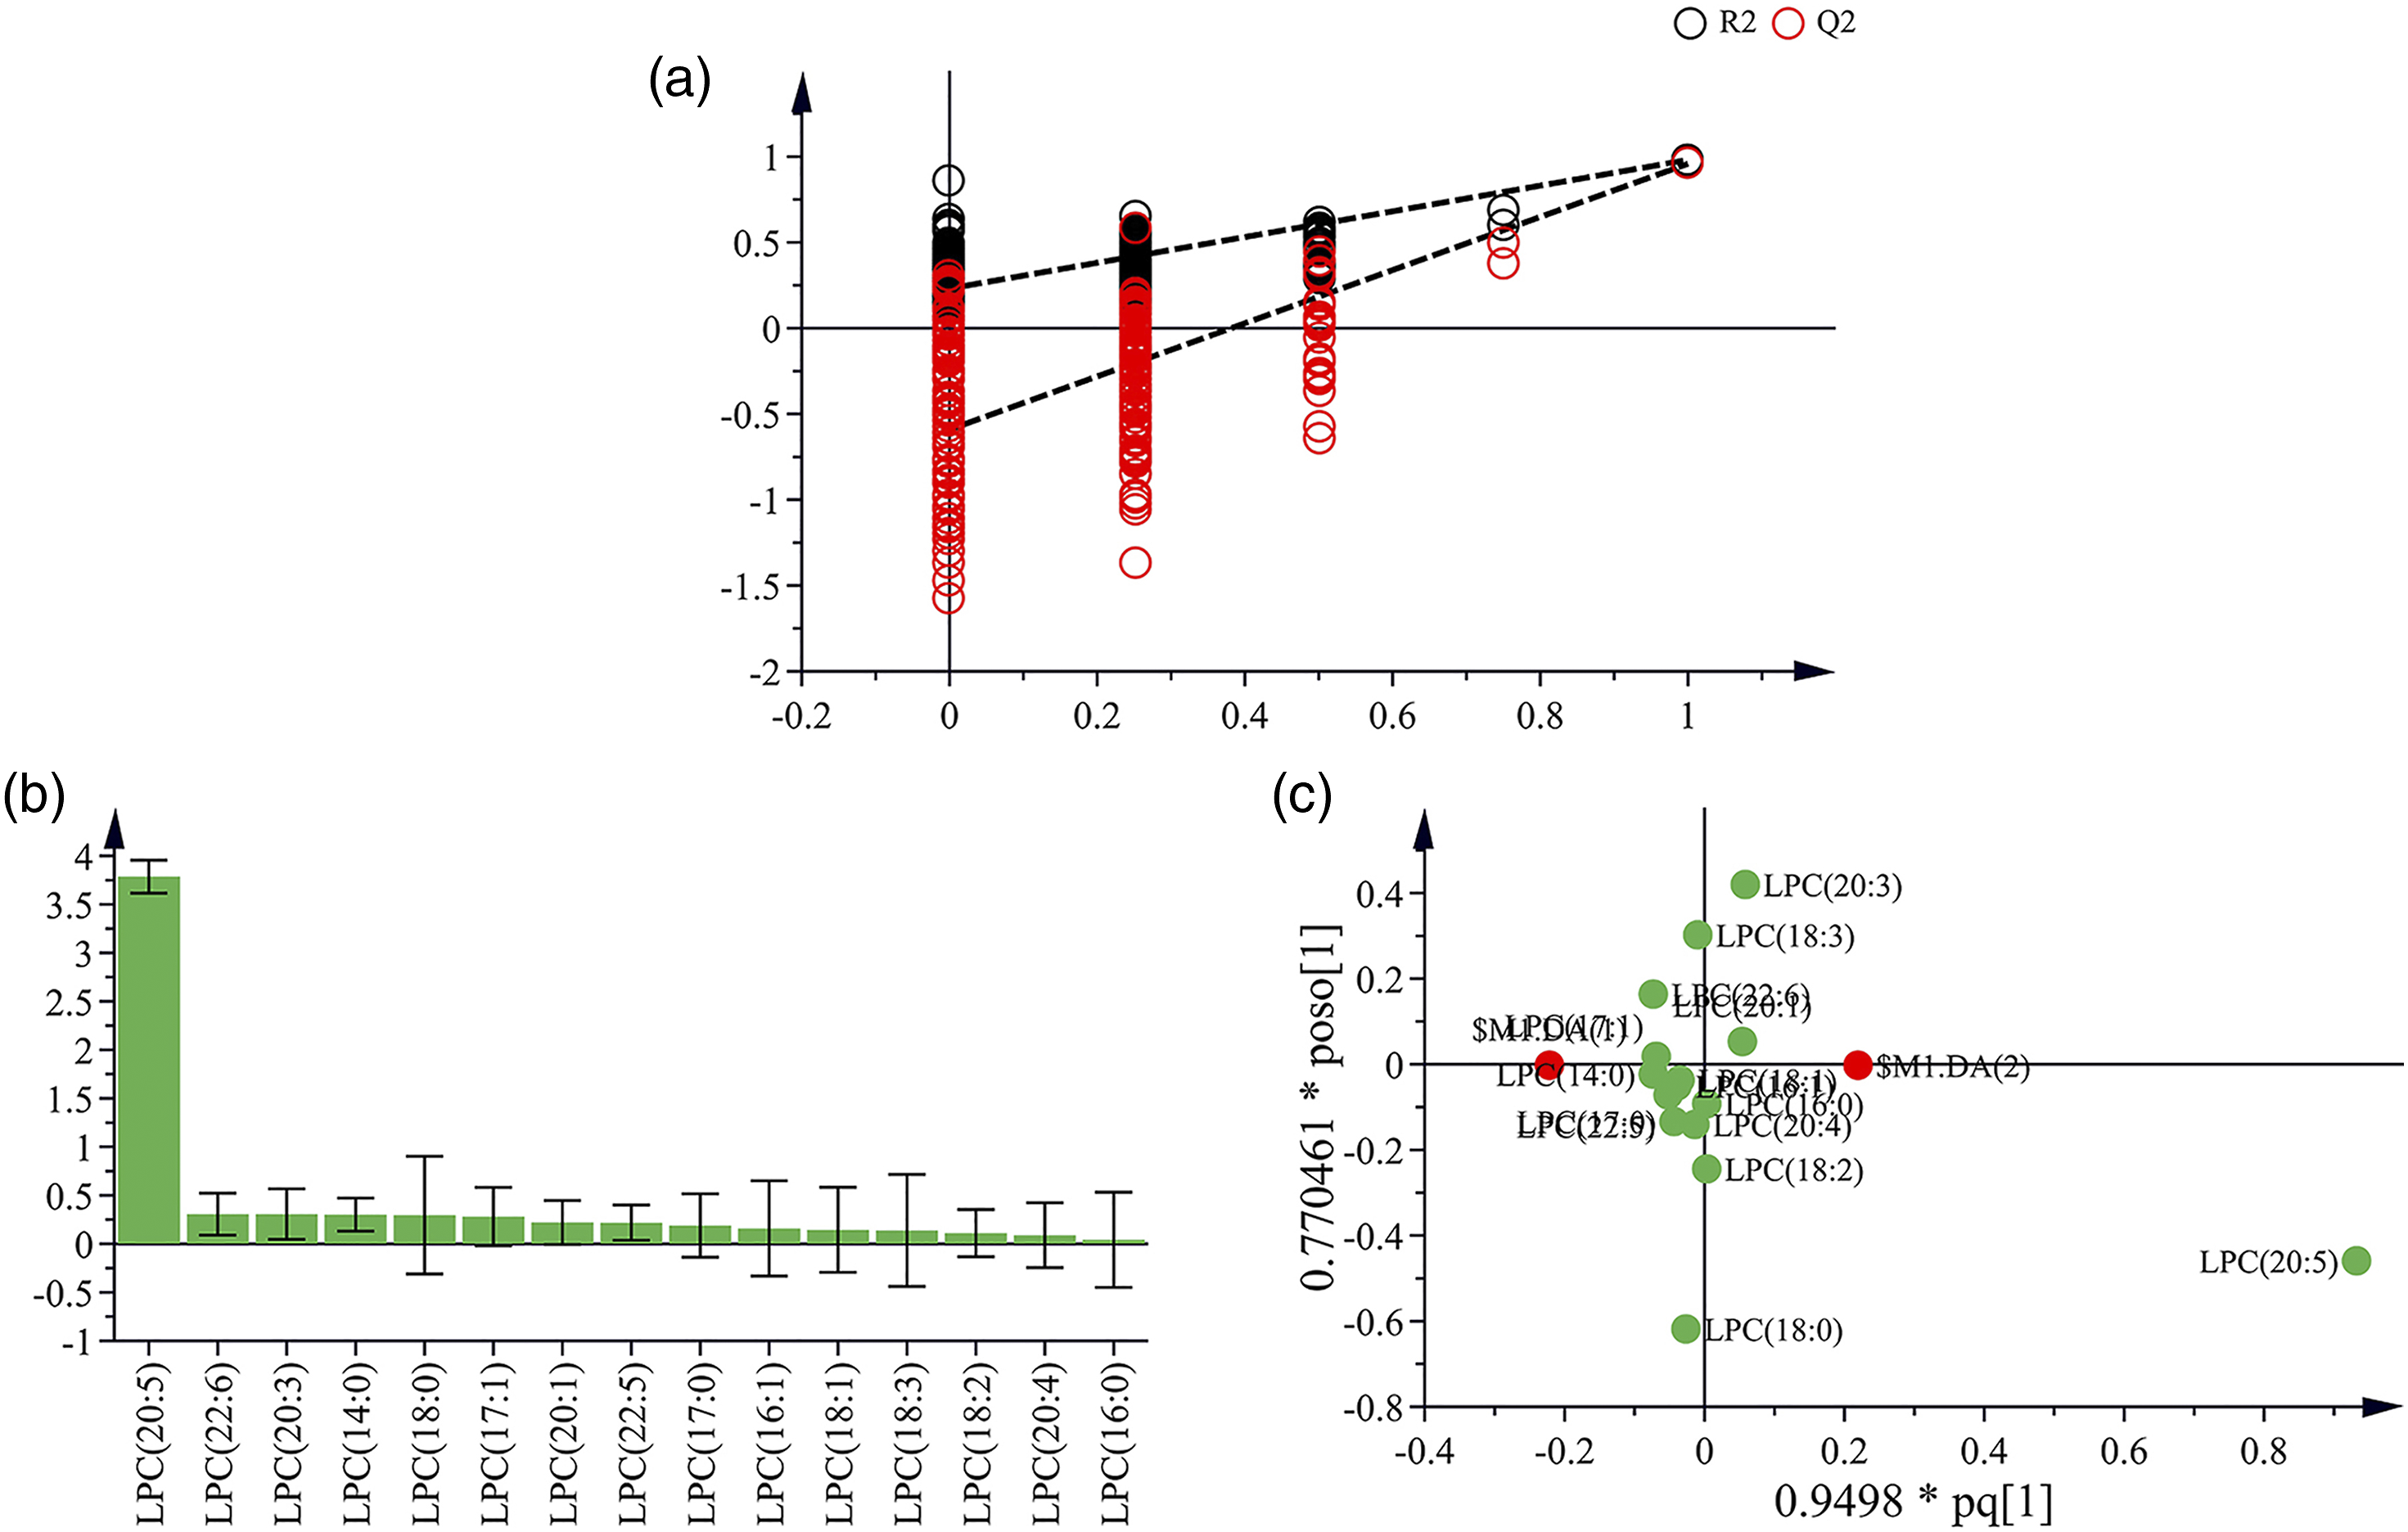
Furthermore, the OPLS-DA models for CH (Figure 8(a)) and APAP (Figure 9(a)) were validated by permutation (200 times). The values of R2 and Q2 in the two OPLS-DA models were both lower than the original values and the intercept values of the Q2 regression lines were less than zero, which suggested that both OPLS-DA models were not overfitted and could be used for discovering potential biomarkers.
22
Analysis of potential biomarkers of CH-treated groups using OPLS-DA. The OPLS-DA model (R2X = 73%, R2Y = 97.6%, and Q2 = 94.9%) was constructed based on the metabolic profile of LPCs from vehicle and CH-treated groups. (a) The result of permutation test (n = 200) indicated the original OPLS-DA model was valid. (b) VIP plot confirmed the significance of these potential biomarkers in classification (VIP > 1.0). (c) The OPLS loading plot showed the correlation between individual LPC and CH-induced liver injury. Analysis of potential biomarkers of APAP-treated groups using OPLS-DA. The OPLS-DA model (R2X = 86.5%, R2Y = 98.1%, and Q2 = 95.8%) was constructed based on the metabolic profile of LPCs from vehicle and APAP-treated groups. (a) The result of permutation test (n = 200) indicated the original OPLS-DA model was valid. (b) VIP plot confirmed the significance of these potential biomarkers in classification (VIP > 1.0). (c) The OPLS loading plot showed the correlation between individual LPC and APAP-induced liver injury.
The results of Pearson’s correlation analysis of serum biomarkers and biochemical indexes in rats with liver injury induced by CH and APAP.

r, correlation coefficient. |r| > 0.5 and p < 0.05 indicated good correlation between two variables.
Discussion
The liver, the main site of biotransformation and detoxification in vivo, is one of the most vulnerable organs to drug-induced damage. Drug-induced liver injury (DILI) is a common clinical adverse reaction, which is the main developmental obstacle (termination, approval denial, use restriction, and withdrawal from the market) for multiple drugs. 23 Traditional methods of hepatotoxicity studies usually rely on histopathological findings and biochemical indicators to detect toxicity, and their changes mostly occur after substantial damage to the liver, with low sensitivity and specificity. 24 For a long time, researchers mainly focused on various genes or proteins related to liver injury, such as miR-122, miR-155, glutathione-S-transferase, and paraoxonase, to study DILI. 25 However, the development of DILI involves many physiological and biochemical processes, including mitochondrial damage, oxidative stress, and immune response.26–28 In addition to genes, proteins, and other macromolecules, the levels of endogenous small molecules in the body are also altered.
Metabolomics has been developed for over 20 years, improving various fields of medicine and life sciences, especially in disease diagnosis, individualized treatment, and drug toxicity evaluation, showing good prospects for application. 29 In DILI studies, metabolomics provides rapid screening of toxicity-related biomarkers by comparing the metabolic profiles of liver tissue extracts, plasma, serum, urine, and other biological samples before and after drug intervention, providing comprehensive information for evaluating drug hepatotoxicity and elucidating mechanisms. 30
APAP is currently present in over 600 different prescription and over-the-counter medications. 31 Due to the widespread use of APAP-containing drugs, patients can intentionally or unintentionally overdose on them, and overdoses of APAP can lead to varying degrees of liver damage and even acute liver failure. 32 CH is a representative classic antipsychotic drug widely used in primary hospitals because of its low price; however, it has many adverse reactions, especially liver damage. 33
In this study, the results of the pharmacological experiment showed that the serum ALT and AST levels and liver pathology after CH/APAP administration were significantly different from those in the normal group 24 h, indicating that an overdose of APAP and CH may cause severe hepatotoxicity at 24 h. LPCs are produced via lecithin cholesterol acyltransferase from phosphatidylcholines (PCs). In contrast, under the action of metabolic enzymes, such as lysophosphatidylcholine acyltransferase, lysophospholipase A1, and intra-nucleotide pyrophosphatase/phosphodiesterase, LPCs can be catabolized and converted into PCs. The LPC metabolism occurs mainly in the liver, and liver damage is reflected as fluctuations in serum LPC levels. Therefore, it is crucial to study serum LPC level for diagnosing and preventing CH- and APAP-induced liver injury. In this study, TOF-MRM combined with a multivariate statistical analysis method was used to analyse the serum LPC metabolism profile of rats with APAP- and CH-induced liver injury. This study quantitatively showed that the overall level of LPCs decreased after CH administration, among which 10 LPC levels were significantly lower than the normal group; 5 LPCs were significantly different from the normal group after APAP administration. Multivariate statistical analysis revealed that the metabolic profile of serum LPCs was closely related to CH and APAP hepatotoxicity, identifying biomarkers that can characterize CH and APAP-induced liver injury. Relevant CH biomarkers were LPC(18:2), LPC(14:0), LPC(20:4), LPC(18:1), LPC(16:1), LPC(17:1), and LPC(20:1); the APAP biomarker was LPC(20:1). These results suggest that it is feasible to evaluate the hepatotoxicity of APAP and CH from the metabolic profile of serum LPC.
LPCAT, a key enzyme in the Lands cycle, is located in the endoplasmic reticulum and involved in the synthesis of LPCs.
34
PCs are important components of biofilm and can protect cells and their organelles from oxidative stress, lipotoxicity, and endoplasmic reticulum stress.
35
After liver injury, including DILI, alcoholic liver injury, and non-alcoholic steatohepatitis, the PC demand increases, and LPC content decreases, because the body’s automatic defence function induces the activation of large amounts of LPCAT to process LPC and synthesize PC in liver lesions.36,37 This may be the mechanism by which LPC levels were reduced after CH and APAP administration in this study. In addition, the increased demand for PCs may be used to produce large amounts of arachidonic acid (AA) regulated by phospholipase A2 (PLA2).
38
AA, a type of ω-6 polyunsaturated fatty acid, is a synthetic precursor of inflammatory mediators such as prostaglandin, leukotriene, and thrombotin.
39
The main metabolic pathways of AA in the liver involve cytochrome P450 (CYP450) ω-hydroxylation and the CYP450 epoxygenase; CYP4A and CYP4F catalyse AA to synthesize 20-hydroxyeicosatetraenoic acid (20-HETE), and AA generates epoxyeicosatrienoic acids (EETs) with the help of CYP2C and CYP2J family members. When the liver is damaged by drugs, the expression levels of CYP4A and CYP4F increase,40,41 while the expression levels of CYP2C and CYP2J decrease.42,43 AA can activate the inflammatory-cascade-associated metabolic pathway and induce the inflammatory injury metabolism of the liver to produce several inflammatory factors.
44
The potential functional mechanism of CH- and APAP-induced liver injury is summarized in Figure 10. Oxidative stress, inflammatory reaction, and lipid metabolism disorder may mediate CH- and APAP-induced liver injury. The potential functional mechanism of CH- and APAP-induced liver injury. The up-regulated enzymes or metabolites were labeled with red and down-regulated with blue, respectively. Oxidative stress, inflammatory reaction and lipid metabolism disorder may be the mechanisms of CH- and APAP-induced liver injury.
In the liver, LPC up-regulates genes involved in cholesterol synthesis and down-regulates genes involved in hepatic fatty acid oxidation. 45 High levels of LPCs disrupt mitochondrial integrity and increase cytochrome C release in hepatocytes. LPCs have multiple biological functions in organisms, such as pro-inflammatory functions, oxidative stress, and the induction of apoptosis. 46 The pro-inflammatory role of LPC in many diseases has been widely reported. 47 LPCs can attract inflammatory cells to increase the release of inflammatory factors such as IL-1β, IL-8, IFN-γ, IL-6, and IL-5 by increasing the production of chemokines. 48 Caspase-1, a member of the pro-inflammatory caspase family, activates IL-1β and IL-18. LPCs promote caspase-1 release in a Na+-dependent fashion, regulating inflammation. 49 Moreover, LPCs, especially LPC(16:0), LPC(18:1), and LPC(20:4), can induce AP-1 binding to the C/EBP of IL-6 and IL-8 by activating the ERK1/2/C-JUN/PKC promoter region to increase the release of IL-6 and IL-8. 50 The mechanism of LPC-mediated inflammatory response is also associated with NF-κB, Notch, and PI3K/Akt signalling pathways.51–53 LPCs participate in many signal transduction effects and play a key role in liver oxidative function. As major components of oxidatively damaged low-density lipoproteins, LPCs can cause reactive oxygen species (ROS) production by activating MAPK and altering cytoplasmic Ca2+ levels.54,55 In hepatocytes, LPCs can activate ERK1/2 signalling by generating mitochondrial ROS, leading to decreased intracellular SOD and GSH-PX contents and increased MDA and ROS contents. 56 Many mechanisms are involved in the induction of apoptosis by LPC, the main ones being the activation of caspase, inward calcium flow, and release of cytochrome C. 57 In addition, LPCs can also increase FasL expression level by activating the NF-κB signalling pathway, thereby inducing apoptosis. 58
In the study, metabolomics based on TOF-MRM were used to study the hepatotoxicity of APAP and CH from the perspective of serum LPC metabolic profile. These results indicated that the LPC metabolic profile was closely related to CH- and APAP-induced hepatotoxicity and provided biomarkers that can characterize CH- and APAP-induced liver injury. Thus, serum LPC profile has the potential to become a new biomarker for clinically diagnosing APAP- and CH-induced liver injury.
Footnotes
Declaration of conflicting interests
The author(s) declared no potential conflicts of interest with respect to the research, authorship, and/or publication of this article.
Funding
The author(s) disclosed receipt of the following financial support for the research, authorship, and/or publication of this article: This work was supported by the National Natural Science Foundation of China (NSFC No, 81660692 and 81960732).