
Abstract
Drug-induced nephrotoxicity is widespread and seriously affects human health. Vancomycin is a classical glycopeptide antibiotic. Vancomycin is widely used for severe infections caused by Gram-positive bacteria, especially methicillin-resistant Staphylococcus aureus but its obvious nephrotoxicity affects the safety of its clinical application. However, the etiology of vancomycin induced kidney injury is not well understood. This study aimed to explore the potential mechanism of vancomycin-induced nephrotoxicity in rats. Vancomycin (400 mgkg−1) was used to establish kidney injury models in rats. A metabonomic approach was employed using ultra-performance liquid chromatography coupled with quadrupole-time-of-flight mass spectrometry (UHPLC-Q-TOF/MS) to delineate metabolic alterations. As a result, 15, 22, and 37 biomarkers were identified in urine samples from the treatment group compared to the control model on D2, D4, and D7, respectively. Changes in the levels of these metabolites indicated that amino acid metabolism and energy metabolism were disturbed in rats with vancomycin-associated nephrotoxicity. This study revealed the kidney effect of vancomycin, which may provide novel and promising research approaches to vancomycin-induced renal toxicity.
Keywords
Introduction
Vancomycin is a classical glycopeptide antibiotic which is the first choice for clinical methicillin-resistant Staphylococcus aureus (MRSA) infection because of its highly sensitive, moreover, glycopeptide antibiotics have no cross-resistance with other kinds of antibiotics. 1 Vancomycin is mainly used for severe infections caused by Gram-positive bacteria especially MRSA. However, the obvious renal toxicity affects the safety of its clinical application. 2 Renal toxicity caused by vancomycin may involve renal tubules, medullary loops and collecting ducts. According to the literature, 3 in the case of death caused by vancomycin adverse reaction, renal biopsy found acute tubular necrosis. Studies have shown 4 that vancomycin can increase the reabsorption function of renal tubular epithelial cells in a dose-dependent manner, thus changing mitochondrial function and causing oxidative stress. After administration, it increased anabolic glucose reactions, resulting in higher sorbitol and lactate levels both murine and canine renal epithelial cell lines, also it results differences in the lipidome. 5 The concentration-dependent increase was evident in the release of lysophospholipids after vancomycin treatment (0.125–4 mg·/mL−1) for 24 h. 6 But it has not been reported that metabonomics study on the progression of renal injury by administration of vancomycin.
Organisms often respond in complicated and unpredictable ways and cause disease or organism injury. By measuring changes of metabolisms found in biological fluids and tissues together with mathematically modelling procedure, metabonomic offers fresh insight into the effects of drugs and disease. Metabonomic has been widely used in medical study and pharmaceutical research with its increasing coverage and high-throughput screening ability, covering the research fields of disease diagnosis and treatment, drug toxicity research, biomarker discovery, and disease mechanism exploration 7
Metabolomic biomarkers can reveal the metabolic differences in the physiological and pathological states of organisms dynamically and sensitively. Previous studies have explored the toxicological mechanism of drug-induced nephrotoxicity based on metabonomic and found potential or early biomarkers related to the process of nephrotoxicity, 8 providing strong support for disease diagnosis, treatment and prognosis. Using metabolomic technology, we can find the tiny changes of metabolites in the body.
Liquid chromatography-mass spectrometry (LC-MS), nuclear magnetic resonance (NMR) and gas chromatography-mass spectrometry (GC-MS) have been applied to non-targeted metabonomic research.9,10 Given its high sensitivity, extensive dynamic range, and good separation ability, 11 LC-MS has dominated the metabonomic arena and is being gradually applied to various fields. Metabonomic based on LC-MS has great potential for identifying biomarkers for disease diagnosis and drug-induced toxicity assessment by revealing the metabolic differences in the physiological and pathological states of organisms in a dynamic and sensitive manner. 12
Here, we used ultra-high performance liquid chromatography-tandem quadrupole time-of-flight mass spectrometry (UHPLC-Q‐TOF/MS) to analyze vancomycin-induced kidney injury in rats to explain the toxicological mechanisms of vancomycin to the kidney. We also explored the impaired pathway associated with the development of kidney injury.
Materials and methods
Reagents and materials
High pressure liquid chromatography (HPLC)-grade acetonitrile was purchased from TEDIA (Fairfield, USA) and formic acid were purchased from Dikma (USA), respectively. Deionized water was obtained from Wahaha Corporation (Hangzhou, China). BUN and Creatinine detection kit were purchased from Jiancheng Bioengineering Institute (Nanjing, China). ELISA Kit was obtained from Arigo (Taiwan, China). Vancomycin was purchased from LILLY Corporation (USA). All other chemicals were of analytical grade.
Animal experiment and sample collection
Male Sprague-Dawley rats (7-weeks old weighing approximately 250 g) were purchased from Hebei Medical University (Shijiazhuang, China). All the animal experiments were performed Hebei Province Experimental Animal Management Ordinance and the protocols were approved by the Hebei Medical University Laboratory Animal Research Ethics Committee (Shijiazhuang, China). All animals were fed with standard laboratory food and free water, acclimated for 1 week under standard conditions with a 12 h light/12 h dark cycle at about 25°C and 55% ± 5% relative humidity. These rats were randomly divided into the D2 treatment group (VCM were injected intraperitoneally for 2 days), D4 treatment group (VCM were injected intraperitoneally for 4 days), D7 treatment group (VCM were injected intraperitoneally for 7 days) and control groups (0.9% saline were injected intraperitoneally for 2,4 and 7 days) with 10 rats in each group. The first day of administration was designed as D1. Each rat in the treatment group was i. p. Administrated with vancomycin dissolved with 0.9% saline at a dosage of 400 mg/kg once daily, 13 and the control group was i. p. Administrated with 0.9% saline. All rats were placed in metabolic cages to collect 24 h urine (ensure obtain enough urine) after the final administration. When urine samples were collected, blood was draw by abdominal aorta after anaesthesia (i.p. Administrated with 2% Pentobarbital sodium 0.3 mL·100 g−1) and the centrifuged at 4000 r/min for 10 min to obtain serum. Urine samples and serum samples were immediately analyzed. Blood and kidney samples were obtained to determine nephrotoxic parameters after urine collection. The kidney was fixed and preserved in 10% formalin prior to analysis.
Serum biochemistry and histopathologic examination
The levels of blood urea nitrogen (BUN) and creatinine were measured using a detection kit, the level of kidney injury molecule-1 (KIM-1) was measured using rat ELISA Kit. Fixed kidneys were routinely processed for embedding in paraffin, sectioned and stained with hematoxylin and eosin, then dehydration mount. The processed tissues were observed under the microscope (Nikon Eclipse E100 Nikon Co. Tokyo, Japan) to obtain whether there was vancomycin induced kidney injury.
Sample preparation
The urine samples were centrifuged at 15,000 r/min for 10 min at 4°C, then filtered with microporous membrane (0.22 μm). Finally, the filtrated samples were diluted with distilled water at a ratio of 1:1 and vortex mixed for UHPLC-Q-TOF-MS analysis. For analytical method assessment, 50 μL each of all the urinary samples were pooled to get a pooled QC sample thatwould be tested during the analysis.
Instrumentation and measurement conditions
Separation of metabolites was conducted on the ACQUITY UPLC BEH C18 (2.1×150 mm, 1.7 μm, Waters, Manchester, UK) column and the column temperature was set at 30°C. The metabolic samples were performed on a UHPLC system (Shimadzu Nexera X2, Kyoto, Japan) coupled with a hybrid quadrupole time-of-flight tandem mass spectrometer (Triple-TOF5600+, ABSCIEX, Red-wood City, CA, USA). The mobile phase was a gradient elution of solution A (0.1% formic acid aqueous) and solution B (acetonitrile) with a flow rate of 0.3 mL min−1. The linear gradient elution profile was as follows:5% B in 0–1 min, 5%–10% B in 1–9 min, 10%–40% B in 9–25 min, 40%–95% B in 25–29 min, 95%–5% B in 29–30 min. An additional 5 min elution was performed to ensure column equilibration. The total analytical time for each sample was 35 min. The temperature of column and autosampler was kept at 30°C and 4°C, respectively. The injection volume was 5 μL.
The electrospray ionization (ESI) source was used in MS analysis. The collision energy (CE) and declustering potential (DP) were set at 10 V and 50 V in positive ion mode, and −10 V and −50 V in negative ion mode, respectively. The source temperature was 550°C. Ion source gas 1 (Gas1), ion source 2 (Gas2) and curtain gas (CUR) were 55 kPa, 55 kPa, and 35 kPa, respectively. The scan range was operated with the mass m/z 50–1000 Da and with a 0.2 s accumulation time. In addition, an automated calibration delivery system (CDS) was used to regulate the MS and MS/MS automatically. Nitrogen was selected as auxiliary gas and collision gas.
Sample stability analysis
The QC samples were applied to monitor the stability of the analytical system. They were added in the process of LC-MS and analyzed by Principal Component Analysis (PCA) model, a kind of unsupervised multi variate statistical method, provided an overview of all observations. The degree of aggregation of each sample at different time were examined and the stabilities were evaluated. The metabolomics sequence was designed as follows: QC samples were injected 5 times at the beginning and a QC sample was injected after every 4 real samples to ensure good stability and repeatability during analysis.
Investigation of sample stability and analyzing samples during their stable period are the guarantee to acquire reliable data. The Principal Component Analysis (PCA), a kind of unsupervised multivariate statistical method, provided an overview of all observations. It examined the degree of aggregation of each sample at different time points and evaluated their stabilities. In addition, relative standard deviation calculations were performed on the peak areas of potential biomarkers to further judge whether the samples were stable in each analysis mode.
Data analysis and data processing
The mass data acquired were imported into Progenesis QI data analysis software (Waters, USA) for peak alignment, picking, and normalization to produce peak intensities for retention time (tR) and m/z data pairs. The processed data set was imported into the SPSS Statistics21 software (IBM, USA) to do independent Student’s t-test to get the p-value. Then the data were launched to SIMCA-P 14.0 (Waters, USA) software for PCA and the Orthogonal Partial Least-Squares Discriminant Analysis (OPLS-DA).
The PCA can extract a few comprehensive variables to reflect the information of the original variables as much as possible, which is a mathematical method for dimension reduction. The calculation by PCA algorithm can be based on the aggregation of the two groups of samples, indicating whether there are significant differences between the two groups (experiment group and control group). The OPLS-DA is supervised discriminant analysis, which has the function of prediction, and can screen out clearly the difference variables between groups. Potential biomarkers were extracted from S-plots constructed following analysis with OPLS-DA, the differential metabolites between control and model groups were selected according to the q-value < 0.05, fold change (FC) ≥ 1.2or FC ≤ 0.8, coefficient of variance (CV) ≤ 30% (QC) and variable importance in projection (VIP)value >1. To judge the reliability and accuracy of the model, 200 permutation test methods were used for evaluation. Compound identification was conducted by comparing the mass spectrometry information of different compounds with the online HMDB (http://www.hmdb.ca/), METLIN(http://metlin.scripps.edu/) and KEGG (http://www.genome.jp/kegg/ligand.html) databases.
Results
Histopathology and biochemical examination
The results of histopathological examination are showed in Figure 1. Compared with control group, there was little change in nephridial tissue pathological section of treatment group on D2. Nephridial tissue pathological section of rats in treatment group changed significantly on D4 and D7 compared with control group. On D4, large number of renal tubules were dilated, the renal tubules wall became thin, necrotic debris or eosinophilic mass could be seen in some small tubules, and more epithelial cells of renal tubules were edematous, also the cytoplasm was loose and light stained. On D7, the treatment group exhibited more distinguishable changes. These features include the renal tubules were dilated and thinned, necrotic debris, inflammatory cell infiltrated, proliferation of kidney interstitial connective tissue, inflammation. Histopathological of the kidneys (A) D2, control group; (B) D2, treatment group; (C) D4, control group; (D) D4, treatmentgroup; (E) D7, control group; (F) D7, treatment group Representative H&E staining images of kidney tissue from three groups. Compared with the control group, the treatment group showed significant histological injury. Including increased tubular dilatation (black arrow), necrotizing debris can be seen in the cavity (yellow arrow), vacuoles appeared in the cytoplasm of renal tubular cells (red arrow). Renal tubular cell edema, cytoplasmic looseness and light staining (green arrow)Commented [A1]: Histopathological analysis for treatment group, and comparison between treatment group and control group.
The index of biochemical examinations.
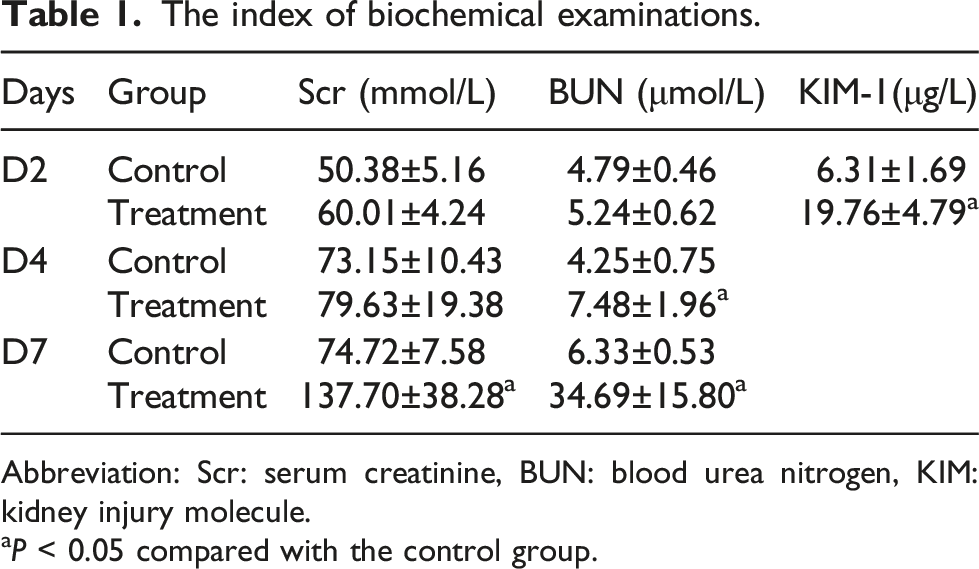
Abbreviation: Scr: serum creatinine, BUN: blood urea nitrogen, KIM: kidney injury molecule.
aP < 0.05 compared with the control group.
Data reliability analysis and Multivariate statistical analysis
PCA score map was shown in Figure 2, samples of control group and treatment group were well separated in positive and negative mode. In addition, an obvious aggregation state was observed among QC samples in PCA indicating that the experimental conditions of the first sampling from the first to the last sampling were all in stable state. (Figure 2). Plots of a multivariate statistical analysis based on metabolites and stability obtained from QC samples in the positive-ion mode in (A) D2, (C) D4, and (E) D7, and in the negative-ion mode (B) D2, (D) D4, and (F) D7.
Figure 3 showed the score plot and the result of permutation test made by OPLS-DA in positive and negative mode. The OPLS-DA model showed a complete separation between control group and treatment group. Furthermore, The R2Y and Q2 of the OPLS-DA model were shown in Table 2, which indicated the good predictability and validity of the model. Figure 4 showed the S-plot based on urinary metabolic profiling on D2, D4 and D7. Eventually 15, 22 and 37 kinds of endogenous metabolites were identified as the potential biomarkers of vancomycin induced kidney injury on D2, D4, and D7, respectively. The upregulation and downregulation of these metabolites are shown in Table 3. The OPLS-DA score plots and permutation tests of different groups in the positive-ion mode (A) D2, (C) D4, and (E) D7, and in the negative-ion mode (B) D2, (D) D4, and (F) D7. The parameters of OPLS-DA in D2, D4, and D7. S-plot based on urinary metabolic profiling of vancomycin nephrotoxicity in the positive-ion mode (A) D2, (C) D4, and (E) D7, and in the negative-ion mode (B) D2, (D) D4, and (F) D7. Identification and change trend of biomarkers from urinary metabolic profiling in D2, D4, and D7.


Metabolite enrichment
Figure 5 was the hierarchical clustering heat-map analysis between control group and treatment group. Each column represents the number of different metabolites in one sample, and the row exhibits the content of the same metabolite in different samples. The content of the metabolites is higher, the color is closer to red; and the lower the metabolites, the closer it is to blue. The results showed that the expression pattern of the same compound was obvious different between control group and treatment group. Hierarchical clustering heat-map analysis between the treatment and control groupsin (A) D2, (B) D4, and (C) D7.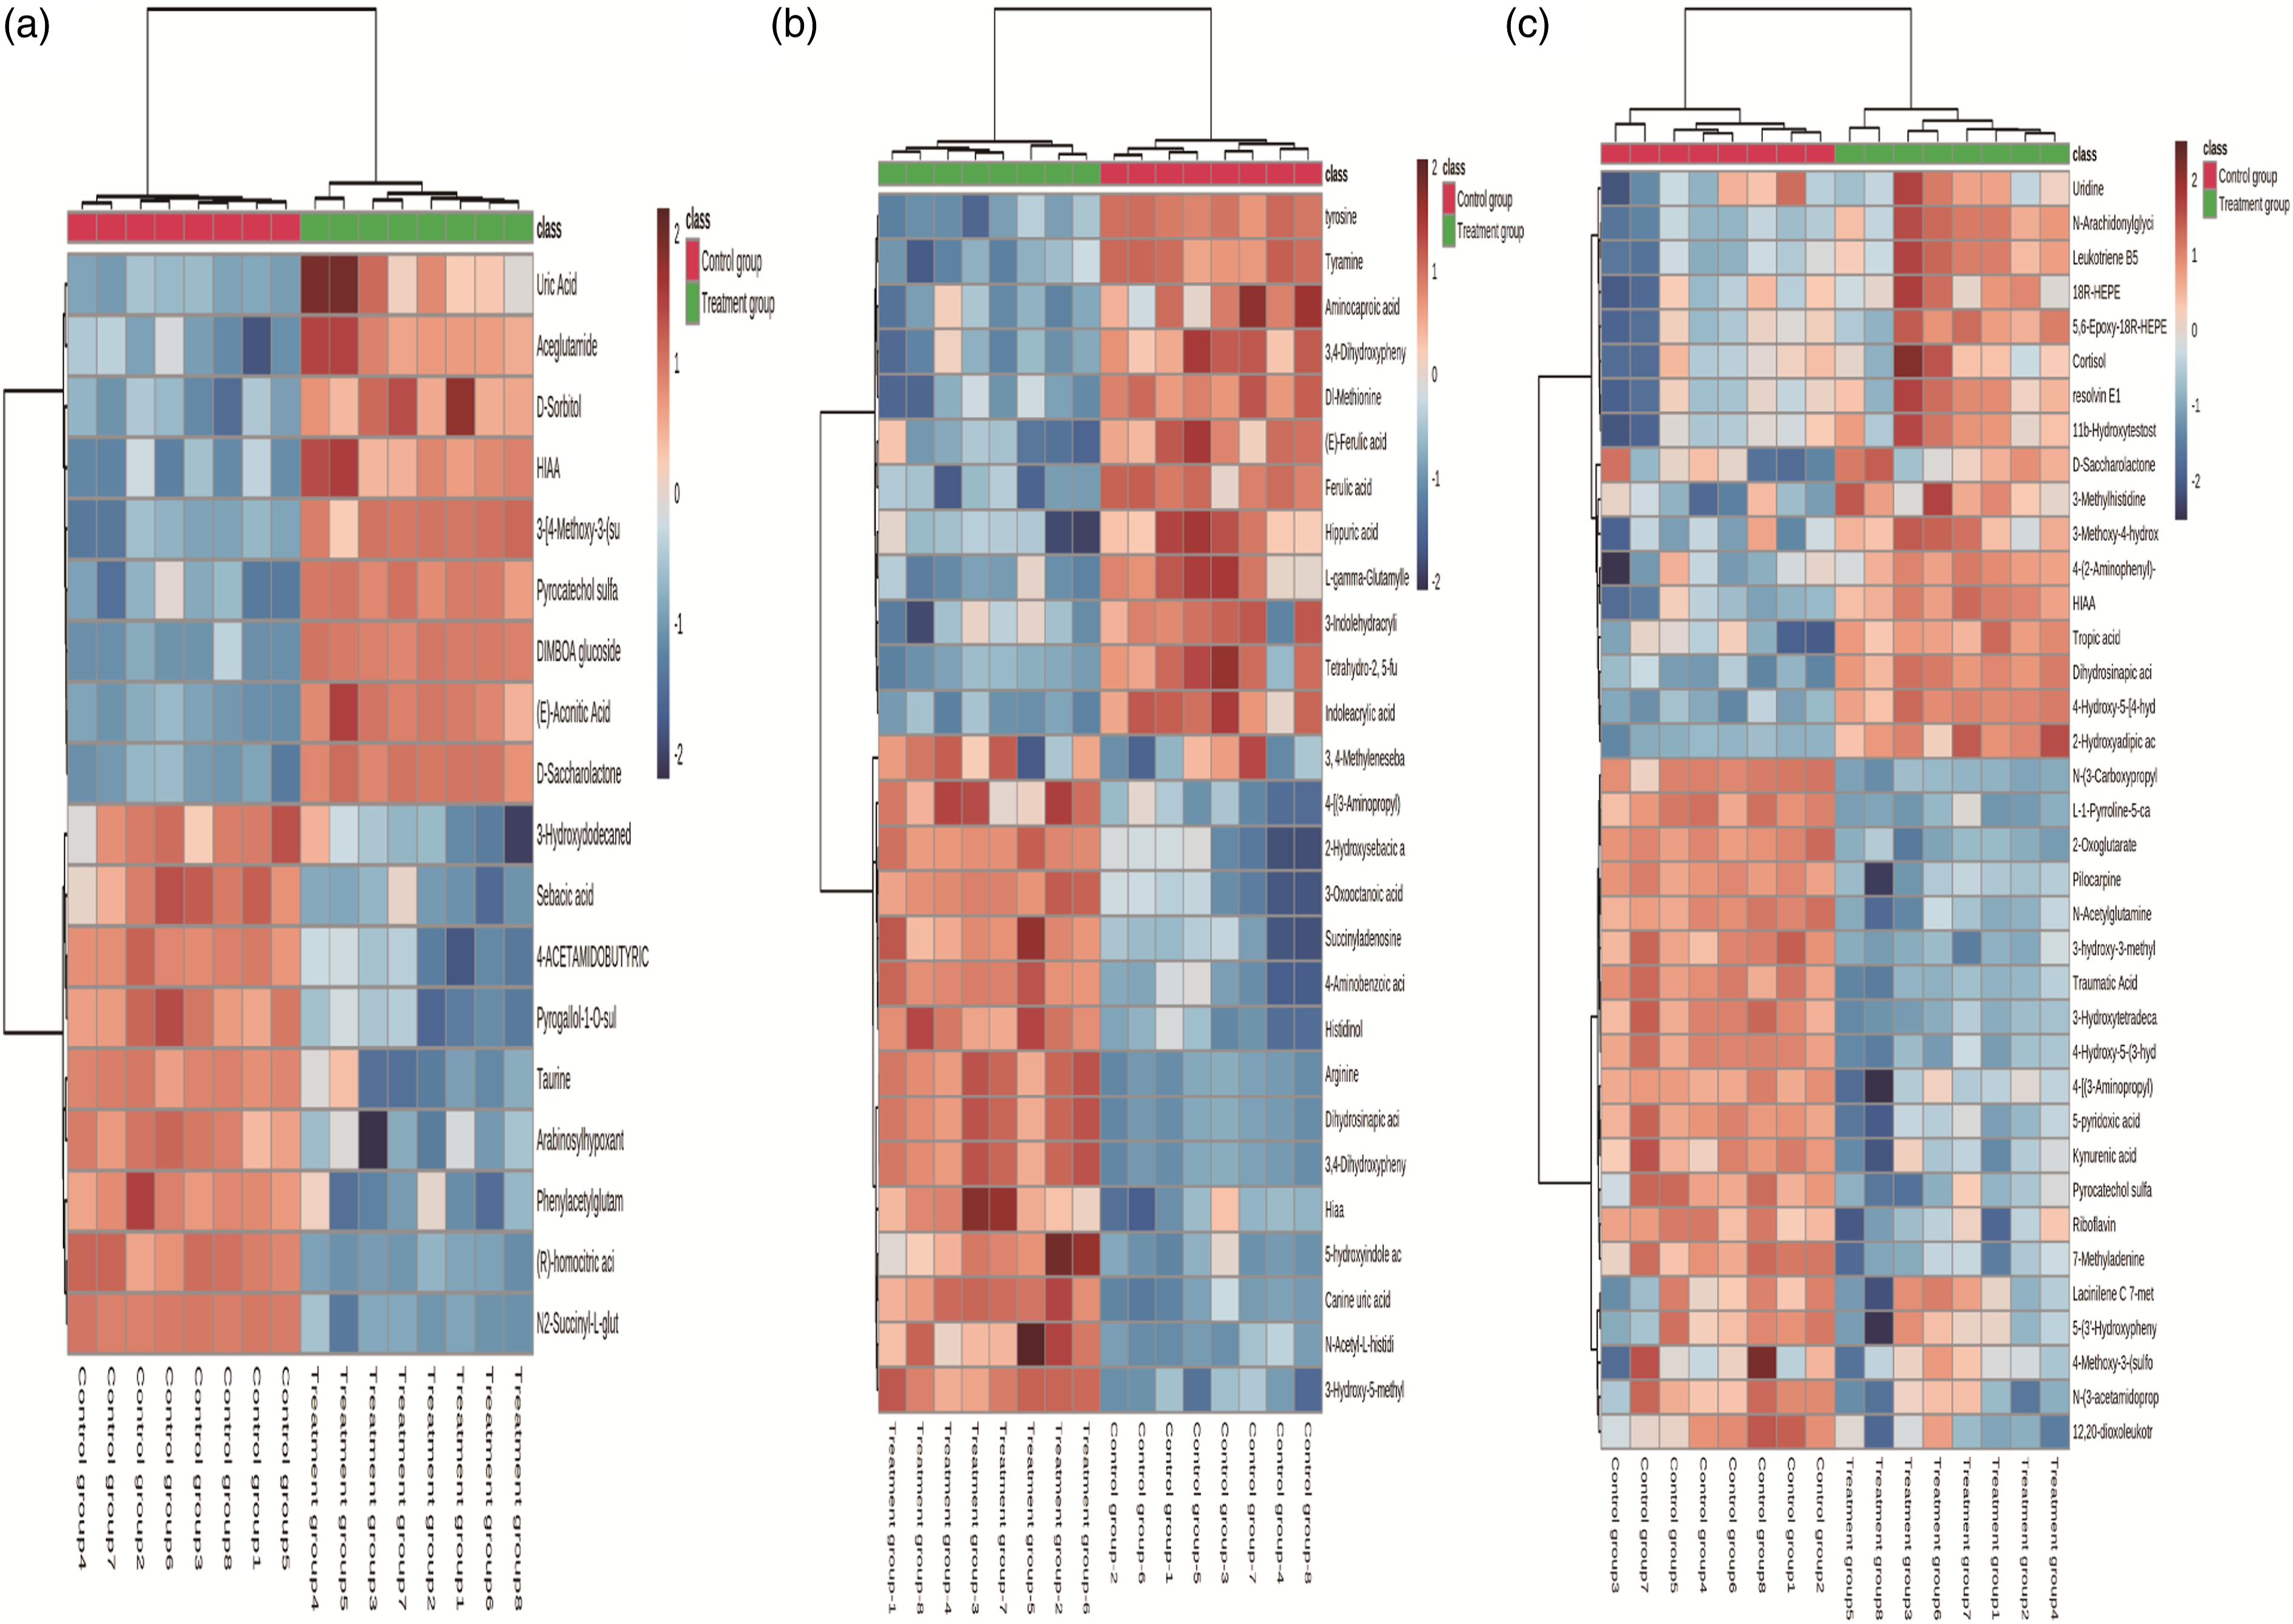
Metabolic pathway analysis
The related pathways (Figure 6) of metabolites were also listed in Table 4. On D2, it clearly showed that the alterations were mainly involved in taurine and sub taurine metabolism. On D4, it mainly related to tryptophan and tyrosine metabolism. On D7, involving tricarboxylic acid cycle (TCA cycle) and arginine metabolism. Summary of pathway analysis in (A) D2, (B) D4, and (C) D7. Related pathways of metabolites in control and treatment groups.

Discussion
A suitable animal model can better make us understand the pathogenesis of kidney injury induced byvancomycin. This study aimed to estimate the value of metabolomics approach for detection of vancomycin-induced toxic injury and vancomycin dosage corresponded to the maximum dose recommended for adults.
Kidney damage usually accompanied with acid base and electrolyte disorders in the body. KIM-1 is undetectable in normal kidneys but markedly induced in proximal tubules after kidney injury. KIM-1 has proved to be an outstanding indicator of kidney injury in the rat, outperforming blood urea nitrogen and serum creatinine as early predictors of kidney injury.14,15 There was a significant difference in KIM-1 and the pathological section also demonstrating that the kidney was slightly damaged on D2. It showed a difference in BUN between control group and treatment group, while creatinine showed no differences, and the pathological section also showed mild to moderate renal injury in treatment group on D4. On D7, there were significantly elevated values of creatinine and BUN, and pathological sections showed severe kidney injury. These results implied that the effect of vancomycin on kidney injury was gradually increased with administration time.
A comprehensive analysis of the urine obtained from vancomycin-injected rats compared with that of control group contributed to the identification of a large number of perturbed metabolites. A clear time-dependent separation of vancomycin-injected animals from controls was observed with significant changes occurring as early as D2 by multivariate statistical analysis for MS data. Importantly, this was well before significant alterations in serum creatinine or BUN which were detectable. The most marked changes induced by vancomycin, as revealed by MS, occurred on D2 and were characterized by change of urinary concentrations of taurine, traumatic acid, uric acid and so on. Endogenous metabolites identified in this study showed a persistent increase over time, from D2 to D7, reflecting the ongoing toxic effect of the medication on the kidney with prolonged dosing.
To further explore metabolic differences between vancomycin nephrotoxicity rats and control group on D2, D4, and D7, this study visualized the metabolites in a clustering heatmap, which directly reflected the variation of each metabolite (Figure 5(a)–(c)). All identified metabolites showed the relative increase (red) or decrease (blue) tendency compared with the control group. It was capable of distinguishing vancomycin nephrotoxicity group from control group on D2, D4 and D7. For example, uric acid, N-formylanthranilic acid, sulfosalicylic acid, D-saccharolactone, aceglutamide were significantly decreased in nephrotoxicity group, whereas traumatic acid, dodecanedioic acid, dimboa glucoside, taurine increased on D2compared with control group. These metabolites might play key roles in the metabolic changes of the vancomycin nephrotoxicity group. The identified metabolites discriminating between vancomycin nephrotoxicity group and control group suggested that vancomycin nephrotoxicity group occurred perturbations in taurine and hypotaurine metabolism, tryptophan metabolism, tyrosine metabolism, TCA cycle, and arginine metabolism.
Metabolomics analyses of urine indicated significantly altered taurine metabolism before the appearance of kidney injury in the early administration stage. Taurine is an important sulfur-containing β - amino acid in mammalian cells and considered to be an endogenous antioxidant and membrane stabilizer.16,17 It has been shown to have a protective effect on various types of renal injury, including ischemia/reperfusion injury, hyperglycemia, and oxidative stress.18,19 Taurine can also reduce the oxidative damage of renal tubules through mitochondrial junction pathway.20,21 Previous study has also already suggested that taurine might be considered as a potential biomarker of kidney injury. 22 In this study, the content of taurine in urine of the treatment group indicated a significant downward trend on D2. The abnormal changes in taurine may suggest oxidative stress and further lead to metabolic disorders of taurine metabolism.
Tryptophan is an essential aromatic amino acid in the body that cannot be synthesized. Besides, it is either synthesized into protein, or decomposed into energy and metabolic intermediates. Therefore, its pathway is affected, meaning that the aromatic amino acid pathway is involved, which is consistent with the relationship between kidney disease and the degradation, synthesis, or excretion of aromatic amino acids.23,24 Two metabolites detected in the urine, 5-hydroxyindoleacetic acid and canine uric acid, are involved in tryptophan metabolism. They were all elevated in the urine of the treatment group compared with the control group. The result indicated that the tryptophan metabolism was also affected due to vancomycin treatment. Moreover, relevant studies have shown that indoles are the distinct markers of renal diseases. 25 Canine uric acid is usually considered a uremic toxin. It has been reported that the canine uric acid increases in patients with chronic kidney injury.26,27 In this study, we also found an elevated canine uric acid level.
The metabolomics analysis in this study also showed that tyrosine decreased significantly after four days of vancomycin administration. Tyrosine is a semi-essential aromatic amino acid derived from phenylalanine hydroxylase. 28 Kidney is closely related to the synthesis, decomposition, and excretion of aromatic amino acids and it is one of the main organs in the metabolism of aromatic amino acids, 29 and also an important place for the transformation of tyrosine. 30 In chronic kidney failure, there is impairment in the conversion of phenylalanine to tyrosine, the release of tyrosine from the kidney is reduced and this reduction may be marked with advanced chronic renal failure. 31
The TCA cycle is an important biological metabolic pathway, an important metabolic hub connecting three nutrients of carbohydrates, lipids, and amino acids. It plays a vital role in the body’s aerobic and energy metabolism. The main metabolic enzyme of the TCA cycle exists in mitochondria, which can indirectly reflect mitochondria dysfunction. 32 The abnormal content of α-ketoglutarate, converted from glutamic acid under the catalysis of glutamate dehydrogenase, indicates the dysfunction of the TCA cycle, 33 and 2-Oxoglutarate is also an important intermediate metabolite of TCA. It links the TCA cycle function with amino acid and important substances in biosynthesis. 34 Besides, mitochondria play a critical role in cell apoptosis and differentiation. Here, the down-regulation of urine α-ketoglutarate and 2-Oxoglutarate in the treatment group may indicate mitochondrial peroxidation damage after continuous vancomycin administration.
Arginine is the core substance in the process of urea cycle and the substrate of NO synthesis. It participates in the regulation of immune and vascular tension. In the kidney, NO mainly dilates to the glomerular arterioles and increases glomerular blood flow perfusion, decreasing kidney injury.35,36 This study found that l-1-pyrroline-5-carboxylate, the upstream substance of arginine, down-regulated in the urine of the treatment group, suggesting abnormal arginine metabolism.
At the same time, arginine is conducive to maintaining the intestinal microecological balance and repairing intestinal mucosal damage. 37 Arginine synthesis mainly occurs in small intestinal epithelial cells, which can absorb glutamine and glutamic acid to produce citrulline. Citrulline is extracted and transformed into arginine by renal tubular cells. A previous study showed that the disruption of renal arginine metabolism promotes kidney injury. 38 After continuous administration for 7 days, the changes of TCA cycle, arginine metabolism suggested that vancomycin probably caused severe kidney injury in rats by interfering with amino acid metabolism and energy metabolism. We found that the metabolic changes involved in the aggravation of kidney injury with the increase of vancomycin administration time, which provided a certain basis for further study of vancomycin induced kidney injury.
Conclusion
In this study, a UHPLC-Q-TOF/MS based urinary metabolomics approach combined with multivariate statistical analysis was employed to explore the mechanism of vancomycin induced kidney injury. Eventually, the differential metabolites from urine samples were screened and identified. It mainly related to amino acid metabolism and energy metabolism on D2, D4, and D7.
Footnotes
Declaration of conflicting interests
The author(s) declared the following potential conflicts of interest with respect to the research, authorship, and/or publication of this article: We declare that we have no financial and personal relationships with other people or organizations that can inappropriately influence our work, there is no professional or other personal interest of any nature or kind in any product, service and/or company that could be construed as influencing the position presented in, or the review of, the manuscript entitled Urinary metabolomics study of vancomycin-associated nephrotoxicity based on UHPLC‐Q‐TOF‐MS.
Funding
The author(s) disclosed receipt of the following financial support for the research, authorship, and/or publication of this article: This work was supported by Key R and D plan of Hebei Province (No.192,777,127D).
Ethics approval and consent to participate
The experimental procedures were all in accordance with the guideline of the Ethics Committee of the second Hospital of HeBei medical university and has approved by the Ethics Committee of the second Hospital of HeBei medical university. This study complies with the Declaration of Helsinki.
Consent for publication
Written informed consent for publication was obtained from each participant.
Availability of data and materials
The data used and analyzed can be obtained from the corresponding author under a reasonable request.