
Abstract
Beta-carotene (β-carotene, BC) is one of the carotenoids most commonly consumed by humans. BCMO1 is expressed in various human tissues and is considered to be a key enzyme that converts BC into vitamin A. Studies indicated that BC-derived carotenoid signaling molecules affected the physiological functions of fat cells. In order to investigate the role and possible molecular mechanism of BC in mouse adipocytes, we conducted 4-group and 2-group difference analysis based on the data of GSE27271 chip in the Gene Expression Omnibus database. Genes differentially expressed in the inguinal white adipose tissue of mice were screened out and combined with the STRING database to construct protein-protein interaction (PPI) networks. Among them, Alb (albumin), Mug1 (murinoglobulin-1) and Uox (urate oxidase) genes were at relatively key positions and may affect the action of BC. Besides, Ppara (peroxisome proliferator-activated receptor alpha), Acly (ATP-citrate lyase) and Fabp5 (fatty acid-binding protein 5) genes constituted functional partners with many genes in the PPI network, and these genes may be Bcmo1 targeting molecules. Gene Ontology (GO) function and signaling pathways enrichment analysis were performed on the genes with protein interaction relationship in the PPI network. Fatty acid binding, cholesterol metabolic process, and regulation of fatty acid metabolic process were significantly enriched, and PPAR signaling pathway showed the most significant, indicating that BC and Bcmo1 might synergistically affect body metabolic functions such as fat metabolism. In general, BC and Bcmo1 may play a role in fat metabolism in mice, thereby affecting other functions or diseases.
Introduction
Beta-carotene (β-carotene, BC) is a tetraterpeniod compound constituted by C40 structure with 2 β-ionone ring, which is one of the most common dietary carotenoids in human subjects, and the highest concentration of carotenoids in blood/plasma.1,2 BC has strong lipophilicity and is insoluble in water. Therefore, it was found in the lipid core of cell membrane. 3 In addition, BC, as a kind of provitamin A, can be decomposed into retinal aldehyde after being absorbed by the body. 4 Studies have pointed out that maintaining normal vision, promoting growth, tissue differentiation, and reproduction are related to the intake of BC through fruits and vegetables and concentration of BC in the blood. 5 What is more, it is known that BC played an anti-cancer role in multifarious cancers by inducing apoptosis, regulating cell growth, suppressing cell proliferation, delaying cell cycle progression, regulating the immune system as well as the antioxidant activity.6–9 Kim D et al. demonstrated that BC played an anti-tumor role in colorectal cancer through epigenetic regulation mechanisms such as miRNA expression, histone acetylation and DNA methylation. 10
β-carotene 15 ′ ,15′- monoxygenase 1 (BCMO1) is a soluble cytoplasmic enzyme 11 with a molecular weight of 60–65 kDa. 12 BCMO1 is expressed in all kinds of human tissues, 13 but the expression level in small intestinal epithelial cells is relatively high, and has high specific activity.14,15 BCMO1 is currently considered being the key enzyme in the conversion of BC into vitamin A. In humans, 35–88% of the absorbed BC is oxidized and cleaved by BCMO1 to 2 molecules of all-trans retinal, which is then irreversibly oxidized to retinoic acid by retinal aldehyde dehydrogenase or reversibly reduced to retinol by retinal aldehyde reductase. 16 Research on Bcmo1 knockout (KO) mice indicated that a large amount of BC was accumulated in liver, lung and adipose tissues of animals with the BC-rich diet.17,18 In humans, heterozygous mutations of BCMO1 gene resulted in elevated plasma levels of BC and reduced plasma concentrations of retinoid. 19 Furthermore, recent studies have shown that rs6564851 mutation in BCMO1 is significantly correlated with high-density lipoprotein cholesterol level (HDL-C). 20 Therefore, BCMO1 is considered being an important regulator of lipid metabolism in liver and adipocytes. 21
More and more evidences showed that carotenoid signaling molecules derived from BC affected the physiology of adipocytes. 17 Bcmo1 KO mice were very sensitive to obesity induced by a high-fat diet, and showed increased expression of peroxisome proliferator-activated receptor gamma (PPARγ) regulatory genes in the fat bank. 18 Bcmo1 mutation led to a sharp decrease in enzyme activity, hyperlipidemia, and vitamin A deficiency symptoms.22–24 In addition, Bcmo1-deficient mice showed low levels of vitamin A and impaired lipid metabolism. 11 Therefore, Bcmo1 plays a critical role in maintaining both vitamin A and lipid metabolism.
In this study, the genomic microarray data from GSE27271 chip in the GEO database involving the inguinal white adipose tissue (iWAT) data of female mice was used for differential expression analysis to screen for differentially expressed genes that might be regulated by BC and Bcmo1. Bioinformatics analysis was carried out on the target genes of BC and Bcmo1 and the possible regulatory mechanisms involved.
Material and method
Date sources
The chip data used in this study were obtained from Gene Expression Omnibus (GEO) database of the National Center of Biotechnology Information (NCBI), and the GEO series accession number was GSE27271. The chip data were collected from each mouse’s inguinal white adipose tissue (iWAT) to extract RNA from the mouse genome microarray data. The continuous subcutaneous fat depot including the dorsolimbar and inguinal area was considered iWAT. There are a total of 47 samples in GSE27271 chip, while only experimental data related to female mice were selected for analysis in this study. Total 24 mice were divided into four groups: wild-type females under control diet (6 samples), wild-type females under BC diet (6 samples), BCMO1 knockout females under control diet (6 samples) and BCMO1 knockout females under BC diet (6 samples). Twelve female B6129SF1 (BCMO1+/+, wild-type) and 12 female B6; 129S-Bcmo1tm1dnp (BCMO1−/−, BCMO1 knockout) mice were used for dietary intervention. Five-week-old female wild-type and BCMO1 knockout mice had free access to feed and water. The basic feed was pelleted feed with a fat content of 10% and 1500 IU vitamin A/Kg. The control diet (control) was supplemented with water-soluble beadlets, containing DL-α-tocopherol and ascorbyl palmitate as stabilizers, and carriers such as gelatin, corn oil, sucrose, and starch. The BC diet (BC) was supplemented with exactly the same water-soluble beadlets containing BC to produce a 150 mg BC/Kg diet. After 14 weeks of dietary intervention, the mice were sacrificed after isoflurane and ketamine anesthesia. The iWAT library was excised, and the total RNA of iWAT library was extracted, and then the microarray hybridization program was performed to obtained a gene expression array.
Microarray data analysis
The four groups of samples were analyzed by ANOVA variance analysis of R studio, and normalized by Benjaminiand Hochberg (BH). Then the differentially expressed genes (DEGs) were screened with adjusted p value < 0.05 as the standard. The DEGs between wild-type females under control diet group and wild-type females under BC diet group, or wild-type females under BC diet group and BCMO1 knockout females under BC diet group were screened by Limma package of R studio with p < 0.05 and │log2 Fold change│>1.3 as the standards.
Protein-protein interaction network
The DEGs between wild-type females under control diet group and wild-type females under BC diet group, or wild-type females under BC diet group and BCMO1 knockout females under BC diet group were used to construct protein–protein interaction networks (PPI) via STRING database (https://string-db.org/). Then the genes that did not interact were removed.
Gene Ontology (GO) functional enrichment analysis
Cytoscape 3.5.1 software and its plug-in CluGO were employed to annotate the GO functions of genes with protein interaction in PPI network. The enrichment of GO annotation function mainly includes three aspects: biological process (BP), molecular function (MF), and cell components (CC). The GO functional enrichment with p < 0.05 difference was screened out.
Kyoto Encyclopedia of Genes and Genomes (KEGG) signaling pathway enrichment analysis
167 DEGs between wild-type females under BC diet group and BCMO1 knockout females under BC diet group were suffered KEGG signaling pathway enrichment by Clusterprofiler and enrichplot in R studio. P adjust value was corrected by BH. Ekegg function was used to visualize the enrichment results of KEGG signaling pathway. The enrichment pathway was displayed in the form of Barplot, in which the horizontal axis was the number of differential genes of the pathway, and the vertical axis was the description information of the enriched pathway. Gsekegg function was also employed to visualize the enrichment results of KEGG signaling pathway, and the results were displayed in the form of Dotplot, where the horizontal axis was GeneRatio, representing the ratio of differential genes number under the pathway to the total number of differential genes, and the vertical axis was the description information of the enriched pathway. In addition, gsekegg function was used to analyze the relationship between differential genes and pathways, and the results were shown in cntplot.
Statistical analysis
ANOVA variance analysis of R studio was used for the difference analysis of the four groups. Bartlett test was employed to test the homogeneity of variance, and then the two-way ANOVA analysis was used to calculate the significance of the difference in gene expression. The difference analysis between two groups was implemented using the Limma package, and the topTable function was used for the difference analysis of gene expression. When the p value was less than 0.05, the fold change was considered to be statistically different.
Results
The differentially expressed genes of GSE27271 chip were screened by Limma package
Four groups (total 24 samples) were chosen from GSE27271 chip to screen differentially expressed genes (DEGs) by ANOVA analysis-4 group variance test, and the top 100 DEGs were showed in the heat map (Figure 1(a)). The heat map indicated that the edible effect of BC had no obvious effect on gene expression, whereas the gene expression of females in BCMO1 knockout group had an evident change compared with the wild-type group. Furthermore, DEGs between the wild-type females under control diet group and the wild-type females under BC diet group were screened by Limma package with p value < 0.05 and │log2 Fold change│>1.3 as the standard. There were a total 52 DEGs, 19 of which were upregulated, while the other 33 DEGs were downregulated. The heat map only showed top 20 DEGs (Figure 1(b)). The similar method was used to screen the DEGs between wild-type females under BC diet group and BCMO1 knockout females under BC diet group and there were 167 DEGs, of which 78 genes were upregulated and 89 genes were downregulated (Figure 1(c)). Differential expression genes in the chip were assessed. (a) The data of four groups (wild-type females under control diet, wild-type females under BC diet, BCMO1 knockout females under control diet and BCMO1 knockout females under BC diet) from GSE27271 chip were analyzed by using ANOVA analysis (four group variance test) and the results showed in the heat map. (b) The differentially expressed genes (DEGs) in the wild-type females under BC diet group compared to that in the wild-type females under control diet group were analyzed by Limma package. There were the top 20 DEGs in the heat map. (c) The differentially expressed genes (DEGs) in the BCMO1 knockout females under BC diet group compared to that in the wild-type females under BC diet group were analyzed by Limma package. There were the top 20 DEGs in the heat map. Wt_control: wild-type females under control diet; wt_BC: wild-type females under BC diet; KD_control: BCMO1 knockout females under control diet; KD_BC: BCMO1 knockout females under BC diet.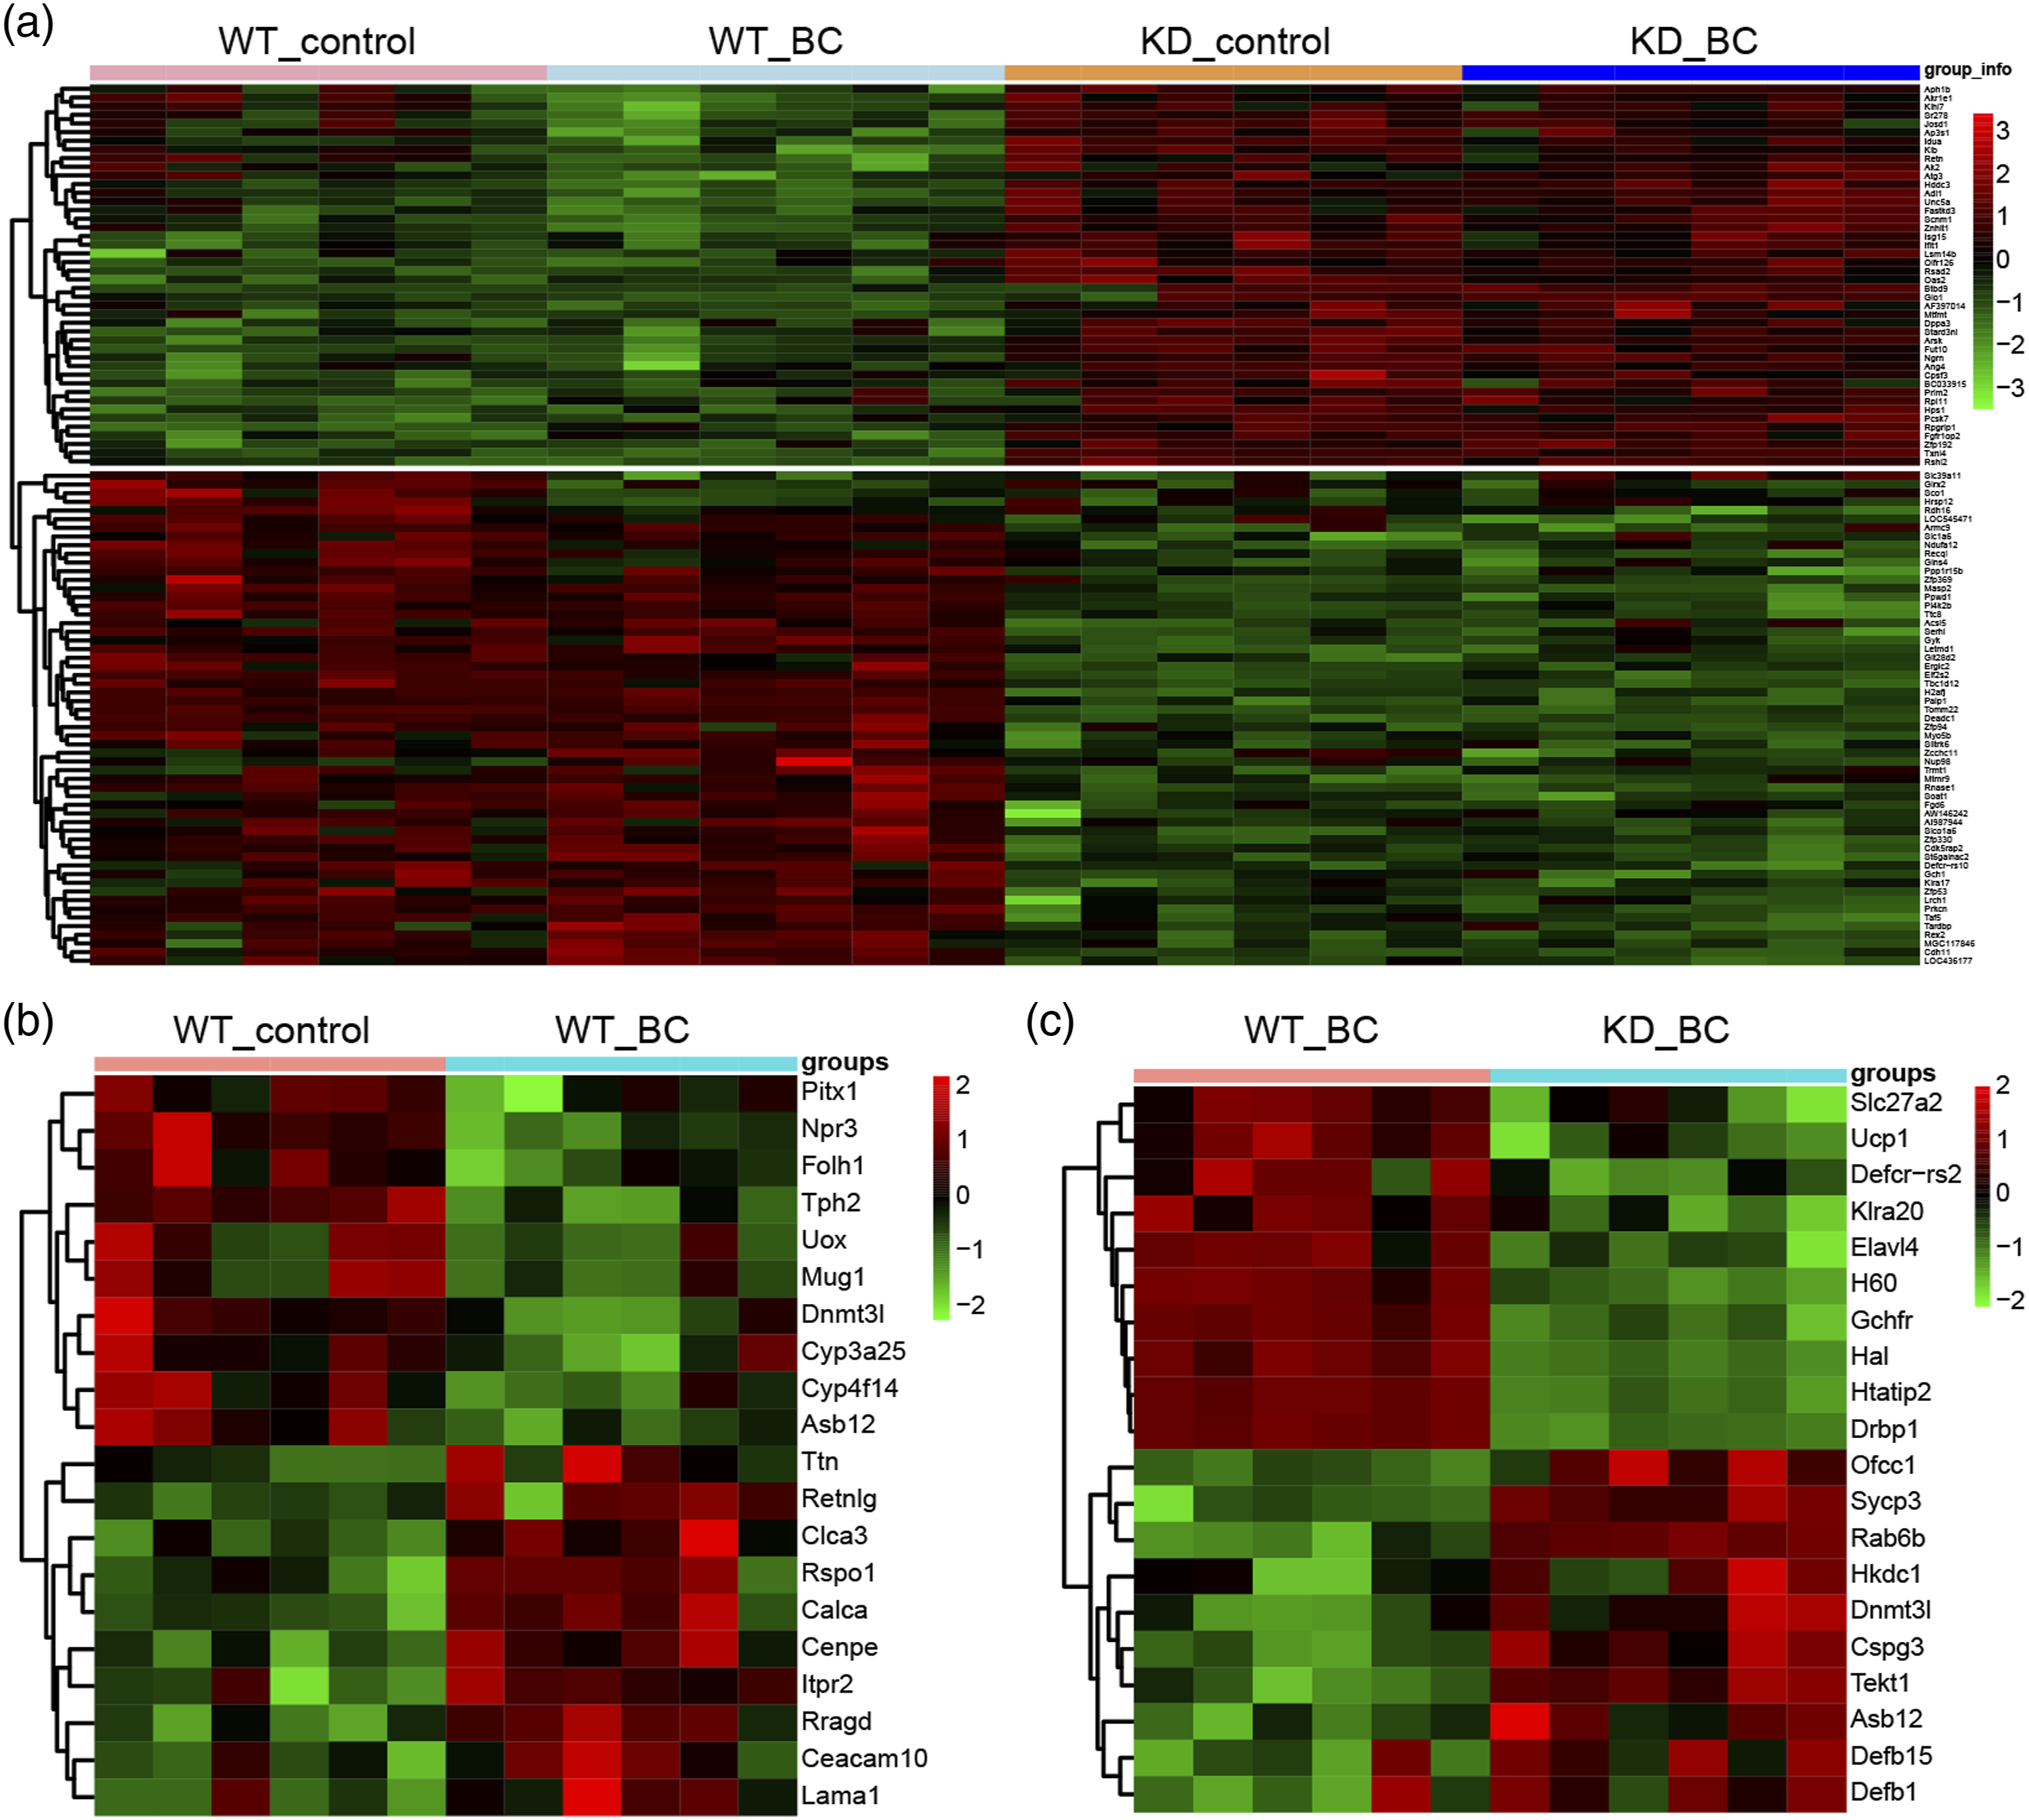
The protein–protein interaction network was constructed using DEGs
The protein–protein interaction (PPI) network was constructed using DEGs through STRING database. The PPI network of DEGs in wild-type females under BC diet group was showed in Figure 2(a), which revealed that Alb (albumin), Mug1 (murinoglobulin-1) and Uox (urate oxidase) were in more critical positions, suggesting that these three genes might have an impact on the effects of BC. The PPI network of DEGs in BCMO1 knockout females under BC diet group suggested that Ppara (peroxisome proliferator-activated receptor alpha), Acly (ATP-citrate lyase) and Fabp5 (fatty acid-binding protein 5) were related to multiple genes, which might be the downstream genes of BCMO1 (Figure 2(b)). Protein–protein interaction networks were constructed by STRING database. (a) The DEGs between wild-type females under control diet group and wild-type females under BC diet group were used to construct protein-protein interaction networks (PPI network) with STRING database. (b) The DEGs between BCMO1 knockout females under BC diet group and wild-type females under BC diet group were used to construct protein–protein interaction networks (PPI network) with STRING database.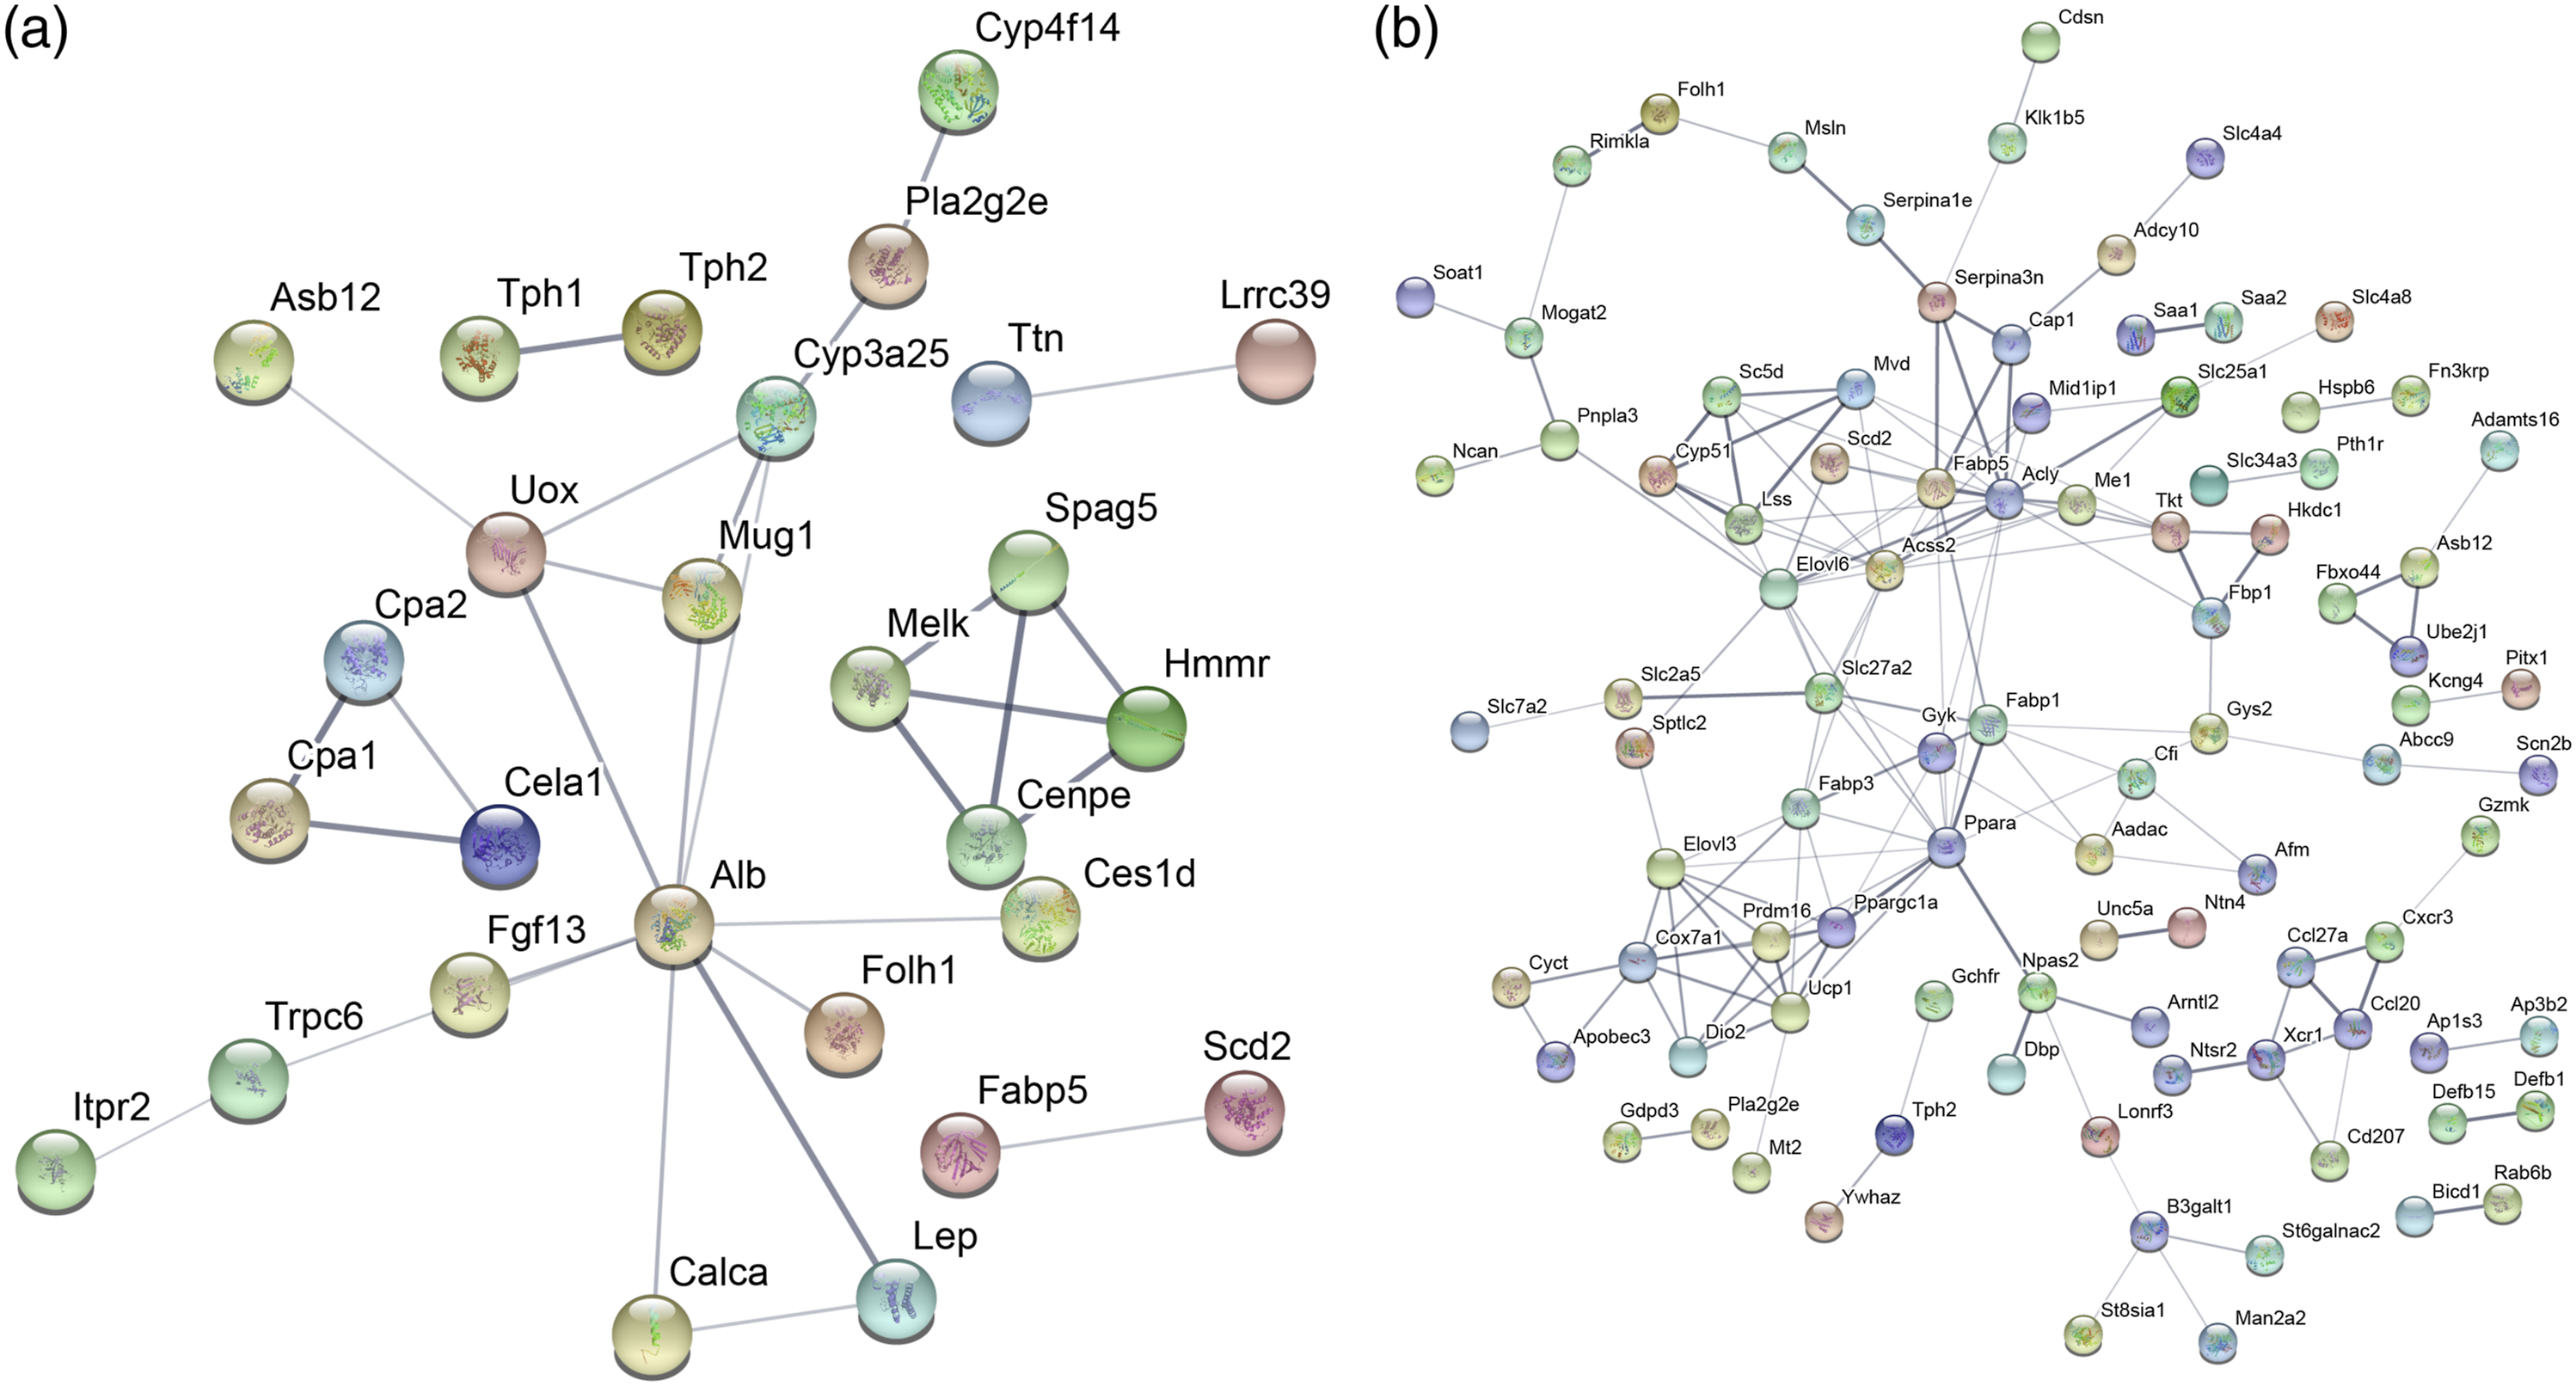
The GO function enrichment analysis was performed on genes in the PPI network
DEGs with interactive relationships in the PPI network were used for GO function enrichment on the base of Cytoscape CluGO. Results indicated that metallo carboxypeptidase activity, fatty acid binding and metallo exopeptidase activity were enriched, suggesting that these GO functions might be influenced by BC (Figure 3(a)). Besides, the GO function enrichment analysis of DEGs from PPI network of BCMO1 knockout group showed that monocarboxylic acid biosynthetic process, purine ribonucleotide biosynthetic process, ribose phosphate biosynthetic process and cholesterol metabolic process were significantly enriched, suggesting that BCMO1 might play a role in the body through these GO functions (Figure 3(b)). Combining and comparing the above two groups of the GO function enrichment, glycerolipid catabolic process, O-acyltransferase activity and regulation of fatty acid metabolic process were obviously enriched (Figure 3(c)). GO function enrichment analysis was performed on the base of Cytoscape CluGO. (a) The DEGs between wild-type females under control diet group and wild-type females under BC diet group with protein interaction in PPI network were further used for GO function enrichment analysis. (b) The DEGs between BCMO1 knockout females under control diet group and wild-type females under BC diet group with protein interaction in PPI network were further used for GO function enrichment analysis. (c) The GO function enrichment analysis results of the above two groups were compared. The different colors represented different enriched GO functions. Circles represented differentially expressed genes enriched in GO functions.
Pathway enrichment analysis was further conducted
167 DEGs in BCMO1 knockout females under BC diet group were used for pathway enrichment analysis through Clusterprofiler and enrichplot. The Barplot in Figure 4(a) indicated that three pathways were significantly enriched, including PPAR signaling pathway, steroid biosynthesis pathway and bile secretion pathway. Otherwise, the joyplot analyzed by gsekegg algorithm also demonstrated that histidine metabolism and PPAR signaling pathway were inhibited in BCMO1 knockout group, while metabolic pathways, carbohydrate digestion and absorption pathway were significantly activated (Figure 4(b)). Furthermore, Cntplot showed the relationships between DEGs and pathways (Figure 4(c)). Most of DEGs in metabolic pathways, carbohydrate digestion and absorption pathway were upregulated, which was consistent with the activated state of these pathways. The pathway enrichment analysis was executed by Clusterprofiler and enrichplot. (a) The 167 DEGs between BCMO1 knockout females under control diet group and wild-type females under BC diet group were used for enrichment analysis and the enrichment of pathways was showed by Barplot. (b) The joyplot also showed enrichment of pathways results. (c) Cntplot presented the relationship between DEGs and pathways.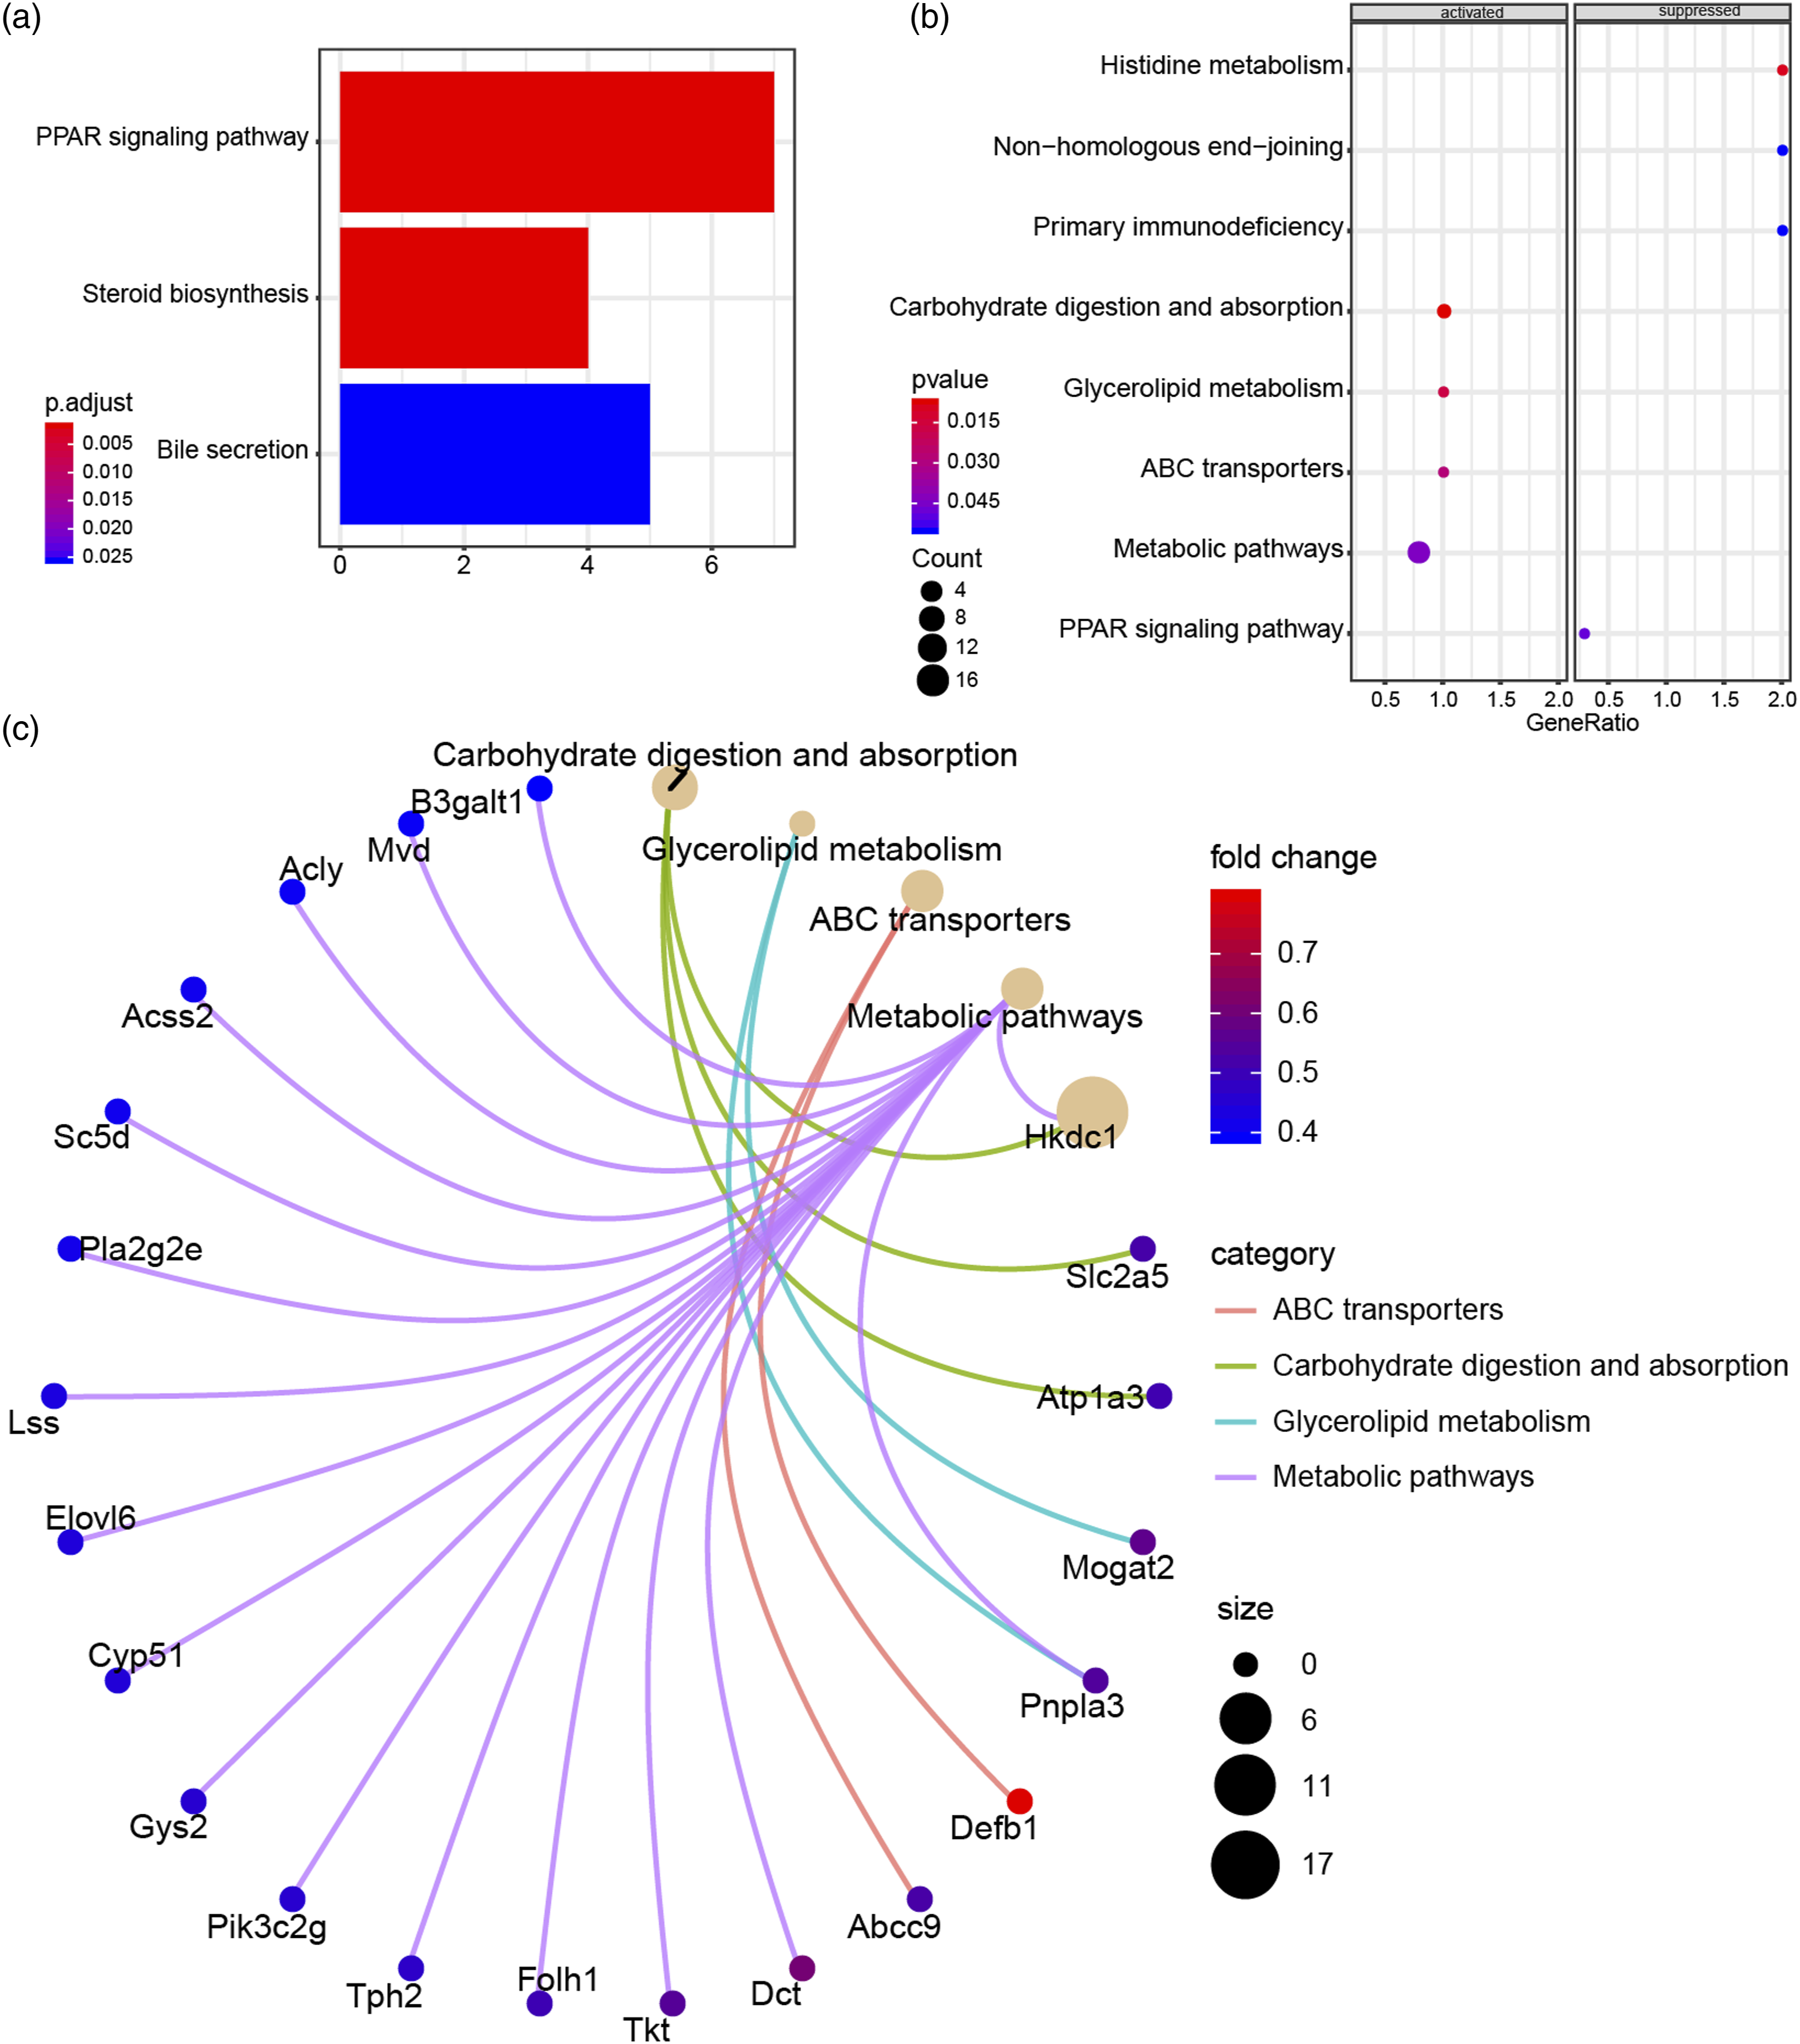
Discussion
In this study, we used the chip GSE27271 data in GEO database to screen the differentially expressed genes (DEGs). In the results of the differential analysis of four groups (wild-type females under control diet or BC diet, Bcmo1 KO females under control diet or BC diet), the effect of BC and control diet in wild-type mice was not obvious in the heat map. However, compared with wild-type mice, after Bcmo1 gene KO, the gene expression in mice had more obvious changes. In the subsequent two-group differential analysis, a total of 52 DEGs were screened for difference in BC diet among wild-type mice out in the two groups with BC diet difference, and 167 DEGs in Bcmo1 KO mice with BC diet were screened. Provitamin A activity was the main function of BC. Bcmo1 cleaved the oxidation center of BC to produce two molecules of all-trans retinal, which was the direct precursor of retinoic acid, the activated form of vitamin A (VitA) or retinol. 25 These results indicated that BCMO1 participated in the metabolism of BC in the human body, and vitamin A status can affect the absorption of BC, and it was also one of the most important factors affecting BCMO1 activity. 16 BC may be more important in our diet than vitamin A, because people with low levels of BC in tissues were usually prone to a variety of different types of cancer. 26
The obtained DEGs combined with STRING database were used to construct PPI network. Most of DEGs had an interaction relationship with each other in the PPI network constructed by DEGs in wild-type mice with BC diet, among which Alb, Mug1 and Uox were in relatively key positions. It has been reported that compared with untreated hepatocellular carcinoma (HCC) rats, BC treatment significantly increased peripheral blood white blood cells (WBC), total white blood cells (TP), Alb, and A/G, suggesting that BC might improve liver function, and alleviate liver tissue damage in hepatocellular carcinoma rats. 27 Mug1 was a single chain proteinase inhibitor, one of mouse specific proteins, which had no corresponding protein in the human body, but had almost the same function as human alpha-2 macroglobulin (A2M). Therefore, Mug1 protein in mouse represented the role of A2M in human plasma. 28 However, no relevant research has performed to reveal the role of Alb, Mug1, Uox genes in BC diet difference.
In the PPI network composed of DEGs in mice after Bcmo1 KO, Ppara, Acly, and Fabp5 constituted functional partners with many genes, which might be the interaction molecules of Bcmo1. Pparα (Peroxisome proliferator-activated receptor alpha) was a ligand-activated transcription factor that acted as a central regulator of lipid metabolism in the liver. 29 Janna A van Diepen et al. identified that PPARα was a regulator of vanin-1 expression and Vanin activity in the liver, and vanin activity played a vital role in preventing the development of steatosis caused by fasting. 30 Acly (ATP-citrate lyase) was a cytoplasmic homotetramer enzyme, whose pharmacological or genetic inhibition significantly inhibited the proliferation and induced apoptosis of cancer cells. 31 In addition, Acly was also considered being a key enzyme for lipid synthesis, and was often overexpressed or activated in various cancers to promote lipid synthesis and tumor progression. 32 Fabp5 (fatty acid binding protein 5) was a member of the intracellular lipid-binding protein family which was believed to be involved in the uptake and transport of long-chain fatty acids. 33 Other studies have shown that Fabp5 was highly upregulated in the carcinogenesis process through epigenetic mechanism, and had a promoting effect on the growth and metastasis of prostate cancer cells. 34 Moreover, Fabp5 was also participated in the transmission of retinoic acid (RA) and PPARβ/δ. Forced overexpression of Fabp5 increased lipolysis and decreased the level of free fatty acids in cells. 35 However, the interaction between Ppara, Acly, Fabp5, and Bcmo1 needs further study.
The results of GO function enrichment analysis of DEGs showed that the activities of metallo carboxypeptidase activity, fatty acid binding and metallo exopeptidase activity were affected, among which fatty acid binding was associated with fat metabolism. In addition, in Bcmo1 KO mice, GO function enrichment analysis indicated that DEGs were enriched in monocarboxylic acid biosynthetic process and purine ribonucleotide biosynthetic process. At the same time, ribose phosphate biosynthetic process, cholesterol metabolic process and other functions appeared to have significant effects under BC diet. Among them, the cholesterol metabolic process was closely related to cholesterol metabolism. In the comparative of GO function analysis between two groups of data: glycerolipid catabolic process, O-acyltransferase activity and regulation of fatty acid metabolic process were significantly enriched, suggesting that BC and Bcmo1 gene may synergistically affect the function of fat metabolism.
Furthermore, in the results of signaling pathway enrichment analysis, PPAR signaling pathway, steroid biosynthesis and Bile secretion pathway were significantly enriched, among which PPAR signaling pathway was the most significant. It has been reported that in Bcmo1 KO mice, the production of retinal was eliminated, the expression of PPAR-activated genes was increased, and PPARa-RXR-mediated response was enhanced, resulting in increased oxidative stress and human DNA damage. 36 These results indicated that PPAR signaling pathway played a crucial role in the effects of BC and Bcmo1 on fat metabolism. Otherwise, according to the joyplot, metabolic pathways, carbohydrate digestion and absorption pathways were significantly activated, while histidine metabolism and PPAR signaling pathway were significantly inhibited in Bcmo1 KO female mice under BC diet. Meanwhile, most of the DEGs in metabolic pathways, carbohydrate digestion and absorption pathway were highly expressed, which was consistent with the results that these pathways were activated. Comprehensive enrichment analysis results of GO function and KEGG signaling pathway revealed that there was a close relationship between Bcom1 and the body’s functional metabolism.
Based on the chip GSE27271 data of the GEO database, the possible downstream regulatory mechanisms of BC and Bcmo1 were preliminarily analyzed through bioinformatics analysis. It was found that BC and Bcmo1 may play a crucial role in fat metabolism of mice, which in turn affected other functions or diseases. However, there are still some limitations in this study. For example, the data source is a bit single, and thus the scope and number of samples should be further expanded.
Footnotes
Author contributions
Yutao Wang, Jinshen Wang and Lei Gao jointly took part in the concept and design of this research.
Yutao Wang, Jinshen Wang, Yuhua Zhao, Xiao Zhang, Lei Gao, Pingxiang Liu and Da Cai conducted the collection, screening and analysis of the raw data.
The manuscript was carried out by Jinshen Wang, Yutao Wang, and Da Cai. Yutao Wang, Lei Gao, and Yuhua Zhao has audited the analysis results of the data, and has made an examination and modification to the manuscript.
All authors read and approved the final manuscript.
Declaration of conflicting interests
The author(s) declared no potential conflicts of interest with respect to the research, authorship, and/or publication of this article.
Funding
The author(s) disclosed receipt of the following financial support for the research, authorship, and/or publication of this article: This work was supported by the research on quality safety and nutrition function evaluation and control technology of characteristic agricultural products (2017JHZ010).