
Abstract
Idarubicin (IDA) is an anthracycline antibiotic, frequently used for the treatment of various human cancers. In vivo rodent model studies have identified a variety of possible adverse outcomes from IDA including heart effects like increased heart weights, myocardial histopathological injury, electrocardiogram abnormalities, and cardiac dysfunction. Despite significant investigations, the molecular mechanisms responsible for the cardiotoxicity of IDA have not been fully clarified. The aim of the current study was to investigate the effects of IDA on the HL-1 cardiac muscle cell. Different concentrations of IDA (10−6, 10−5, 10−4, and 10−3 M) were used at different time (6, 12, 24, and 48 h) periods, and the Cell Counting Kit-8 (CCK-8); 2,7-dichlorodihydrofluorescein diacetate (DCFH-DA) probe method; and enzyme-linked immunosorbent assay (ELISA) were used to detect the oxidative stress level. In addition, we used network analysis to predict IDA-induced cardiotoxicity. The TUNEL assay, qRT-PCR, ELISA assay, and Western blotting detection of related apoptotic factors including caspase family, Bax, and Bcl-2. Overall, we found that IDA was generally more toxic at high concentrations or extended durations of exposure. At the same time, IDA can increase the content of reactive oxygen species (ROS), malondialdehyde (MDA), and decrease the level of superoxide dismutase (SOD), catalase (CAT), and glutathione (GSH) in cells, and increase the content of lactate dehydrogenase (LDH) and nitric oxide synthase (NOS) in the medium. Network analysis showed that the apoptosis signaling pathway was activated; specifically, the caspase family was involved in the signal pathway. The results of the TUNEL assay, qRT-PCR, ELISA, and Western blot found that IDA can activate apoptotic factors. The mechanism may be related to the activation of apoptosis signaling pathway. These results indicate that the cardiotoxic effects of IDA are most likely associated with oxidative stress and ROS formation, which finally ends in apoptotic factors’ activation and induction of cell apoptosis.
Introduction
Anthracyclines, including idarubicin (IDA), epirubicin (EPI), and pirarubicin (THP), are widely used to treat solid tumors and hematological malignancies. 1 However, anthracycline administration is often accompanied by dose-dependent and cumulative cardiotoxicity, ranging from transient cardiac dysfunction to congestive heart failure. 2 Oxidative stress is associated with heart damage caused by anthracyclines. 3 Anthracyclines are easy to accumulate in the mitochondria of cardiomyocytes. 4 Their thiol structure can circulate and produce many reactive oxygen species (ROS) during metabolism, which promotes apoptosis and necrosis of cardiomyocytes. 5 In addition, anthracyclines can also chelate iron ions to trigger the production of oxygen free radicals, causing lipid peroxidation and eventually apoptosis. 5 However, the specific mechanism of cardiotoxicity caused by anthracyclines is unclear. Dexrazoxane (DZR) is the only drug approved by the US Food and Drug Administration for clinical use for protection against anthracycline-induced cardiac injury. 6 Although DZR effectively reduces the incidence of anthracycline-induced chronic heart failure, 7 it also reduces the antitumor efficacy of anthracyclines 8 and hence increases the incidence of secondary-malignant neoplasms. 9 Idarubicin (IDA) is a fourth-generation anthracycline that is less cardiotoxic than the first-generation doxorubicin (DOX). 10 However, patients who receive IDA treatment can still suffer significant cardiac injuries. 11
HL-1 cells (adult murine cardiac cell line) are currently the only cardiomyocyte cell line available that continuously divides and spontaneously contracts while maintaining a differentiated cardiac phenotype. 12 Extensive characterization using microscopic, genetic, immunohistochemical, electrophysiological, and pharmacological techniques has demonstrated how similar HL-1 cells are to primary cardiomyocytes. 12 HL-1 cells have been used to study normal cardiomyocyte function with regard to signaling, electrical, metabolic, and transcriptional regulation; they have also been used to address pathological conditions such as hypoxia, 13 apoptosis, 14 and ischemia-reperfusion. 15 In this study, we evaluated the mechanism of cytotoxicity and apoptosis-inducing effects of IDA on the HL-1 cells.
Materials and methods
Chemicals and materials
IDA was purchased from Pfizer Pharmaceuticals Inc. (WuXi, China). 4′,6′-diamidino-2-phenylindole (DAPI) was purchased from Sigma (D9542, St. Louis, MO, USA). Cell Counting Kit-8 (CCK-8, C0042) assay kit was purchased from Beyotime Institute of Biotechnology (Shanghai, China). The DCFH-DA ROS assay kit (50101ES01) and the TUNEL Apoptosis Detection Kit (Alexa Fluor 640, 40308ES20) were purchased from Shanghai Yeasen Biotech Co., Ltd (Shanghai, China). The superoxide dismutase (SOD) activity detection kit (BC0170), micro malondialdehyde (MDA) assay kit (BC0025), and lactate dehydrogenase (LDH) activity detection kit (BC0185) were purchased from Beijing Solarbio Life Sciences (Beijing, China). The Total Nitric Oxide Synthase (NOS) assay kit (A014-2–1), catalase (CAT) assay kit (A007-1-1), and glutathione (GSH) assay kit (A006-2–1) were purchased from Nanjing Jiancheng Institute of Biological Engineering (Nanjing, China). The Bcl-2 in vitro ELISA (enzyme-linked immunosorbent assay) kit (ab119506) and Bax ELISA Kit (ab233624) were purchased from Abcam (Shanghai, China). The Caspase 3 (Cleaved) Multispecies In-Cell ELISA Kit was purchased from Invitrogen (CA, USA). Anti-Bcl-2, anti–cleaved-caspase-3, anti-GAPDH, and anti-Bax antibodies were purchased from Abcam (MA, USA).
Cell culture
The mouse HL-1 cardiac muscle cell line was purchased from Otwo Biotech Inc. (HTX2129, Shenzhen, China). The cells were maintained in DMEM (SH30243.01 B, Hyclone, USA) supplemented with 10% FBS (SH30080.03, Hyclone, USA) and Pen-Strep (100 IU/mL penicillin and 100 mg/mL streptomycin) at 37°C, 5% CO2, and 95% air in a humidified incubator (MCO-18AIC, Panasonic, Japan).
IDA induces HL-1 cells’ cytotoxicity
IDA is a solid crystalline powder, first dissolved IDA with water for injection to prepare a 1-mM liquid for use. Then, IDA solution was diluted with serum-free DMEM. The HL-1 cells were seeded in 96 well plates at a density of 5 × 10⁴ cells/mL for 24 h and pretreated with different concentrations of IDA (1 × 10⁻⁶, 1 × 10⁻⁵, 1 × 10⁻⁴, and 1 × 10⁻³M) for 6, 12, 24, 36, and 48 h. The cell viabilities were detected using the CCK-8 method as described. According to the results, the optimal model concentration range of IDA (1–10 μM) and time (24 h) were selected. Then IDA (1, 3, 5, 7, and 9 μM) was used to treat the cells for 24 h, and the toxicity of IDA to the cells was detected again. Subsequent experiments used IDA (1, 5, and 9 μM) as the experimental concentration. HL-1 cells were divided into four groups. Control group: in which cells were cultured in serum-free DMEM high-glycemic culture medium; three IDA groups: cells were cultured in serum-free DMEM high-glycemic culture medium containing different concentrations of IDA for 24h, respectively, IDA 1, 5, and 9 μM.
Determination of intracellular cell ROS level
Intracellular ROS levels were determined using the DCFH-DA ROS assay kit. In brief, the cells were plated in six well plates at a density of 1 × 10⁶ cells/well and cultured for 24 h. The cells were subsequently treated with different concentrations of IDA for 24 h. After that, the medium was removed, and 1.5 mL of DCFH-DA (10 μM) was added. The cells were incubated at 37°C for 30 min and subjected to analysis under a BX43 fluorescence microscope (Olympus; Tokyo, Japan) at ×100 magnification.
Detection of MDA, LDH, SOD, NOS, CAT, and GSH levels
Cells were collected and treated according to the above methods. The MDA level was detected by the thiobarbituric acid method, the LDH level was detected by the dinitrophenylhydrazine chromogenic method, the SOD level was detected by the xanthine oxidase method, the NOS was detected by the colorimetric method, CAT was detected by the ammonium molybdate method, and GSH was detected by the dithiodinitrophenyl acid method. We referred to the kit instructions for steps.
Identification of anthracyclines-induced cardiotoxicity-associated genes
As there are few studies on IDA, there are too few genes that can be enriched. Therefore, anthracyclines are selected for enrichment of related genes. Information on anthracycline-induced cardiotoxicity-associated gene targets was identified from the Comparative Toxicogenomics Database (CTD, http://ctdbase.org/), which is a robust, publicly available database that provides comprehensive, user-friendly information on chemical–gene/protein interactions, and chemical–disease and gene–disease relationships.
Network construction and analysis
To investigate the anthracycline-induced cardiotoxicity target genes, a network was constructed using the network visualization software Cytoscape ver. 3.5.1. The software is used to visualize biological pathways and molecular interaction networks as well as for data integration, analysis, and visualization/analysis of complex networks. In the network, nodes represent compounds or target genes, and edges represent compound–target gene interactions. After the network analysis, the database DAVID ver 6.8 was used for annotation, visualization, and integration discovery. Functional annotation of the gene was performed using DAVID 6.8 and the Kyoto Encyclopedia of Genes and Genomes (KEGG).
Terminal deoxynucleotidyl transferase dUTP nick end labeling (TUNEL) assay
HL-1 cells were collected and treated according to the above methods. Cells were fixed in 4% paraformaldehyde and permeabilized in 0.1% Triton X-100. Cell apoptosis was assessed using the TUNEL Apoptosis Detection kit. The cells were counter-stained with DAPI and analyzed under a BX43 fluorescence microscope at ×100 magnification. The apoptosis rate was calculated as the ratio of TUNEL-positive nuclei to total nuclei.
Quantitative real-time PCR
Sequences of primers used in PCR analysis of HL-1 cells.

Notes: F, forward; R, reverse.
ELISA kits assay
HL-1 cells were seeded in six well or ninety-six well plates. Following drug administration, cells were washed twice with PBS and then the detection methods of Bcl-2, Bax, and cleaved-caspase-3 all adopt the sandwich method, and the detection wavelength is 450 nm. We referred to the manufacturer’s instructions for other experimental methods. Total protein concentration in the supernatant was determined using a bicinchoninic acid assay (Beyotime Biotechnology, China).
Western blot analysis
HL-1 cells were seeded in six well plates. After treatment, cells were washed twice with PBS and then lysed with cell lysis buffer at 4°C for 30 min. Samples were centrifuged at 12,000 r/min for 10min, and the supernatant was collected. Total protein concentration in the supernatant was determined using a bicinchoninic acid assay. Protein quantification, SDS-PAGE separation, and blotting on the polyvinylidene fluoride (PVDF) membrane were carried out. Membranes were blocked in 5% milk in PBS with 0.1% Tween20 at room temperature for 1 h and then incubated with primary specific antibodies against cleaved-caspase-3, Bcl-2, Bax (1:500), and glyceraldehyde-3-phosphate dehydrogenase (GAPDH) (1:1000) antibodies overnight at 4°C. Signals were revealed using the appropriate secondary peroxidase conjugated antibodies, and the bands were visualized by chemiluminescence using a ChemiDoc XRS system (Bio-Rad, Hercules, CA, USA). Image J software was used to analyze the quantified Western blot. GAPDH was used as an internal control.
Statistical analysis
All results are presented as mean ± standard deviation (SD). Data analysis was performed with SPSS 19.0 and GraphPad 8.0 software. The student’s t-test or one-way ANOVA was applied to compare data from different groups. Statistical significance was defined as p < 0.05.
Results
IDA induces HL-1 cells’ cytotoxicity
The effect of different concentrations of IDA on the survival of HL-1 cells measured by the CCK-8 assay is shown in Figure 1(a) and (b). As time increases, the cell survival rate gradually decreases. When the IDA concentration is 10−3 M, the 12h cell survival rate drops to 0% (p < 0.01). When the IDA concentration is 10−4 M, the 24 h cell survival rate is 0% (p < 0.01). When the IDA concentration is 10−5 M, the 48h cell survival rate is close to 0% (p < 0.01). Therefore, 24 h was selected as the incubation time. As indicated in Figure 1(b), after adding different concentrations of IDA and culturing for 24 h, compared with the control group, the cell survival rate of the IDA group in the concentration range of 10−3–10−4 M was 0% (p < 0.01), and in the IDA group in the concentration range of 10−5–10−6 M, the cell survival rate is higher. The results of cell viability assay by CCK-8 showed that the optimal modeling time for IDA should be 24 h, and the modeling concentration range was 10−5–10−6 M. Cell viability assessment using the CCK-8 assay and the cytotoxic effect of 1, 3, 5, 7, and 9 μM of IDA in HL-1 cells after a 24h treatment. (a) The CCK-8 assay shows the cell viability of IDA on HL-1 cells at different doses and time; (b) the CCK-8 assay shows after 24 h the cell viability of IDA on HL-1 cells at different doses; (c) the CCK-8 assay shows the cell viability of IDA (1, 3, 5, 7, and 9 μM) on HL-1 cells after 24 h; and (d) The phase-contrast micrograph of HL-1 cells. Cells were grown under confluent culture conditions at the same time. The data are expressed as mean ± SD. *p < 0.05 and **p < 0.01 were compared with the control group.
As shown in Figure 1(c), different concentrations of IDA (1, 3, 5, 7, and 9 μM) significantly reduced the cell survival rate compared with the control group (p < 0.05 or p < 0.01). When the IDA concentration was 5 μM, the cell survival rate was (63.18 ± 4.31) %; therefore, IDA 1, 5, and 9 μM groups were selected as the subsequent experimental concentrations. Microscopic observation showed that IDA-treated cells became smaller in morphology, reduced in number, and even died (Figure 1(d)).
Intracellular levels of ROS
The DCFH-DA probe method was used to detect intracellular ROS levels. The results showed (Figure 2(a)) that compared with the control group, intracellular ROS levels in the IDA 1, 5, and 9 μM groups were up-regulated (p < 0.05 or p < 0.01) and increased with the increase of IDA concentration. Moreover, compared with the IDA 1 μM, treatment with IDA 5 and 9 μM significantly increased ROS levels (p < 0.01). In the IDA 5 μM group, the cell morphology was normal, and the ROS level was significantly increased. In the IDA 9 μM group, the number of cells decreased possibly due to excessive cytotoxicity compared to the IDA 5 μM. Intracellular ROS concentration and the effect of IDA on the oxidative stress index in HL-1 cells. (a) Representative images of DCFH-DA staining (original magnification × 200) and average fluorescence intensity was quantified; (b) representative malondialdehyde (MDA) levels; (c) representative lactate dehydrogenase (LDH) levels; (d) representative superoxide dismutase (SOD) levels; (e) representative nitric oxide synthase (NOS) levels; (f) representative catalase (CAT) levels; (g) representative glutathione (GSH) levels. The data are expressed as mean ± SD. *p < 0.05 and **p < 0.01 were compared with the control group; #p < 0.05 and ##p < 0.01 were compared with the IDA 1 μM group; ▷p < 0.05 and ▷▷p < 0.01 were compared with the IDA 5 μM group.
SOD, CAT, GSH and MDA levels in HL-1 cells, LDH and NOS level in culture medium
As shown in Figure 2(b)–(g), the results showed that compared with the control group, the IDA 1, 5, and 9 μM groups can significantly increase the level of intracellular MDA but significantly reduce the SOD, CAT, and GSH level mean while increasing the levels of LDH and NOS in culture medium (p < 0.05 or p < 0.01). However, compared with the IDA 1 μM, treatment with IDA 5 and 9 μM significantly increases the level of intracellular MDA but significantly reduces the SOD, CAT, and GSH level mean while increasing the level of LDH and NOS in culture medium (p < 0.05 or p < 0.01).
In silico network analysis and prediction of target genes and pathways related to cardiotoxicity
To further elucidate the interaction between anthracyclines and target genes, relationships were investigated using network analysis. The anthracyclines’ resulting network included 8072 potential target genes. As shown in Figure 3(a), the network for anthracyclines included a total of 77 genes (inference score ≥ 20), indicating a higher correlation with cardiotoxicity. Anthracyclines are predicted to regulate the apoptosis signaling pathway by directly targeting the caspase family. (a) GO enrichment analysis of anthracyclines and its target genes and (b) KEGG pathway enrichment analysis of anthracyclines and the top 20 pathways dysregulated following IDA-induced myocardial injury.
To better understand the signaling pathways and functions of these target genes, we performed functional enrichment analysis using DAVID software and the KEGG database. Potential target genes were functionally related to various signal transduction pathways (Figure 3(b)), particularly the apoptosis signaling pathway. Therefore, the expression of the apoptosis signaling pathway was detected in subsequent experiments.
TUNEL assay for apoptotic cells
The TUNEL method was used to detect cell apoptosis. The results showed that the apoptosis rates of IDA 1, 5, and 9 μM groups were (8.90 ± 2.0) %, (48.96 ± 7.01) %, and (85.13 ± 5.12) %, respectively. Compared with the control group, the apoptosis rates of IDA 1, 5, and 9 groups were significantly increased (p < 0.05 or p < 0.01), as shown in Figure 4(a). Moreover, compared with the IDA 1 μM, treatment with IDA 5 and 9 μM significantly increased apoptosis rates (p < 0.01); the apoptosis rate is dose dependent. Cell apoptosis was evaluated using the TUNEL assay and the expression of Bax–Bcl-2, caspase-3, caspase-7, and caspase-9 mRNA. (a) Representative fluorescence images (×100 magnification) and quantified apoptosis rates; (b) representative Bax–Bcl-2 mRNA ratio expression; (c) representative caspase-3 mRNA expression; (d) representative caspase-7 mRNA expression; and (e) representative caspase-9 mRNA expression. The data are expressed as mean ± SD. *p < 0.05 and **p < 0.01 were compared with the control group; #p < 0.05 and ##p < 0.01 were compared with the IDA 1 μM group; ▷p < 0.05 and ▷▷p < 0.01 were compared with the IDA 5 μM group.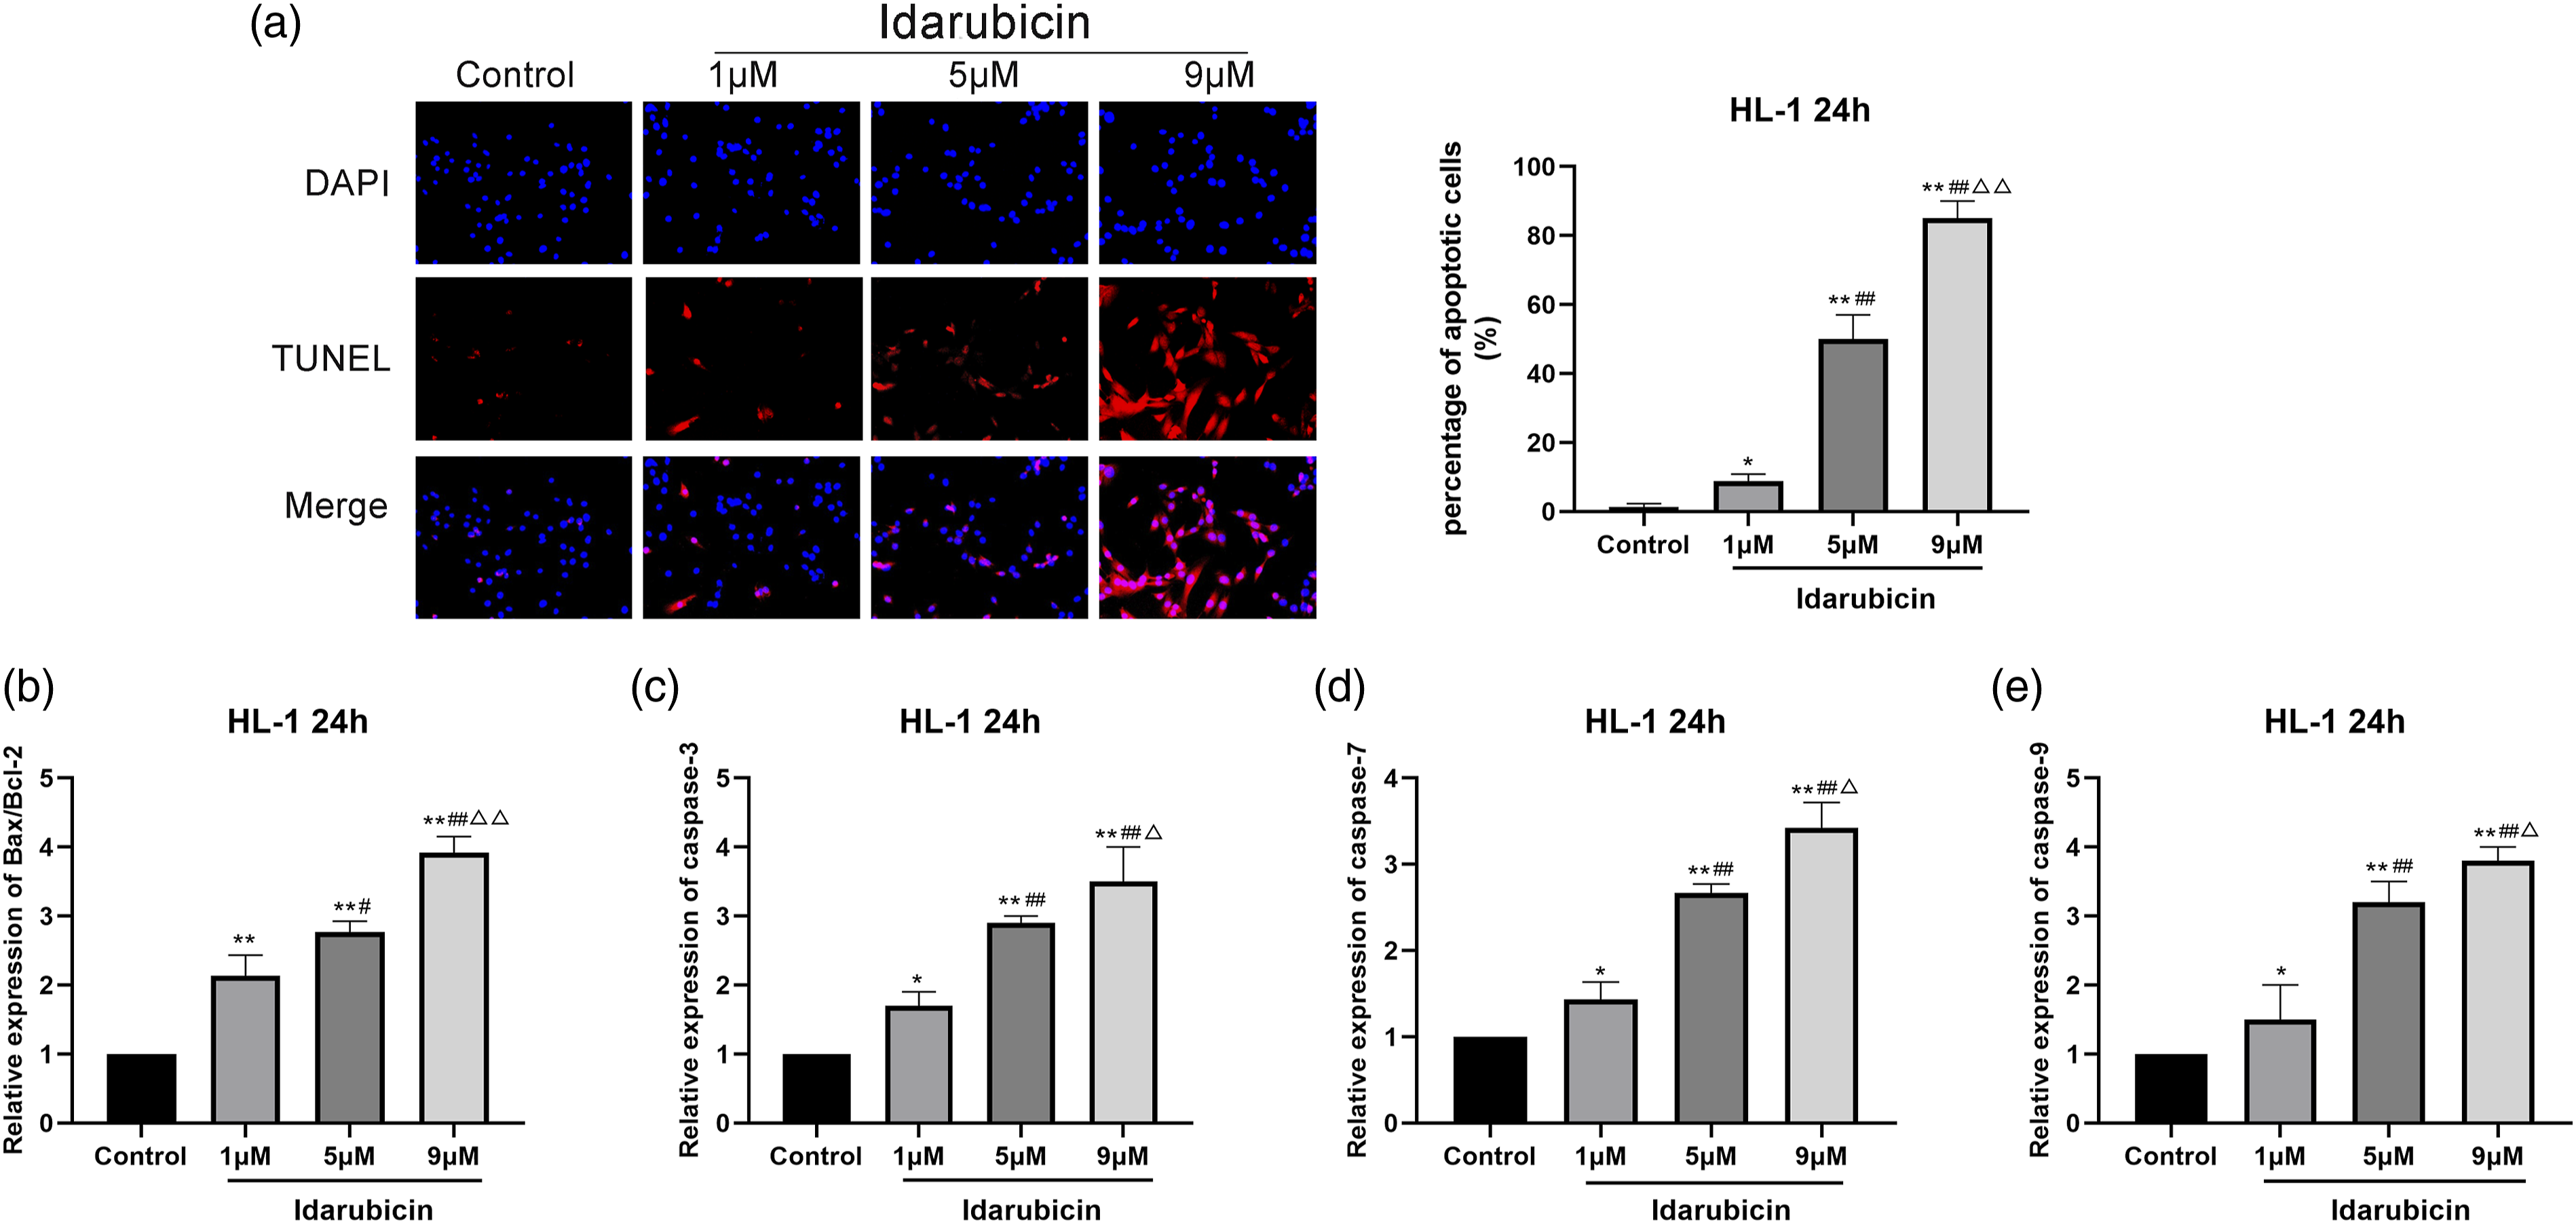
RT-qPCR detection of related apoptotic factors
As shown in Figure 4(b)–(e), the qRT-PCR method was used to detect the levels of apoptosis-related mRNA in the cells. Compared with the control group, the mRNA expression levels of Bax–Bcl-2 ratio, caspase-3, caspase-7, and caspase-9 in the IDA 1, 5, and 9 μM groups were significantly up-regulated (p < 0.05 or p < 0.01). However, compared with the IDA 1 μM, in the treatment with IDA 5 and 9 μM, the mRNA expression levels of Bax–Bcl-2 ratio, caspase-3, caspase-7, and caspase were significantly increased (p < 0.05 or p < 0.01).
Expression of apoptosis-associated proteins
We assessed the protein expression of several crucial regulators of apoptosis factors’ expression. Analysis by ELISA assay (Figure 5(a)–(c)) showed that when IDA was administered alone, the expression levels of cleaved-caspase-3 (p < 0.05 or p < 0.01) and Bax were up-regulated and that of Bcl-2 was down-regulated (p < 0.05). Moreover, compared with the IDA 1 μM, in the treatment with IDA 5 and 9 μM, the expression levels of cleaved-caspase-3 (p < 0.05 or p < 0.01) and Bax were up-regulated and that of Bcl-2 was down regulated (p < 0.05). Effect of IDA on HL-1 cells expression of the cleaved-caspase-3, Bax, and Bcl-2 protein. (a) Representative Bax protein expression; (b) representative bcl-2 protein expression; (c) representative c protein expression; (d) Western-blot analysis of Bax, Bcl-2, and cleaved-caspase-3 protein expression. GAPDH was used as an internal control. *p < 0.05 and **p < 0.01 were compared with the control group; #p < 0.05 and ##p < 0.01 were compared with the IDA 1 μM group; ▷p < 0.05 and ▷▷p < 0.01 were compared with the IDA 5 μM group. 1: control group; 2: Idarubicin 1 μM group; 3: Idarubicin 5 μM group; 4: Idarubicin 9 μM group.
As illustrated in Figure 5(d) and (e), when cells were exposed to IDA, the expression level of cleaved-caspase-3 and Bax–Bcl-2 increased compared to that of the control group (p < 0.05 or p < 0.01). As the dose of IDA increased, the levels of cleaved-caspase-3 and Bax–Bcl-2 increased significantly.
Discussion
Idarubicin (IDA) is an anthracycline frequently used in the chemotherapy for acute leukemia, malignant lymphomas, and several solid tumors. 16 Although IDA has been frequently reported to exhibit low levels of cardiotoxicity at a single dose in the anthracycline family, 17 there is still a risk of cardiomyopathy at cumulative doses. Despite significant investigations, the molecular mechanisms responsible for the cardiac side effects of IDA have not been fully clarified. It has been found that oxidative stress 18 and apoptosis factors 19 may be involved in the development of IDA-induced cardiotoxicity. Therefore, in this study, we aimed to explore the effects of IDA on the oxidative stress and apoptosis factors in HL-1 cardiac muscle cells.
The measurement of the metabolic activity, cell viability, and proliferation were assessed through the CCK-8 assay. Only viable cells with an active metabolism are able to enzymatically convert CCK-8 to water-insoluble formazan crystals by mitochondrial dehydrogenases; thus, the yellow color formation serves as a key marker of only the viable cells. 20 The experiment first found that the cell viability of HL-1 cells gradually decreased with increasing IDA dose and time, indicating that the cardiotoxicity of IDA was time and dose dependent. At the same time, the morphology of HL-1 cells has also changed. The cells in the control group are uniform in size, grow densely in sheets, tightly connected, and regular in shape, and the cells grow adherently. Compared with the control group, the cells in the IDA groups grow dispersedly, a large number of suspended cells appear, and the cell shape becomes round. There are similar findings in cardiotoxicity caused by other anthracyclines. Zhao et al. 21 demonstrated that the numbers of H9C2 cells administrated with 5 μM of DOX for 24 h were significantly reduced as well as the remarkable changed morphology. These results indicate that when IDA accumulates to a certain dose, it can induce cytotoxicity.
Many scientists have made efforts to reduce IDA-induced cardiotoxicity. However, encouraging progress has been hampered by the complex pathological mechanism of the damage caused by IDA. Some evidences have suggested that oxidative stress plays a critical role in the pathogenesis of IDA-induced myocardial damage. 22 In addition, some biological pointers have been verified to prompt oxidative stress. 21 Mitochondria are the major source of intracellular ROS. 23 The excessive production of ROS induces oxidative damage to biological macromolecules, including lipids, proteins, and DNA and disrupts cellular membrane structure and functions. 24 Among them, MDA, an indicator of ROS, is an end-product of lipid hydroperoxide. 21 SOD, CAT, and GSH can scavenge superoxide anions and hydrogen peroxide produced by ROS. 21 Nitric oxide (NO), as a small-molecule substance, plays an important role in human activities. By catalyzation of NOS, NO is a major source of DOX-induced oxidative stress. Nitric oxide levels were found to increase in DOX-mediated cardiotoxicity. 21 We checked the level of LDH in the culture medium, mainly because LDH is abundant in the cytoplasm and cannot pass through the cell membrane under normal conditions. It can be released outside when the cells are damaged or dead. It is well-documented that oxygen and nutrient deficiency to the myocardium may cause cardiac-muscle cell-membrane damages and LDH release from the heart. 25 Thus, the culture medium level of LDH is considered as a biomarker of cell damages. In this article, we found that IDA caused oxidative damage of myocardium as evidenced by the high levels of ROS; high levels of MDA and LDH; and low level of SOD, CAT, NOS, and GSH in vitro. Therefore, oxidative stress may be a key factor that can aggravate IDA-induced myocardial insult.
Through network analysis, we identified that key target genes of IDA were caspase family, Bax, and Bcl-2 which play a key role in cardiotoxicity. These major nodes identified by the KEGG pathway analysis are associated with apoptotic signaling and are known to be associated with cardiotoxicity. Caspases, a unique and closely related family of cysteine proteases, play a central role in the development and regulation of cell death, divided into initiators’ and effectors’ caspases.26,27 Once activated by the signaling pathway, caspases can degrade intracellular proteins and trigger apoptosis. 28 Some researchers have found that when the level of intracellular ROS increases, it can promote the cytochrome c (cyt c) release from mitochondria, 29 thereby activating the expression of apoptotic factors. 30 Once released, cyt c forms a complex with the Apaf-1 and procaspase-9, resulting in caspase-9 activation, which further activates the effector molecules, cleaved-caspases-3, resulting in programmed cell death.31,32 Bcl-2 locates the mitochondrial membrane and plays a key role in maintaining the integrity of the mitochondrial membrane. 33 Bax is usually located in the cytoplasm and migrates to the mitochondrial membrane undergoing destructive stimulus and subsequently increases the permeability of the mitochondrial outer membrane. 34 Bcl-2 inhibits apoptosis, and Bax promotes the apoptosis. 35 Therefore, maintenance of Bcl-2–Bax ratio is also a key factor in the induction of apoptosis.36,37 In our study, the TUNEL assay proved that compared with the control group, the IDA group had a lot of apoptosis, mainly because IDA damaged the DNA chain. Meanwhile, treatment with IDA significantly increased the caspase family mRNA expression and simultaneously reduced the Bcl-2–Bax mRNA ratio than in the control group. Using ELISA and Western-blotting to detect the expression levels of apoptosis-related factors, we found that IDA can increase the levels of Bax and cleaved-caspase-3 proteins in HL-1 cells and reduce the levels of Bcl-2 protein. This result is consistent with the PCR results. Therefore, our study suggests the oxidative stress and apoptosis factors’ properties of IDA may be responsible for the observed cardiotoxicity effects.
This study has further demonstrated that in HL-1 cells, one of the important target cells for IDA, oxidative stress and apoptosis factors were involved in IDA-induced cardiotoxicity, which was one of the most important mechanisms. Although the findings of this study are in cells, further studies in animal and clinical trials are recommended. Results of this study recommend that the combination therapy of IDA with other antioxidant and anti-apoptotic agents may decrease cardiotoxicity effects of this drug.
Footnotes
Declaration of conflicting interests
The author(s) declared no potential conflicts of interest with respect to the research, authorship, and/or publication of this article.
Funding
The author(s) disclosed receipt of the following financial support for the research, authorship, and/or publication of this article: This work was supported by funding from the National Natural Science Foundation of China (No. 81773934).