
Abstract
Purpose:
The mechanism of cytotoxicity of silibinin on two human hepatocellular carcinoma (HCC) cell lines, HepG2 (p53 wild-type) and Hep3B cells (p53 null), is examined in relation with the induction of autophagy and phosphorylation of AMP-activated protein kinase (p-AMPK).
Materials and Methods:
Levels of apoptosis in relation to the levels of autophagy and those of glycolysis-related proteins, glucose transporter 1/4 (Glut1/4) and hexokinase-II (HK2), in HepG2 and Hep3B cells were examined.
Results:
Silibinin-induced apoptosis was incomplete for HCC cell death in that up-regulated autophagy and/or reduced level of glycolysis, which are induced by silibinin treatment, antagonized silibinin-induced apoptosis. Inhibition of autophagy with 3-methyl adenine (3MA) or blocking of AMP-activated protein kinase (AMPK) activation with Compound C (CC) enhanced silibinin-induced apoptosis. The results confirm that AMPK involved in autophagy as well as in glycolysis remaining with silibinin is responsible for attenuation of silibinin-induced apoptosis. Blocking of AMPK or autophagy contributes to the enhancement of silibinin’s cytotoxicity to HepG2 and Hep3B cells.
Conclusion:
This study shows that incomplete apoptosis of HCC by silibinin treatment becomes complete by repression of autophagy and/or glycolysis.
Introduction
Hepatocellular carcinoma (HCC), a liver cancer1,2 prevails world-wide, causing mass annual mortalities. The incidence of HCC has been constantly increasing over the years.2,3 Silibinin is the major active constituent of silymarin, which is a mixture of flavonolignans extracted from milk thistle (Silybum marianum). 4 Silibinin and its crude form silymarin have been clinically used to treat certain liver complications. 5 Previous studies show that silibinin has anticancer, neuroprotective, and anti-diabetic activities.6–8
Energy supply is critical for cell survival and is tightly regulated. 9 Increase in glycolysis in tumor cells is associated with increased risk of tumor progression and mortality. 10 High level of glucose inhibits cell apoptosis and promotes cell cycle progression; therefore, increased level of circulating glucose is likely to favor the development of cancer. 11 Cancer cell growth predominantly relies on glycolysis to generate the energy for cellular processes such as proliferation and differentiation. 12 The repression of glycolysis is one of the targets for cancer remedy. Apoptosis is self-destructive process of cell death, which is important in development. Apoptosis is genetically regulated and characterized by cell shrinkage, DNA fragmentation, chromatin condensation and formation of apoptotic bodies. 13 Now a variety of anti-cancer therapeutics depend on the induction of apoptosis with chemicals, but this way might cause unexpected side effects and recurrence. 14 If chemical drugs induce apoptosis and at the same time inhibit glycolysis to restrict cancer cell’s energy metabolism, the cancer cells stay in the state of “energy deficit,” leading to development of a useful therapy for cancer. 15 A higher glycolytic rate in tumor cells has been shown to promote resistance to chemotherapeutics 16 ; however, its role in the survival of cancer cells is unclear. 17 Autophagy is a conserved degradation/recycling system for long-lived proteins and damaged organelles. 18 Autophagy undergoes a fine tuning during differentiation and organ remodeling in order to meet the dynamic changes in the metabolic needs. 19 Metabolites generated in lysosomes as a result of autophagy are reused as sources of energy for cellular homeostasis.20–23
Schematic presentation of the mechanism of cytotoxicity of silibinin on HepG2 and Hep3B cells. Glut1/4: glucose transporter 1/4; HK2: hexokinase-II; CC: Compound C, an inhibitor of AMPK activation; 3MA: 3-methyl adenine, specific autophagy inhibitor; 2DG: 2-deoxy-D-glucose, glycolysis inhibitor.

AMP-activated protein kinase (AMPK) has been demonstrated as an important metabolic regulator functioning against various metabolic stresses. AMPK is directly regulated by cellular ATP/ADP/AMP levels. 20 As a cellular energy sensor, AMPK is activated, when glucose uptake is reduced and AMP/ATP ratio is increased. 24 Furthermore, AMPK has been reported to stimulate the process of autophagy, a cellular process in which components of the cell are degraded to ensure sufficient metabolites in response to nutrient limitation.25,26 If energy supply is limited, phosphorylated AMPK inhibits the activity of mechanistic target of rapamycin complex 1 (mTORC1) to conserve energy and reduce protein synthesis. 27 In this study, we investigated how autophagy promotes glycolytic energy production for survival in both HepG2 and Hep3B cells.
Materials and methods
Reagents
Silibinin was obtained from Jurong Best Medicine Material (Zhenjiang, Jiangsu, China), and its purity was determined to be approximately 99% by HPLC measurement. The reagent was dissolved in dimethylsulfoxide (DMSO) as a stock solution. The concentration of DMSO was kept below 0.1% in all of the cell cultures so as not to induce any detectable effects on cell growth. 3-(4, 5-Dimethyl-2-thiazolyl)-2, 5-siphenyl-2-H-tetrazolium bromide (MTT), monodansyl cadaverine (MDC) and primary antibody against LC3 were purchased from Sigma Chemical (St. Louis, MO, USA). Primary antibodies against p62, caspase 3, poly-ADP-ribose polymerase (PARP), Bcl2, Glut1, Glut4, HK2 and β-actin as well as horseradish peroxidase-conjugated secondary antibodies were purchased from Santa Cruz Biotechnology (Santa Cruz, CA, USA). The Super Signal® West Pico Chemiluminescent Substrate for horseradish peroxidase (HRP) was obtained from Thermo Scientific (Rockford, IL).
Cell culture
Two human hepatocellular carcinoma cell lines (HepG2 and Hep3B) were obtained from the American Type Culture Collection (ATCC, Manassas, VA). The HepG2 and Hep3B cells were cultured in DMEM (Gibco, NY, USA) containing 10% fetal bovine serum (FBS) (Haoyang Biological Manufacturer, Tianjin, China) and 100 U/mL penicillin/100 mg/mL streptomycin. The cells were incubated at 37°C with 5% CO2 in a humidified atmosphere. Logarithmically growing cells were used in all of the experiments.
Growth inhibition assay
The growth inhibition of the silibinin-treated HepG2 or Hep3B cells was detected using an MTT assay. The MTT assay has been widely used to assess cell viability. The reduction of 3-[4,5-dimethylthiazole-2-yl]-2,5-diphenyltetrazolium bromide (MTT) to MTT-formazan is catalyzed by mitochondrial succinate dehydrogenase. 28 HepG2 or Hep3B cells were seeded in 96-well cell culture plates (Corning, NY, USA) at a density of 4.0 × 10³ cells/well and further cultured for 24 h. After the cells were subjected to the indicated treatments for 24 h, the cells were rinsed twice with ice-cold PBS. They were incubated with 100 µL of 0.5 mg/mL MTT solution at 37°C for 3 h. Then the supernatant was discarded, and the formazan dye product of residual cell layer was solubilized with 150 µL of DMSO. Thereafter, the optical absorbance at 490 nm wavelength (A490) was measured using a microplate reader (Thermo Scientific Multiskan MK3, Shanghai, China).
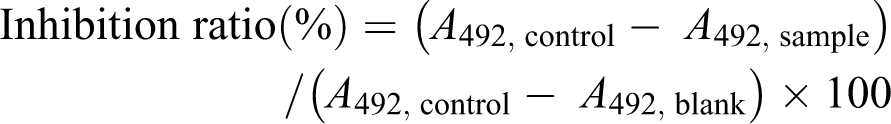
The percentage of cell viability was calculated as follows:
Nuclear damage observed by Hoechst 33258 staining
HepG2 or Hep3B cells were seeded in 24-well plates at a density of 5 × 10⁵ cells/well (1 mL), cultured for 24 h, and then treated with silibinin at the indicated concentration. Nuclear damage was examined by Hoechst 33258 staining as reported previously. 29
Lactate production assay
Cells plated in six-well plates were cultured for 24 h. They were further incubated with various concentrations of silibinin for 24 h. Culture medium was removed from cells and the extracellular lactate concentration was determined using the Lactate Kit (Nanjing Jiancheng Bioengineering, Nanjing, China) according to manufacturer’s protocol. The absorbance at 450 nm wavelength was determined. The cell numbers were used to normalize the relative lactate levels.
Western blot analysis
The cells were harvested, washed twice with PBS, and then lysed in whole cell RIPA lysed buffer (Beyotime, Haimen, Jiangsu, China) supplemented with PMSF (1 mM). After a 1.5 × 10⁴ g centrifugation at 4°C for 15 min, the protein concentration was determined using the Bio-Rad protein assay reagent (Bio-Rad, Hercules, CA, USA). After denaturation with boiling water for 5 min, the lysates, containing the same amount of protein, were separated by 12% SDS-PAGE and transferred onto a Millipore Immobilon®-PTransfer Membrane (Millipore, Billerica, MA). The membranes were soaked in 5% skim milk, and then incubated with primary polyclonal antibodies overnight, followed by incubation with the corresponding HRP-conjugated secondary antibodies. The blots were visualized using the SuperSignal® West Pico Chemiluminescent Substrate.
Statistical analysis
Data from at least three independent experiments are presented as means ± S.E.M. The statistics comparisons were analyzed by a one-way ANOVA using the GraphPad Prism 6.0 software, p < 0.05 was considered statistically significant.
Results
Silibinin induces apoptosis in HepG2 and Hep3B cells
To test the growth inhibitory effect of silibinin on HepG2 and Hep3B cells, the cells were cultured with different concentrations of silibinin for 12, 24 and 36 h. The results from MTT assay indicated that silibinin significantly inhibited the growth of HepG2 and Hep3B cells in a time- and concentration-dependent manner (Figure 1(a)). It was reported that silibinin induces HepG2 apoptosis. 30 Compared with the control group, silibinin treatment caused significant morphological changes, including the appearance of chromatin condensation and nuclear fragmentation (Figure 1(b)). Western blot analysis showed that silibinin increased the cleavage of pro-caspase 3 and poly (ADP-ribose) polymerase (PARP) in a dose-dependent manner. Silibinin significantly increased the expression of apoptosis-associated proteins (Figure 1(c)). For verifying this result, the Annexin V-FITC and propidium iodide (PI) staining were used to analyze the percentage of apoptotic cells in silibinin-treated HepG2 and Hep3B cells. The results show that silibinin treatment increased the apoptotic ratio (Figure 1(d)). In accordance with the previous reports, 31 p53 expression in HepG2 cells is high, but it lacks in Hep3B cells (Figure 1(e)). No significant change is noticed in inhibition of HepG2 cell growth, when the cells were pre-treated with either Nutlin-3μ (Nut-3μ, activator of p53) or pifithrin-α (PFT, a specific inhibitor of p53) (Figure 1(f)). Furthermore, the expression levels of p53 as determined by western blotting (shown in Figure 1(g)), was essentially unchanged in silibinin-treated HepG2 cells, suggesting that silibinin-induced HepG2 cell death is induced through caspase-dependent or p53-independent pathways.

Silibinin induces growth inhibition in HepG2 and Hep3B cells. (a) The cells were cultured for 24 h and then incubated with different concentrations of silibinin for 12, 24 and 36 h. Cell viability was determined by MTT assay. Data are means ± S.E.M of three independent experiments. (b) The nuclear morphologic changes were observed under a fluorescence microscope by staining with Hoechst 33258 (×400 magnification, bar = 20 μm). (c) The cells were treated with silibinin for 24 h, followed by western blot analysis for detection of PARP, pro-caspase 3, caspase 3 and Bcl2 with β-actin as an equal loading control.
Glycolysis inhibition is associated with apoptosis in silibinin-treated HepG2 and Hep3B cells
In HCCs, glucose transportation into the cytoplasm via glucose transporters (Gluts) and glucose phosphorylation by hexokinase (HKs) results in the increase of glucose-6-phosphate (G-6-P) that enters the glycolytic pathway in the cells. 32 Glucose is eventually metabolized to form lactic acid in glycolysis. The resultant lactate is discharged extracellularly (Figure 2(a)). Glut1 and Glut4 (Glut1/4) are glucose transporters located in the cell membrane. Glut1/4 are the most common glucose transporters in human and are aberrantly expressed in a variety of malignancies.33,34 HKs catalyze the first step of glucose metabolism, phosphorylating glucose to G6P. Accumulating evidence indicates that hexokinase-II (HK2) plays an important role in glycolysis. 35 In order to further confirm the inhibitory effect of silibinin on glycolysis, the protein levels of Glut1/4 and HK2 were determined by western blot analysis (Figure 2(b)) together with the level of lactic acid generated (Figure 2(c)). Addition of 2-deoxy-D-glucose (2DG: glycolysis inhibitor) further augmented the growth inhibition compared with the silibinin alone group in HepG2 and Hep3B cells (Figure 2(d)). Western blot analysis shows that 2DG significantly induced cleaved (activated) forms of caspase 3 and PARP, respectively, while it inhibited Bcl2 expression (Figure 2(e)). All the results, taken together, demonstrate that glycolysis is suppressed in the silibinin-induced growth repression in HepG2 and Hep3B cells regardless of p53 activity.

(d)The induction of apoptosis was determined by flow cytometric analysis with Annexin V-FITC and PI-staining. (e) Western blot analysis of expression levels of p53 in HepG2 and Hep3B cells. (f) HepG2
Autophagy antagonized silibinin-induced apoptosis in HepG2 cells
Autophagy can be as a survival mechanism in starving cells. In order to further confirm the autophagy-augmenting effect of silibinin, western blot analysis was performed to detect the conversion of microtubule associated protein light chain 3 (LC3) from LC3I to LC3II (an autophagy marker) (Figure 3(a)). The results indicate that silibinin augments autophagy in HepG2 and Hep3B cells. Western blot analysis shows that inhibition of mechanistic target of rapamycin (mTORC1) by the treatment with rapamycin (Rap) led to a further stimulation of autophagy. MTT assay indicated that specific autophagy inhibitor, 3MA, increased the inhibitory effect of silibinin, while autophagy inducer, Rap, decreased it (Figure 3(b)). The cleavages of pro-caspase 3 and PARP increased after pretreatment with 3MA; meanwhile, the protein expressions of Glut1/4 and HK2 were decreased (Figure 3(c) and (d)). These findings demonstrate that silibinin induced-autophagy resists apoptosis in HepG2 and Hep3B cells. Taken together, autophagy prevents down-regulation of glycolysis, through a negative feedback loop, resulting in attenuation of apoptosis of HepG2 and Hep3B cells.

Glycolysis inhibition is associated with growth inhibition in silibinin-treated HepG2 and Hep3B cells. (a) A schematic diagram of glucose metabolism in cells. (b) The protein levels of Glut1/4 and HK2 were evaluated by western blot. (c) Lactic acid in the culture medium of silibinin-treated HepG2 cells.
Silibinin-induced AMPK activation plays a protective role for cell survival
To investigate whether regulation of AMPK and its phosphorylation (p-AMPK) affects apoptosis, autophagy or glycolysis in HepG2 and Hep3B cells, we further examined the expression levels of AMPK and p-AMPK by western blotting. The protein expression levels of p-AMPK were elevated in silibinin-treated HepG2 and Hep3B cells (Figure 4(a)). To determine whether p-AMPK is required for silibinin-induced autophagy and glycolysis, Compound. C (CC), an inhibitor of AMPK activation, was administered. The MTT assay demonstrated that the treatment with 20 μM CC or 2.5 μM salicylate (Sal), AMPK activator, significantly altered the growth inhibition ratio to opposite directions (Figure 4(b)). We further examined the effect of CC on silibinin-induced apoptosis by detection of cleaved-PARP, -caspase 3 (active) and Bcl2. As expected, CC treatment enhanced both the expression of cleaved-PARP and -caspase 3, accompanying further reductions in the conversion of LC3I to LC3II and in the expression of Glut1/4 and HK2 (Figure 4(c)) that are down-regulated by silibinin treatment. Taken together, the results indicate that AMPK is involved in further repression of silibinin-induced autophagy together with further repression of glycolysis, suggesting that autophagy together with glycolysis remaining with silibinin to attenuate silibinin-induced apoptosis through activation of AMPK.
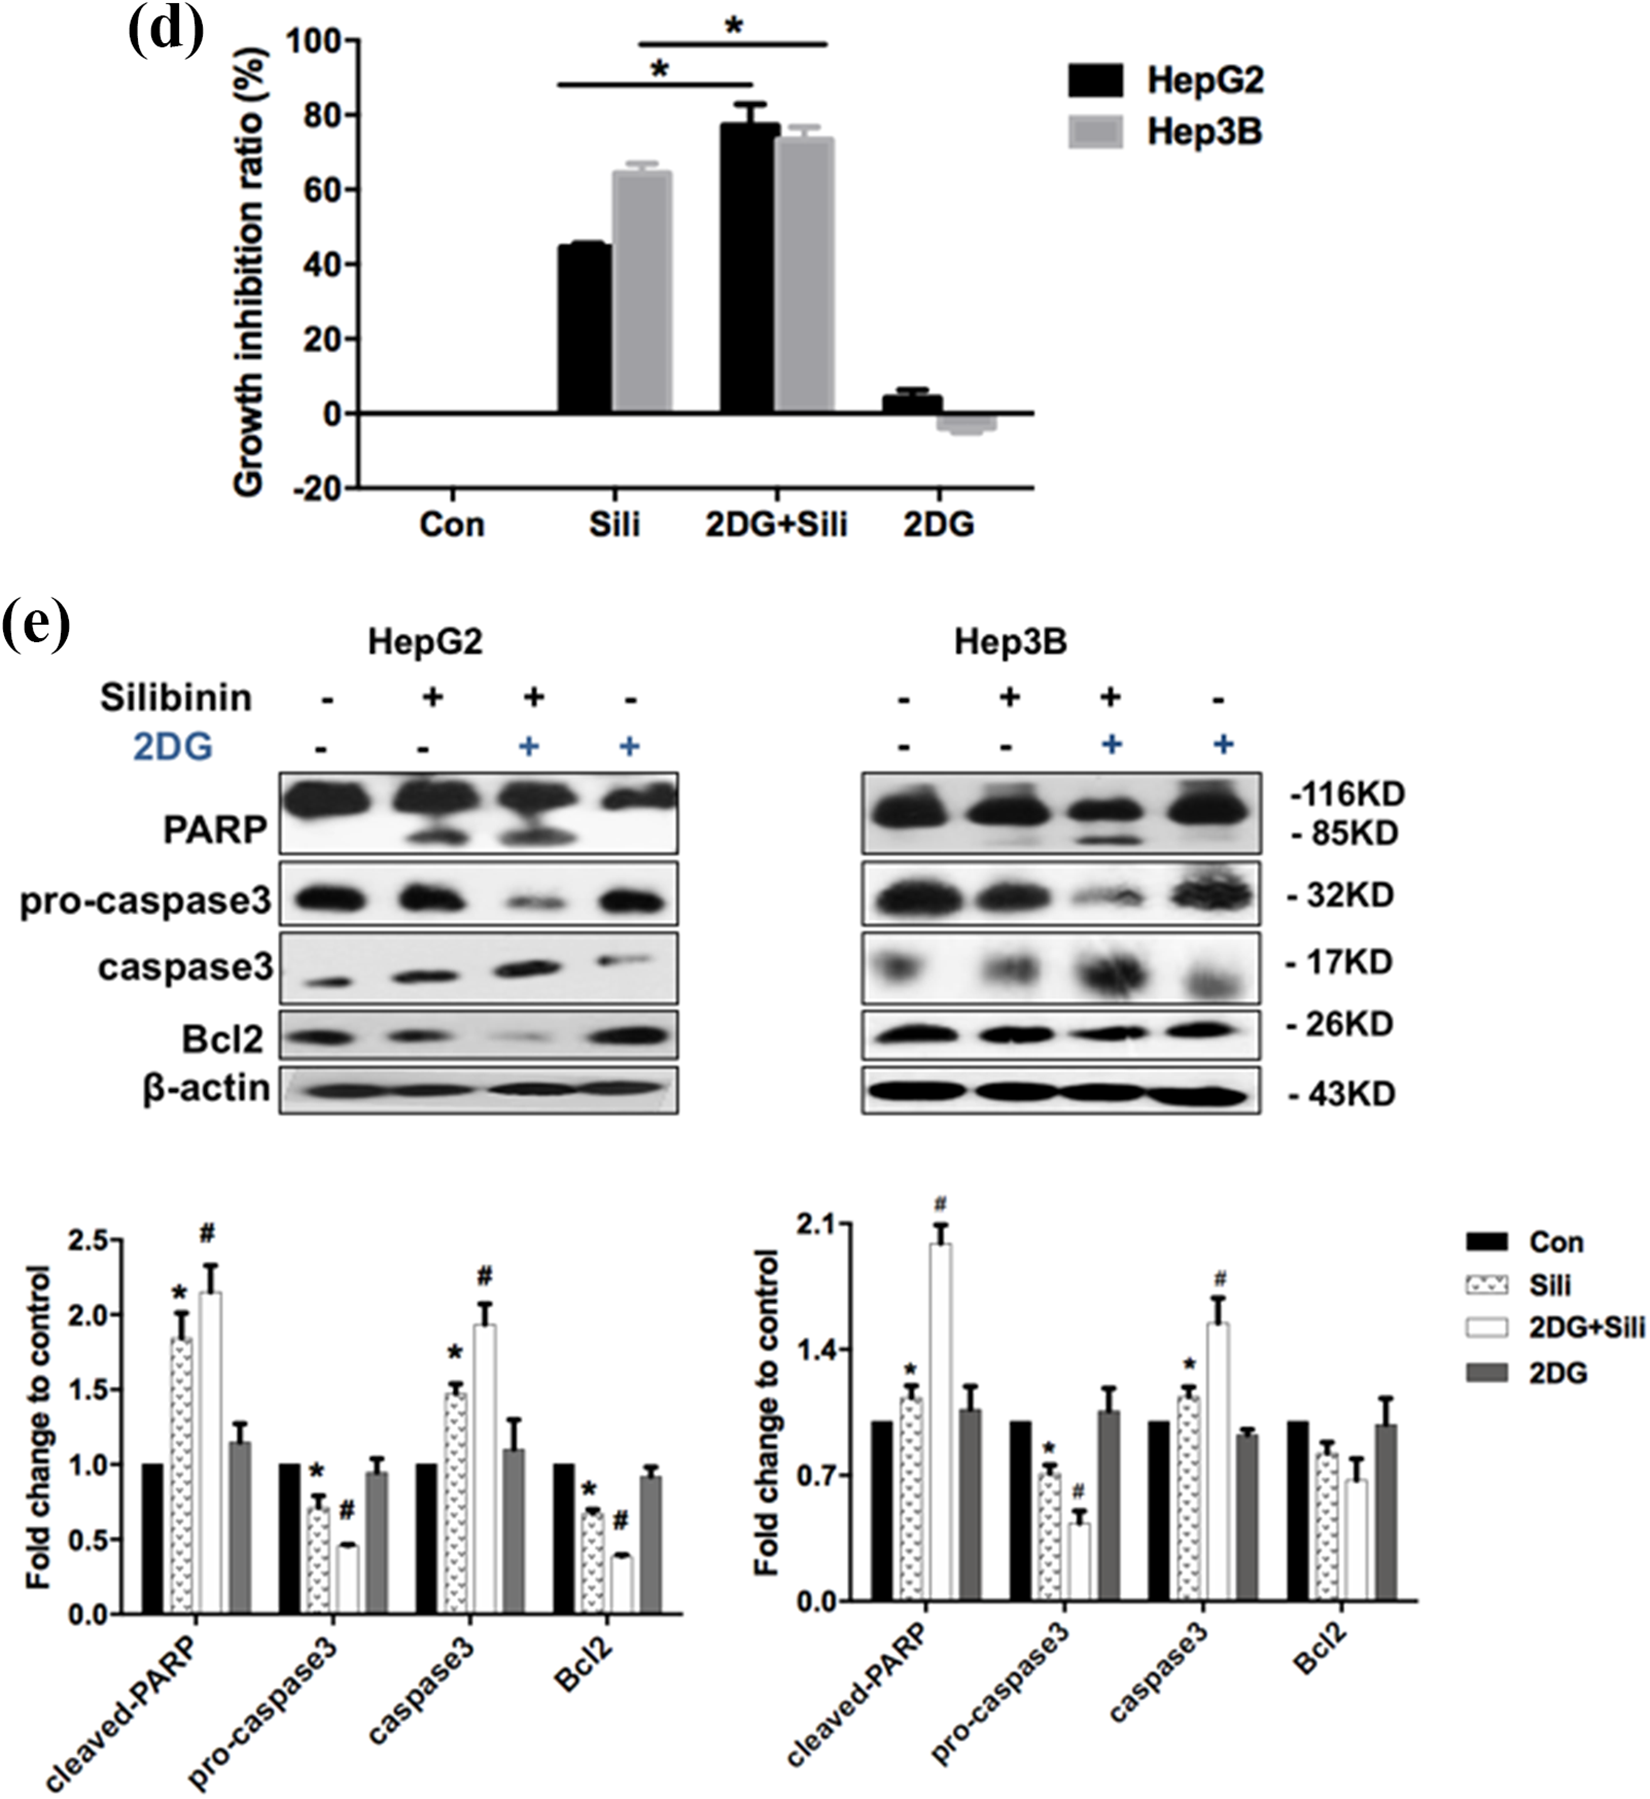
(d) The cells were incubated with silibinin or combined with 2DG for 24 h. *p < 0.05 compared with control group. (e) Followed by western blot analysis of PARP, pro-caspase 3, caspase 3 and Bcl2, n ≥ 3, Data are means ± S.E.M, *p < 0.05, compared with control group, #p < 0.05, compared with silibinin-treated group.
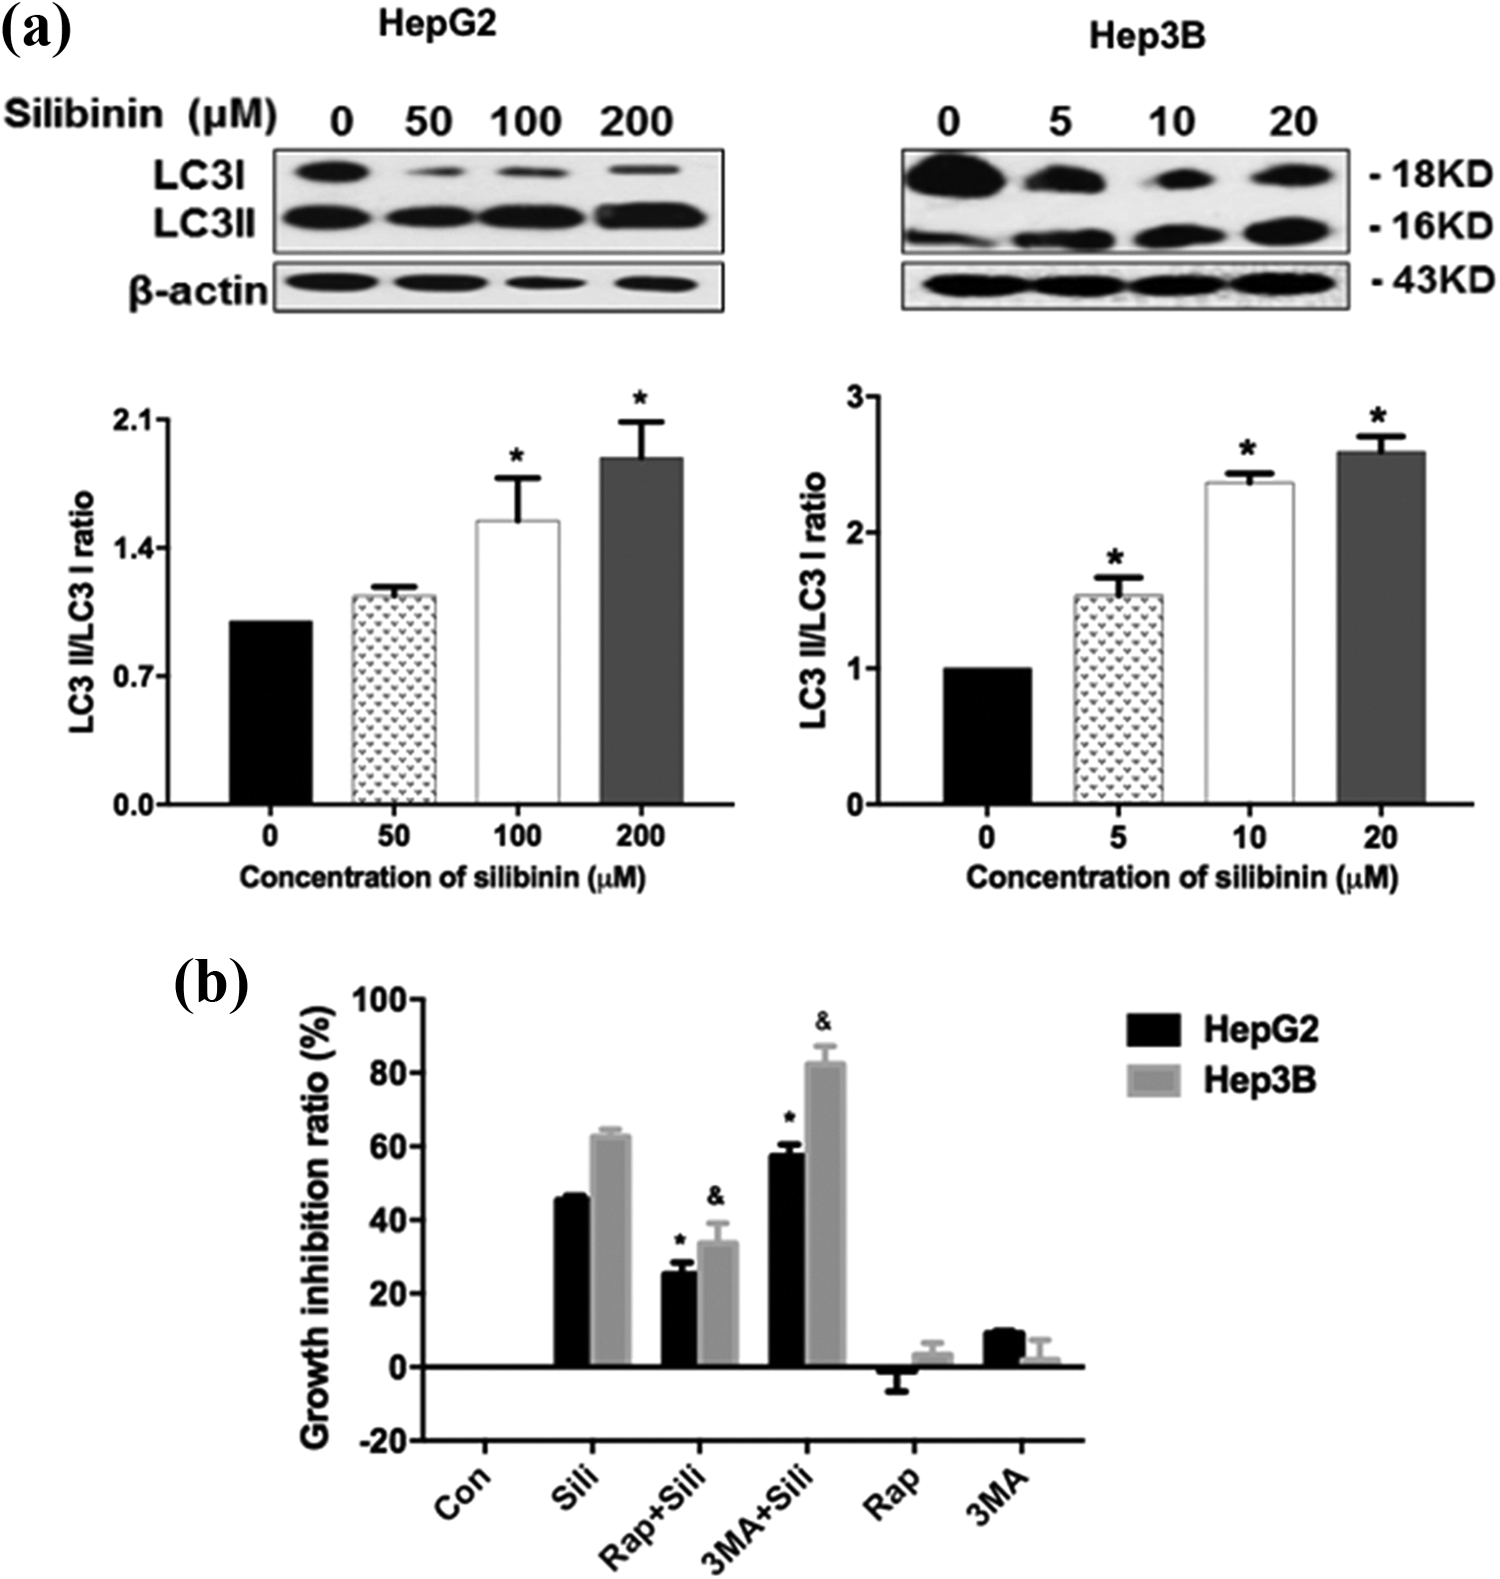
Autophagy antagonized silibinin-induced apoptosis in HepG2 and Hep3B cells. (a) Expression of LC3 in silibinin-treated HepG2 and Hep3B cells at 24 h. (b) The cells were pretreated with or without 2 μM 3MA and 0.5 μM Rap for 2 h, then co-incubated with silibinin for another 24 h, growth inhibitory ratio was measured by MTT method. n ≥ 3, Data are means ± S.E.M. *p < 0.05 versus silibinin alone-treated group in HepG2, &statistically significant compared with silibinin alone-treated group in Hep3B.

(c and d) Protein levels of PARP, pro-caspase 3, caspase 3, Bcl2, LC3, Glut1/4 and HK2 in cells were determined by western blot analysis.

AMPK activation played a protective role for the cell survival. (a) Western blot analysis of AMPK and p-AMPK levels after the treatment with silibinin for 24 h. β-Actin was used as an equal loading control. (b) The cells were incubated with 20 μM Compound C (CC), an AMPK inhibitor and/or with 5 μM salicylate (Sal), an AMPK activator for 2 h. Then silibinin was added to the cells, which were cultured for 24 h. The viability was measured by MTT assay. n ≥ 3, Data are means ± S.E.M, *p < 0.05, compared with silibinin-treated group in HepG2, &p < 0.05, statistically significant compared with silibinin alone-treated group in Hep3B.

(c) Cell lysates were separated by SDS-PAGE, and the protein levels of PARP, pro-caspase 3, caspase 3, Bcl2, AMPK, p-AMPK, LC3, Glut1/4 and HK2 were determined by western blot analysis.
Discussion
In this study, we show that silibinin is cytotoxic against both HepG2 and Hep3B cell lines in a dose- and time-dependent linear pattern. We demonstrate that silibinin treatment induces both apoptosis and autophagy; furthermore, it reduces glycolysis, an important pathway for ATP production, 36 thereby increasing apoptosis in HCC. Several small molecules capable of inhibiting glycolysis in experimental systems have been shown to have anticancer activity in vitro and in vivo. 36 Furthermore, we found that silibinin, which can reduce glycolysis, increases cytotoxicity in HCC.
Emerging data suggest that autophagy plays a critical role in maintaining cellular homeostasis and survival under stressed conditions. 37 Autophagy provides tricarboxylic acid cycle (TCA) metabolites and contributes to ATP generation. 38 Glucose is one of the most critical energy sources for tumor cells, required for generation of ATP to support cancer cell growth. HK2 is preferentially up-regulated by cancer cells, while hyperactive mTORC1 increases expression of HK2. 39 A recent comprehensive analysis reports mTORC1-mediated HK2 upregulation, and further demonstrates that mTORC1 signaling activates glycolysis. 40 Silibinin, which has been used as a liver protectant, induces apoptosis in human hepatocellular carcinoma HepG2 and Hep3B cells. 30 In recent years, some reports that silibinin has anti-diabetic effects.7,41–43 The present study has identified underlying mechanism by which silibinin induces autophagy, which attenuates apoptosis by blocking the utilization of glucose in HepG2 and Hep3B cells. Autophagy promotes glycolysis in HCC, 44 and the glycolysis attenuates apoptosis. 45 We summarize that autophagy controls or modulates energy metabolism, while change of metabolic pathways regulates autophagy activities. Autophagy and energy homeostasis are balanced each other; oxidative phosphorylation, reactive oxygen species in mitochondria, glycolysis, metabolism of glycogen and protein, and so on.46,47 An understanding of the role of autophagy in energy homeostasis could help appreciate how autophagy determines cell fate under stressful conditions or pathological processes. Although autophagy is a form of tumor cell death, recent studies suggest that mTORC1 activation is sufficient to stimulate glucose uptake and glycolysis, which are considered metabolic hallmarks of cancer. 48 Therefore, we suppose that energy stress is associated with autophagy dysfunction and glycolysis impairment, leading to increase in cytotoxicity. Accumulating evidence reveals that metabolic and cell survival pathways are closely connected and functionally interdependent. The present report indicates that silibinin induces autophagy to mediate glycolysis.
The tumor suppressor protein p53 influences a large range of cellular processes in determination of cellular fate. 49 Two other p53 family members are identified, named p63 and p73. The p53, p63, and p73 family share several common domains, including a transactivation domain (TAD), a DNA-binding domain (DBD), and an oligomerization domain (OD). 50 Although p63 and p73 share high sequential and structural similarities with p53, they also have functions that are distinct from p53.50,51 The p53 gene is mutated in more than 50% of human cancer cells. 52 In contrast, a sequence analysis of p63 found that it is rarely mutated in human cancer cell lines. 53 Our experiments show that silibinin induces p53-independent apoptosis; therefore, we speculate some possibility that p63- or p73-associated signaling positively regulates the apoptosis process. In our future study, we plan to analyze the effects of p63- and p73-associated signaling(s) in silibinin-treated HepG2 and Hep3B cells.
As a sensor of cellular energy, AMPK might provide a potential target for autophagy induction. Besides its key role in metabolism, AMPK has been shown to regulate autophagy by inhibition of mTORC1. 54 AMPK becomes activated in response to low nutrient or energy levels. 55 Some studies show that autophagy is enhanced under the glycolysis-suppressed condition and contributes to survival of other cancer cells to overcome glycolysis suppression. 37 It has been reported that AMPK acts in T cell acute lymphoblastic leukemia (T-ALL) to negatively regulate aerobic glycolysis and Glut1, while AMPK maintains mitochondrial function to promote cell survival. 56 Moderate aerobic glycolysis along with alternative metabolic pathways may therefore be required for tumor cells to maintain proliferative capacity and viability over the long term. AMPK and glycolysis may thus offer new therapeutic targets in the treatment of hepatocellular carcinoma.
One of anti-cancer strategies is induction of cancer cell apoptosis. An important issue remains to be considered for maximal levels of cell apoptosis. Our studies show that glycolysis and/or autophagy functions as a process mediating to attenuate apoptosis by ensuring cellular energy homeostasis. Drugs targeting glycolytic inhibition repress tumor progression. 57 The notion that repression of autophagy and/or glycolysis has to be taken into consideration to complete cancer cell apoptosis might give us a better idea for developing cancer therapy in the future.
Footnotes
Declaration of conflicting interests
The author(s) declared no potential conflicts of interest with respect to the research, authorship, and/or publication of this article.
Funding
The author(s) disclosed receipt of the following financial support for the research, authorship, and/or publication of this article: This research was supported by National Natural Science Foundation of China [No. 81703528 and No. 81803603].