
Abstract
This study aimed to evaluate the modes of action of harringtonine (HT) and homoharringtonine (HHT) alkaloids in cell with wild (HepG2/C3A) and mutant p53 (HuH-7.5). We performed assays for cytotoxicity, genotoxicity, induction of apoptosis, cell cycle phase, and membrane integrity. Obtained data were compared with the relative expression of mRNA of genes related to proliferation, apoptosis, cell cycle control, metabolism of xenobiotics, and reticulum endoplasmic stress. The relative expression of the genes showed an increase in apoptosis-inducing mRNAs, such as TNF and BBC3, as well as a reduction in BCL2 and BAK. The mRNAs of CYP2E1 and CYP2C19 xenobiotic metabolism genes increased in both lineages, while CYP3A4 increased only in the HuH-7.5 lineage. The mRNA expression of endoplasmic reticulum (ER) stress genes (ERN1 and EIF2AK3) was shown to increase in HHT and HT treatments. A similar increase was recorded in the mRNA expression of the TRAF2 gene. The changes observed in this study support the hypothesis that ER stress was more strongly associated with TNF induction, causing cell death by apoptosis in p53 mutant cells. This result with wild and mutant p53 cells may have clinical implications in the use of these compounds.
Introduction
Natural compounds have been used for medicinal purposes since antiquity. Even today, with modern technological advancements, many of our medications still use these compounds as a chemical base. 1 These compounds, known as phytochemicals, are a valuable resource in developing new therapies against various diseases, including cancer, for which phytochemicals have shown promising results with targeted-specific treatments. 2 Indeed, many phytochemicals, as in the case of alkaloids, can modulate antitumor activities, inducing apoptosis. 3 New phytochemicals for cancer treatment are discovered every year, yet many of the already known molecules require more thorough investigation to clarify their complex mechanisms of actions. To address this research gap, recent studies have used in vitro assay as a tool for prospecting compounds with therapeutic potential. More specifically, investigations to analyze new compounds’ cytotoxic behavior in different lines in vitro can help elucidate their mechanisms of action, and thus predict their effects on human health.
The harringtonine (HT) and homoharringtonine (HHT) compounds are secondary metabolites extracted from Asian coniferous species of the genus Cephalotaxus, belonging to the family Cephalotaxaceae. For instance, in the plant Cephalotaxus hainanensis, these compounds have already demonstrated effects against neoplasms reported by the local population in China. 4 Studies show that the main effect of these compounds consists of altering protein expression, 5 –7 reducing the in vitro cell viability in retinal glia lineage 8 and myeloma lineages U266, RPMI8226, MM.1S, and MM.1R, 9 and lymphoma lineages MUTZ-1, K562, MOLT4, and U-20S. 10 Among these compounds, HHT stood out in the studies, currently leading to Food and Drug Administration (FDA) approval for use with leukemia patients 11 and already presenting promising results in tests on patients with acute myeloid leukemia. 12 –14

Summary graph of the proposed mechanism of action of compounds HT and HHT in the lines HuH-7.5 and HepG2/C3A. HT: harringtonine; HHT: homoharringtonine.
In various types of cancer, the p53 protein is found to have mutated, leading this protein to have a major role in cancer development. In its wild type, p53 is responsible for tumor suppression by detecting DNA damage and responding to signs of intra- and extracellular stress. 15 Among the targets of response by this protein are DNA repair, cycle cell arrest, apoptosis, and antioxidant response. 15 However, the mutant form of this protein tends to accumulate in the cells’ cytoplasm, often losing its role as a tumor suppressor, which makes Tp53 an oncogene. 16 Mutations can lead to p53 protein gaining new functions and may alter other proteins’ responses, as well as leading to metastasis, preventing apoptosis, and inducing transcription of other genes. 16 These authors showed the accumulation of mutant p53 and the gaining of new functions can act as targets for therapies against types of cancer, making a new strategy to promote new treatments.
The HuH-7.5 strain used in this study has punctual mutations in its TP53 gene, causing it to accumulate in the cytoplasm. Additionally, this mutant protein has a higher half-life compared to its wild state. 17 The HepG2/C3A cells used in this study contain the TP53 gene in its wild state. Given the above, this work’s objective was to evaluate the effects of HT and HHT on tumor lineages of hepatic carcinoma HuH-7.5 and HepG2/C3A, differing in relation to p53 phenotype (mutant and wild, respectively). We also aimed to compare the gene expression patterns associated with cytotoxic effects, apoptosis induction, cell cycle arrest, membrane integrity, endoplasmic reticulum (ER) stress, and xenobiotic metabolism, to clarify the mode of action, seeking which molecular gene expression pathways these compounds interfere with, contributing to the understanding and safety of their possible use for human health.
Materials and methods
Chemical agents
The HT compound was acquired in ChemCruz®, Dutch (CAS 26833-85-2), molecular weight 531.59, C28H37NO9, and HHT in Sigma Aldrich®, USA (CAS 26833-87-4), molecular weight 545.62, C29H39NO9. Both were dissolved in dimethylsulfoxide (DMSO; Merck, Germany), at a concentration of 100 mM, and diluted in a culture medium for the treatments. The concentrations used for the assays were 0.001 µM, 0.12 µM, 0.25 µM, 0.5 µM, 1 µM, 5 µM, 10 µM, 20 µM, 40 µM, and 80 µM for cytotoxicity; 0.1 μM, 5 μM, and 10 μM for flow cytometry tests (apoptosis, cell cycle, membrane integrity, and cell count); 10 μM for genotoxicity and 5 μM for mRNA expression analysis, based on the cytotoxicity of the compounds. As a positive control, camptothecin 2 µM Sigma Aldrich®, USA was used (CAS 1531628-77-9), molecular weight 388.35, C20H17N2NaO5.
Cell cultivation
The line HuH-7.5 was donated by Professor Wander Pavanelli of the Department of Pathology of the State University of Londrina and HepG2/C3A was obtained from the Cell Bank of Rio de Janeiro (UFRJ), free of mycoplasma. The cells were cultivated in Dulbecco's Modified Eagle's Medium (DMEN) culture with low glucose (GIBCO, USA), supplemented with 10% fetal bovine serum (GIBCO, USA) and containing 1% antibiotic–antimycotic solution (GIBCO, USA). The cultured cells were kept in an incubator at 37°C and 5% of CO2. The lineage HepG2/C3A presents the expression of the wild Tp53 gene, while HuH-7.5 is a lineage with a mutation in the Tp53 gene. In all assays, 24 h of culture stabilization was used before administering the treatments. Three independent experiments were performed for each assay.
Cytotoxicity assay (resazurin)
The resazurin compound (Molecular Probes®, USA) was used in the final concentration of 60 µM. In plates of 96 wells were seeded 2.5 × 10⁴ cells/well for the lineage HepG2/C3A and 104 cells/well for HuH-7.5. After the 24-h treatments, the cultivation medium was exchanged and resazurin was added for 3 h when the plates were revealed in Glomax® (Promega, USA) to 540–560 nm excitation and 580–600 nm emission.
Cell cycle evaluation, apoptosis, and membrane integrity
In the 6-well plates, 2 × 10⁵ cells/well were seeded for the HuH-7.5 lineage and 6.1 × 10⁵ cells/well for the HepG2/C3A lineage. After the 24-h treatment with either HT or HHT, cells were harvested with 1% trypsin and centrifugation at 680 g for 5 min, discarding the supernatant and aliquots of 100 µL of the resuspended pellet in phosphate-buffered saline (500 µL) were added in a microtube of 1.5 mL to be processed, according to each assay described below. The cells were analyzed in a Guava easyCyteTM flow cytometer (Merck Millipore, USA).
To analyze the cell cycle, RNase was added to the concentration of 2 mg/mL and incubated at 37°C for 30 min. Cell permeabilization and DNA marking were performed with 100 µL of Triton X-100 sodium citrate at 0.1% and 5 mL of propidium iodide in dark for 30 min at 4°C, respectively. Subsequently, 5000 events were analyzed, and the percentages of cells were estimated at each phase of the cell cycle (G1, S, and G2/M) using the Incyte Millipore Software.
For apoptosis, we used the Kit Alexa fluor™ Annexin V (Invitrogen, USA-cod: A23204) adding 100 µL of the buffer and 5 µL of the dye/microtube for 10 min at room temperature. Then, we added 5 mL of 7-aminoactinomycin D (7-AAD) and, after 5 min, performed the reading of 5000 events/sample. The population of unmarked cells was considered living cells, those marked only with annexin as early apoptotic, those marked with 7-AAD as necrosis, and both marked were late apoptosis.
In the membrane integrity assay, propidium iodide was added (2 µg/mL) and incubated for 10 min. After 5000 events were analyzed and considered with a corrupted membrane, the events marked with the propidium iodide and considered with membrane integrates the population that was not marked with the compound. The cell count was performed, along with the membrane integrity test, where the number of cells per microliter was observed and used to estimate the total number of cells per treatment.
Genotoxicity assay
The comet assay was performed on a plate of 6 wells with 2.5 × 10⁵ cells/well for the lineage HuH-7.5 and 6.17 × 10⁵ cells/well for the HepG2/C3A. After the treatments (3 h), the cells were collected (Trypsin 0.025%) and centrifuged at 680 g for 5 min. The slides were prepared with 20 µL of cell suspension and 120 µL of agarose of low melting point at 37°C, deposited in pregelatinized lamina with agarose. They were then immersed in lysis solution (NaCl 2.5 M, ethylenediaminetetraacetic acid (EDTA) 100 mM, Tris 10 mM, 1% Triton X-100, 10% DMSO, pH 10, 4°C) for 1 h. After lysis, the slides were transferred to the electrophoresis tank with an ice alkaline buffer (NaOH 300 mM and EDTA 1 mM, pH > 13) for 20 min for DNA denaturation, followed by electrophoresis at 25 V and 300 mA for 20 min. The slides were neutralized using Tris-HCl buffer (pH 7.5) and fixed in absolute ethanol. The slides were stained using ethidium bromide (2 µg/mL) and photographed with a fluorescent microscope EVOS® FL auto Cell Imaging System (Thermo Fisher, USA), using a 200× magnification. One hundred cells/treatment/experiment were analyzed using the CometScore software® 2.0 , assuming the values of the Tail Moment.
mRNA expression analysis by RT-qPCR
The real-time gene expression (RT-qPCR) was used for genes related to apoptosis (BAK, BCL2, BBC3, TNF, CASP3, and CASP8), metabolism (CYP2E1, CYP3A4, CYP2C19, and CYP2D6), ER stress (ERN1 and EIF2AK3), cell cycle (CDKN1A and TP53), and proliferation (MYC, mTOR, NF-KB, BCN1, TRAF2, and ID4). A total of 2 × 10⁵ cells/flask for HuH-7.5 and 6.17 × 10⁵ cells/flask for HepG2/C3A were seeded and treated for 12 h. After treatment, RNA extraction was performed with an RNeasy® Mini Kit (Qiagen, Germany, cod: 74106), according to the manufacturer’s protocol. For the purity of total RNA in a spectrophotometer (A260/280 mm), we considered the ratio between 1.8 and 2 (Biodrop µLite, UK) and the detection of integrity verified in 1% agarose gel. cDNA was synthesized in T100™ ThermalCycler Bio-Rad, with 1000 ng of total RNA diluted in H2O DEPC (12.4 µL), 1 µL of Oligo DT (10 pmol), and 2 µL of each dNTPs (2.5 µM), maintained for 15 min at 60°C, followed by thermal shock. After adding 4 µL of 5X First-Strand Buffer (250 mM Tris-HCl, pH 8.3, 375 mM KCl, and 15 mM MgCl2) for 2 min at room temperature and 0.1 µL of RNase Out plus 0.5 µL of reverse transcriptase enzyme (M-MLV – Invitrogen, Life Technologies, USA), samples were incubated at 37°C for 50 min, followed by incubation at 70°C for 15 min and storage in a freezer at −80°C.
For real-time qPCR, 5 µL Plantinum SYBER Green qPCR Supermix-UDG (Bio-Rad, USA, cod: 11733038 ), 0.5 µL of each primer oligonucleotide (10 pmol), and 5 µL of cDNA of each sample (250 ng) were mixed and reacted in a ThermoCycler under the following conditions: 95°C for 5 min followed by 45 cycles of 95°C for 20 s, 60°C for 30 s, and 72°C for 20 s in the Lightcycler® Nano (Roche, Switzerland) equipment. The melting curve was analyzed at the end of each reaction with temperatures ranging from 50°C to 90°C every 0.5°C for 20 s. The genes tested in the treatments were compared with the expression of the reference gene, RPL13A.
Statistical analysis
The data obtained were compared by analysis of variance, followed by Dunnett’s test (p < 0.05) in the GraphPad Prism 5 program (San Diego, California, USA). The gene expression analysis was performed by the Rest software 2009, with statistical significance accepted when the expression factor (fold-change) was ≥2 or ≤2.
Results
Cytotoxicity of HT and HHT treatments
The HepG2/C3A lineage experiments (Figure 1(a)) showed that HT and HHT reduced cell viability in the concentrations ranging from 0.12 µM to 80 µM, while no effect was observed at 0.001 µM. The percentage of viable cells observed in HT treatments ranged from 54% to 63.7%, and for the HHT compound, it was between 53% and 66.6%.

Cell viability of (a) HepG2/C3A and (b) HuH-7.5 cells after 24 h of HT and HHT treatment. *Statistically significant when compared to the control (0 µM) by ANOVA and Dunnett’s test (p ≤ 0.05). HT: harringtonine; HHT: homoharringtonine; ANOVA: analysis of variance.
HT and HHT also showed cytotoxic effects at concentrations above 0.12 μM in the HuH-7.5 lineage (Figure 1(b)). The percentage of viable cells in HT treatment ranged from 41% to 52% without a dose–response curve effect. No difference was found when comparing the concentrations of 5 μM–80 μM (p > 0.05). Similar effects were found in HHT treatments, where viability ranged from 38.8% to 47.2% and did not present difference between the tested concentrations (p > 0.05).
Damage to membrane integrity and reduction in cell count by HT and HHT treatments
The cells HepG2/C3A did not show alterations in membrane integrity, as compared with the control, when exposed to HT and HHT treatments (p > 0.05) (Table 1). In the HuH-7.5 cells, both compounds showed reduction (p < 0.05) with concentrations ranging from 1 μM to 10 μM (Table 1). In both cell lines, cellular count values were lower (p < 0.05) for HT and HHT treatments when compared with the control (Table 1).
Cell concentration and membrane integrity of HepG2/C3A and HuH-7.5 cells after 24 h of HT and HHT treatments.
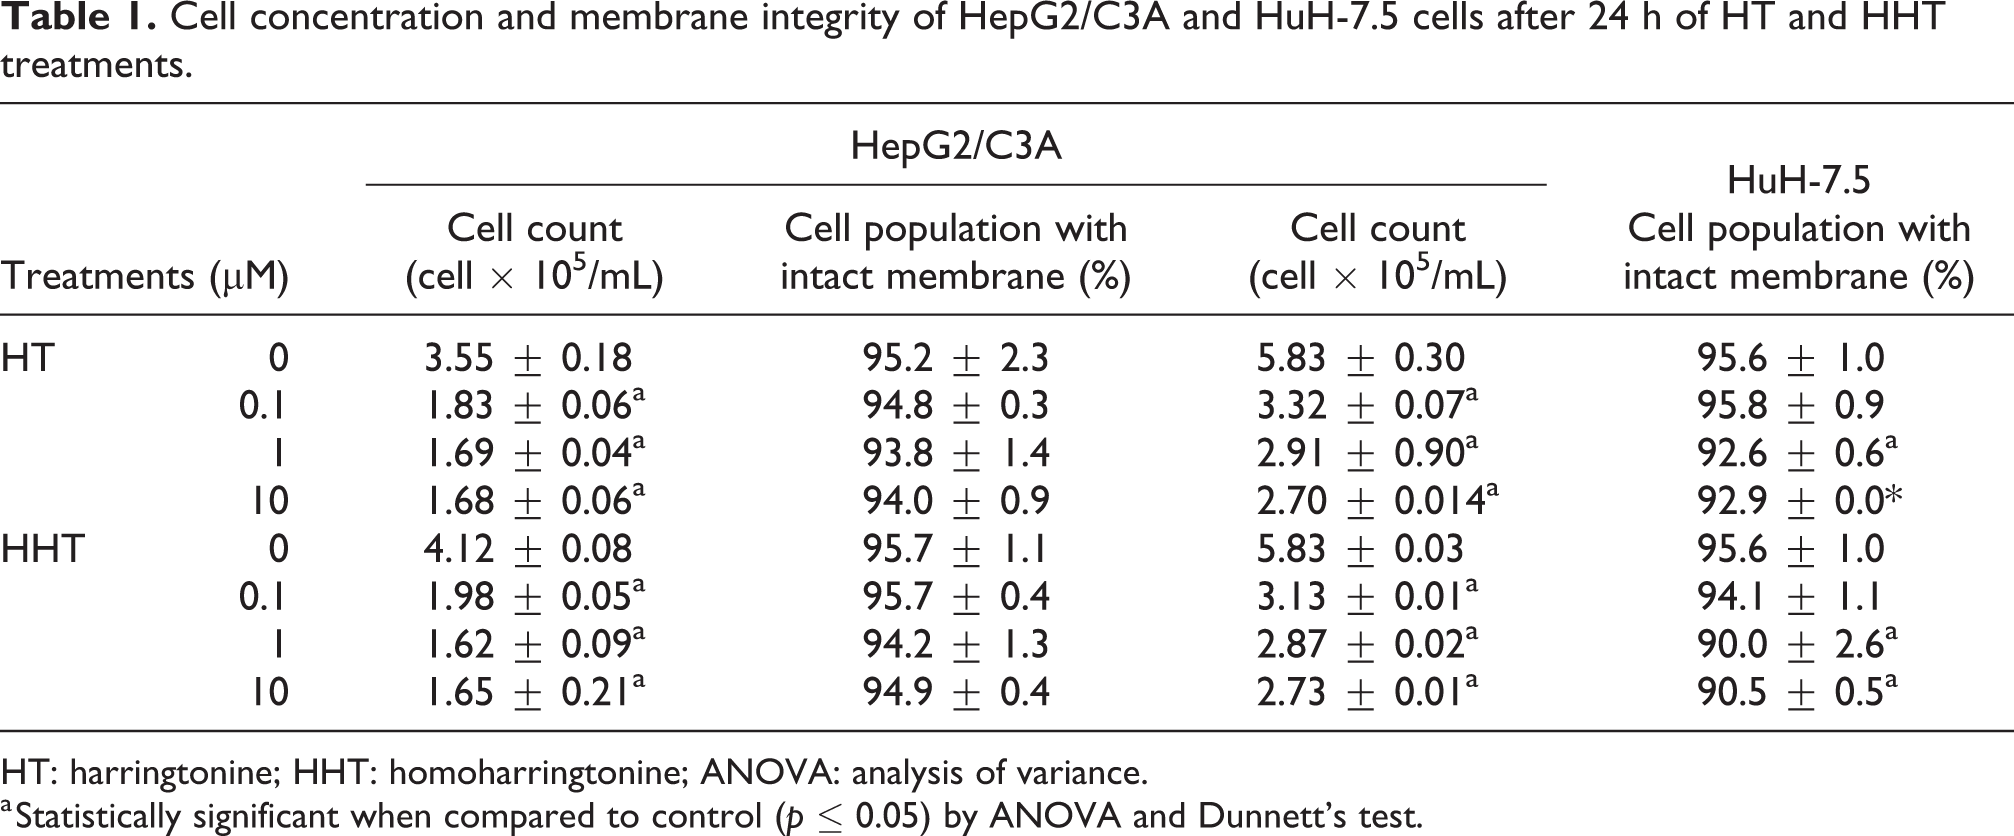
HT: harringtonine; HHT: homoharringtonine; ANOVA: analysis of variance.
a Statistically significant when compared to control (p ≤ 0.05) by ANOVA and Dunnett’s test.
Cell cycle changes induced by HT and HHT treatments
In the lineage HepG2/C3A (Figure 2(a)), different responses were observed after treatment with the HT and HHT compounds. When the cells were treated with HT, the cells in phases S and G1 of the cell cycle showed increased (p < 0.01). Moreover, when cells of this lineage were treated with HHT, the cells in the G2/M phase in all tested concentrations also increased. The cells of the HuH-7.5 lineage (Figure 2(b)) treated with HT showed decrease (p < 0.01) in the G1 phase at 0.1 μM, while those treated with HHT caused increase (p < 0.01) of cells in the G2/M phase for all concentrations tested.

Distribution of cell cycle phases, G1, S, and G2/M (in %) in HepG2/C3A (a) and HuH-7.5 lineages (b) after 24-h treatment with HT and HHT by flow cytometry. *Statistically significant when compared to control (0 µM) by ANOVA and Dunnett’s test (p ≤ 0.05). HT: harringtonine; HHT: homoharringtonine; ANOVA: analysis of variance.
Induction of apoptosis by HT and HHT treatments
The HepG2/C3A lineage that was treated with HT had early apoptosis increased (p < 0.05) in both 1 and 10 μμ concentrations (Table 2). When this lineage was treated with HHT, no increase in early apoptosis was observed (p < 0.05), which was higher than the HT treatment.
Apoptosis analysis of HT and HHT treatment in HepG2/C3A and HuH-7.5 cells.
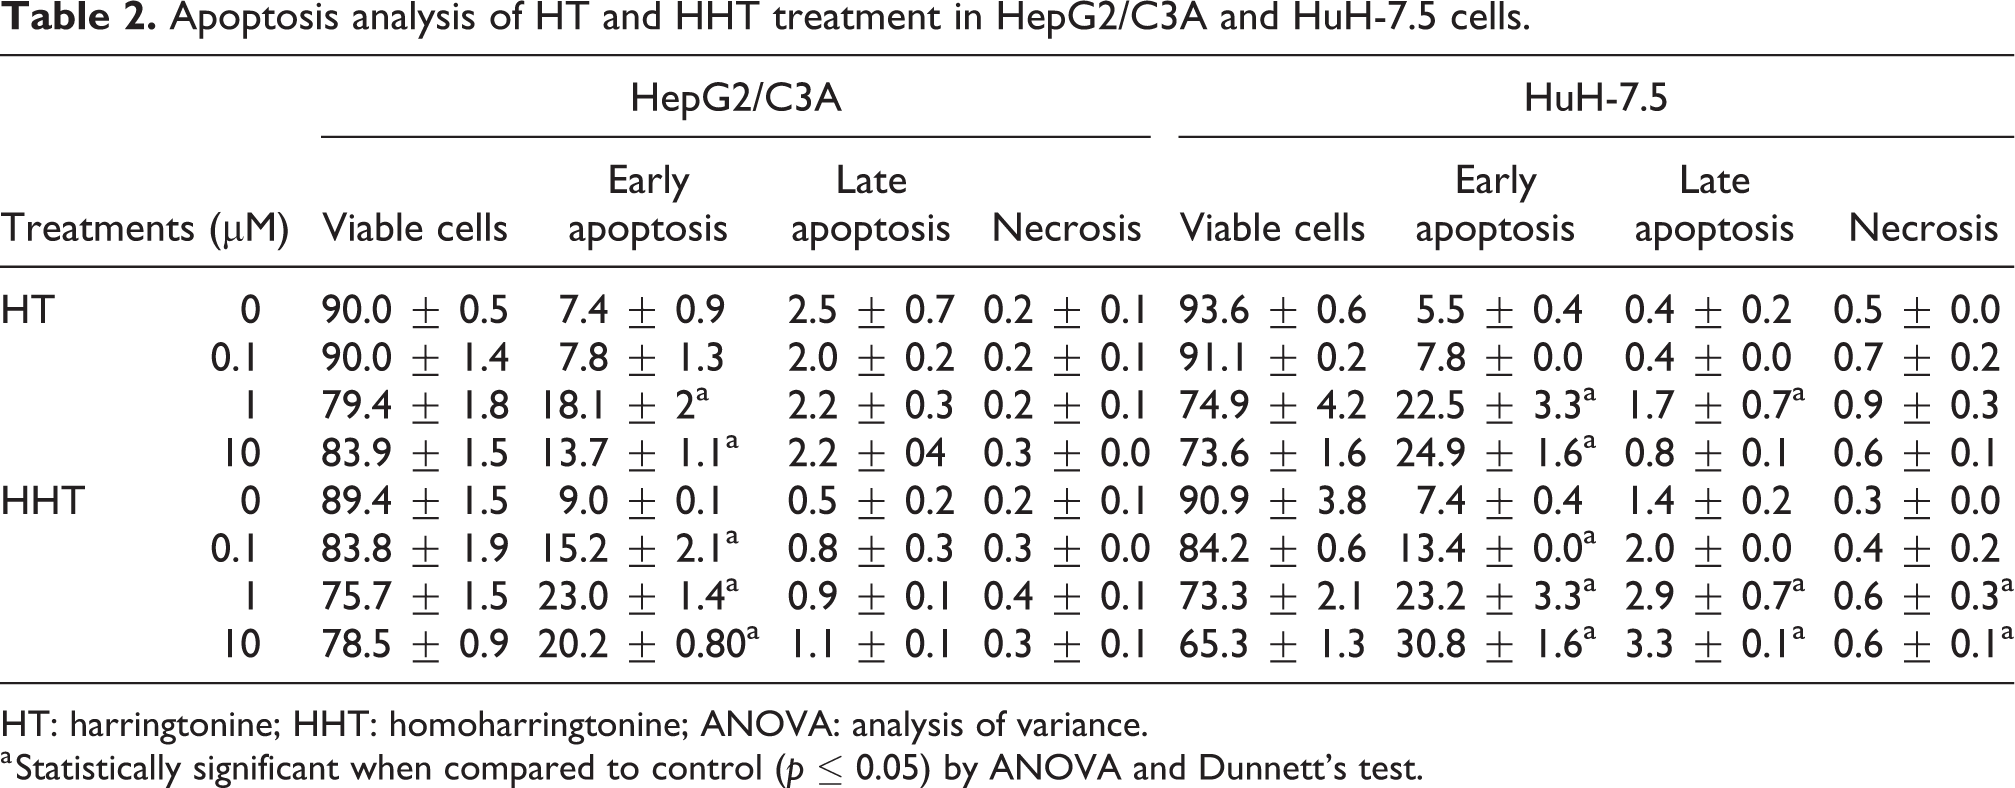
HT: harringtonine; HHT: homoharringtonine; ANOVA: analysis of variance.
a Statistically significant when compared to control (p ≤ 0.05) by ANOVA and Dunnett’s test.
In the HuH-7.5 lineage treated with HT, the number of early apoptotic cells in both 1 and 10 μM concentrations (p < 0.05) was observed increased. Late apoptosis also showed increased (p < 0.05) at the concentration of 1 µM (Table 2). The treatments with HHT demonstrated increased in early apoptosis for all concentrations tested (p < 0.05). Moreover, with HHT (1 μM and 10 μM), an increase (p < 0.05) in late apoptosis and necrosis was observed (Table 2).
DNA damage
In the genotoxicity assay (Figure 3), the genetic material showed no damage in either cell lineages treated with HT or HHT.
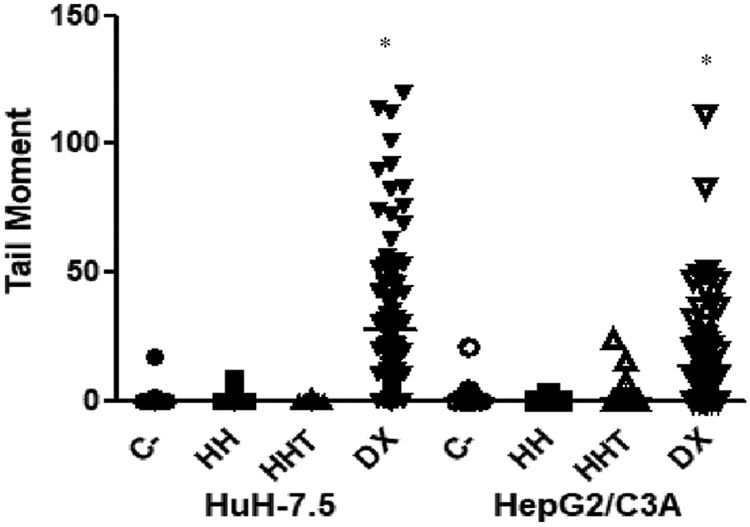
The tail moment obtained in the comet assay of the HuH-7.5 and HepG2/C3A lineages after 3 h of HT or HHT treatment at 10 µM concentration. *Statistically significant results (p < 0.05). CPT: camptothecin; HT: harringtonine; HHT: homoharringtonine.
mRNAs expression changes in response to HT and HHT treatment
The cells of the HepG2/C3A lineage showed increase (twofold change, p < 0.05) in the mRNA levels of the CDKN1A gene in both HT and HHT treatments (Figure 4(a)). Regarding the levels of transcription of the metabolic genes, an increase (10-fold change, p < 0.05) in CYP2E1 for HT (10-fold change) and for HHT (9-fold change) treatments were noted. The CYP2C19 gene was upregulated in both treatments (HT and HHT, sixfold change). The mRNA levels of the BBC3 gene showed increase in expression after HT (16-fold change) and HHT (12-fold change) treatments. The TNF gene transcripts were superexpressed by a factor of 2996 in both HT and HHT treatments. The TRAF2 gene showed increase in transcription after HT (12-fold change) and HHT (10-fold change) treatments. Caspase 3 gene expression was observed to have increase in the HT treatment only (twofold change). In both the HT and HHT treatments, the expression of the ID4 gene (threefold change) and the EIF2AK3 gene (twofold change) showed increased. The ERN1 gene mRNA observations showed overexpression after HT (14-fold change) and HHT (15-fold change) treatments. The mRNA of the NFKB1 gene exhibited increase with HT (10-fold change) and HHT (9-fold change) treatments.

Relative gene expression in HepG2/C3A (a) and HuH-7.5 lineages (b) after 12-h treatment with HT and HHT from RT-qPCR. Statistical analysis was performed using the REST 2009 software. *Significant statistical difference (p ≤ 0.05) and ratio ≤0.5 or ≥2. HT: harringtonine; HHT: homoharringtonine.
In the HuH-7.5 lineage (Figure 4(b)), HT and HHT treatments inhibited mRNA expression of the BAK and BCL2 genes; the fold-change was two and six times lower when treated with HT and two and five times lower with HHT, respectively. The mRNA levels of the BBC3, TNF, and TRAF2 genes were overexpressed when this cell lineage was treated with HT and HHT. The fold-change values were 20, 613, and 3 times higher than the control for HT treatment, and 17, 920, and 4 times higher in the HHT treatment, respectively. Some metabolic gene mRNAs were overexpressed in the HuH-7.5 lineage treated with HT, with nine, two, and twofold change increase in the expression of CYP2E1, CYP3A4, and CYP2C19, respectively. After HHT treatment, increase for the same mRNAs, with 12, 3, and 8-fold change in the expression of CYP2E1, CYP3A4, and CYP2C19, respectively, was observed. Other mRNAs were also overexpressed in this lineage, such as those of the NFKB1 gene, which increased by ninefold change in both HT and HHT treatments; ID4, which increased by fivefold change in both treatments; and ERN1, which increased fourfold change after HT treatment and ninefold change after HHT treatment. The other tested genes (CASP3, CASP8, CYP2D6, EIF2AK3, MYC, mTOR, BCN1, CDKN1A, and TP53) showed no alterations in their expression pattern compared to the control.
Discussion
In vitro studies are necessary to determine new compounds’ (especially phytochemicals) antiproliferative potential and to clarify their complex mechanisms of action. In our study, the researchers examined the antiproliferative potential and mechanism of action of (-)-cubebin, goniothalamin, and plumbagin 18 –21 among others. The researchers described the effects of two compounds, HT and HHT, and related their mode of action and antiproliferative potential in two hepatocarcinoma lineages; one with a p53 mutation (HuH-7.5) and another wild type (HepG2/C3A). They observed that both compounds had apoptotic effects in both cell lines, but with different profiles for HT and HHT.
The metabolic genes of xenobiotics, CYP2E1, CYP3A4, and CYP2C19 in the HuH-7.5 lineage, as well as CYP2E1 and CYP2C19 in the HepG2/C3A lineage, showed increased transcription rates after the treatments. These genes may be overexpressed by xenobiotics, are responsible for metabolizing compounds for elimination, and may cause some pathogenicity since this process can also cause an increase of free radical species causing cell damage. 22
The cytotoxicity of the compounds found in concentrations above 0.12 µM in the hepatic strains studied here was also found by other authors in retinal glial cells, 8 HL-60 lineages, 23 myeloma lineages, 9 as well as in lymphomas of MUTZ-1, MOLT4, and K56210 in similar concentrations. However, reduced viability was less effective for some lineages, such as osteosarcoma U-20S.10 In our study, reduced cell viability is directly related to the reduced number of cells found in each treatment, suggesting that both HT and HHT treatments have apoptotic effects at concentrations ranging from 0.1 µM to 10 µM. It is known that alkaloids inhibit protein translation, linking to the ribosomes, thus preventing elongation of protein molecules. 24 HT also alters the mRNA synthesis of centromeric protein genes, 25 possibly leading to the apoptosis of the cells studied.
Plasma membrane damage observed in the HuH-7.5 cells can also be related with the cytotoxicity of the HT and HHT compounds since the viability values found in this lineage were lower than those found on HepG2/C3A. In Philipp et al., 26 HHT was tested in gallbladder adenocarcinoma cell lines (Mz-ChA-1), pancreatic adenocarcinoma cell lines (A818-4 and Pt45P1), and colorectal adenocarcinoma cell lines (HT-29) treated in concentrations similar to this study (0.01–1 µM). Increased integrity loss was observed only in the A818-4 lineage. This reduced membrane integrity may be related to the increased rate of necrosis observed since cell necrosis is known to occur after the loss of membrane integrity. 27
The relative overexpression of TNF in both cell lines treated with HT and HHT is a markedly defined effect and relates with cellular inflammatory processes, 28,29 apoptosis, 30 and necrosis. 31 Thus, it may be one of the main gene markers responsible for the response to these compounds in both cell lines. The cytokine synthesized by the TNF gene induced BBC3 gene expression, which gave rise to the PUMA protein, a pro-apoptotic protein of the Bcl-2 family, which, through the p53-independent pathway, may lead to cell apoptosis. 32 Cell death can also be triggered by the NF-κb gene since PUMA activation is performed by the p65 subunit of the NF-κb protein. 33 In addition, we observed a lower expression of the BCL2 in the HuH-7.5 lineage for both HT and HHT, probably in response to the inhibition caused by the PUMA protein responsible for regulating antiapoptotic proteins. 34 Thus, the compounds tested in our study induced TNF and BBC3 and reduced BCL2, which may be related to the observed cell death (apoptosis and necrosis) found in the flow cytometry in both lineages.
HT and HHT inducing apoptosis in other cell lines has been described in the literature. Fang et al. 35 observed that, for HT, apoptosis is induced through an increase in the concentration of CA+2 in the nuclear regions of HL-60 cells (human myeloid leukemia cells), demonstrating that CA+2 is a signal and regulator of the cell death process. TNF-α promoted an increase of Ca+2 in the intracellular region, resulting in apoptosis. 36 These ions are released by the ER after cellular stress, including the response of signaling by TNF-α. 37 Cai et al. 38 observed that HHT treatment induced apoptosis in the leukemic lineages MOLT-3, MOLT-16, Jurkat, and P12, with mitochondria releasing cytochrome c and the activation of caspases, as well as the movement of BAX proteins intracellularly. Yinjun et al., 39 however, found similar results by using HHT to induce apoptosis in cell lines of myeloid leukemia U937, HL-60, HEL, THP, and K562, through the activation of caspase cascade and induction of the BAX protein. In the human colorectal tumor lineages (RKO and HT-29), the HHT compound induced apoptosis via a TNF-related apoptosis-inducing ligand (TRAIL), a receptor of the TNF family, as well as the suppression of some antiapoptotic genes (MCL-1 and cFLIP). 40 In the present study, evidence points to induced apoptosis, both through the intrinsic pathway (through an increase in BBC3 and a decrease in BCL2) and the extrinsic pathway (through an increase in TNF).
In this study, TP53 gene expression showed no change, and the same was observed in the induction of DNA damage in either lineage, regardless of the way the gene was presented (mutated or wild). In the HuH-7.5 lineage, p53 has punctual mutations and deletions, with a half-life of approximately 240 min, 41 causing it to accumulate in the cytoplasm and impact its function. 17 Thus, the lower efficiency of HT and HHT treatments in the HepG2/C3A lineage (wild p53), compared with HuH-7.5, is possibly related to the functionality of this protein. Considering this, we can suggest that any activation of this protein in HuH-7.5 does not present adequate cellular response due to mutations or that these mutations lead to a greater apoptotic effect by the accumulated amount intracellularly, unlike the wild p53 lineage.
Furthermore, the two cell lines treated with HHT showed cycle arrest in the G2/M phase, but in the HepG2/C3A lineage, the S-phase population was also increased. The complex process that leads to arrests in these cells still requires further clarification, but it is probably related to the action of HT and HHT in altering protein synthesis in eukaryotic cells. 42,43 This alteration may result in the accumulation of abnormal proteins, causing alterations in ER homeostasis by increasing proteins, such as PERK and IRE1, and activating the ER stress response pathways. 44,45 PERK and IRE1 are associated with the detection of abnormal proteins, and the active protein eIF2 decreases protein synthesis and protein accumulation, thus avoiding further increase in ER stress. 46 IRE1 is responsible for detecting stress in the lattice along with PERK, binding with malformed proteins, and acting in the signaling of cascade reactions for the transcription of genes related to ER stress, ensuring cell survival. 47 This study showed positive regulation of the genes EIF2AK3 and IRE1, which encode the proteins PERK and IRE1, suggesting that HT and HHT compounds disrupted the homeostasis of protein synthesis and induced ER stress.
IRN1 may influence pro-inflammatory genes (such as NFKB1), in the presence of an ER stress, by activating the NF-κb pathways. 48 Furthermore, an IRE1 isoform (IRE1α) is also associated with TRAF2 recruitment, which induces suppression of BCL2 by suppressing antiapoptotic genes, in addition to the effect of ER stress-inducing cell death receptors, such as TRAIL. 49 The researchers also observed that the large increase in TNF expression may be related to inducing apoptosis by indirect recruitment of TRAF2 and NF-KB in response to the cascade of apoptotic reactions.
In 2012, FDA approved the use of the HHT compound for studies in patients with chronic or advanced myeloid leukemia, showing a step forward in the clinical evaluation of these compounds. 11 However, the question of safety in using these compounds remains. In response to this, the researchers tested and observed an increase in the mRNA levels of the ID4 proliferation gene in two cell lines treated with HT and HHT compounds. The corresponding results suggest that the question of safety of use still remains, as this gene is superexpressed in several types of cancer. 50 The ID4 gene promotes the progression of the cell cycle and functions as a timer, determining when normal cells will be differentiated and decreasing its expression when the cells are differentiated. 51 However, the functions of the ID4 gene poses a controversy, since in some lineages, the ID4 gene is hypermethylated, but ID4 proteins can increase the mRNA translation of pro-angiogenic cytokines, such as IL8 and GRO-alpha. 50 Thus, HT and HHT treatments could induce tumor differentiation and angiogenesis, contributing to the unwanted evolution of the pathology rather than fighting it.
In summary, the researchers can assume that HT and HHT compounds induce apoptosis in the HuH-7.5 and HepG2/C3A cell lineages, either through the extrinsic pathway by TNF receptors (mRNA) or through the intrinsic pathway by the increase of mRNA of BBC3 and decrease of BCL2. Furthermore, these compounds also promote ER stress, as they inhibit the translation and elongation of proteins. As observed in our study, the mRNA of the ERN1 and EIF2AK3 genes was increased, as these proteins are linked to the recruitment of pro-inflammatory proteins such as NF-ΚB and TRAF2, and the latter of which suppresses BCL2. The authors also observed apoptotic signaling by TNF, which induced an indirect increase in the mRNA expression of the BBC3 gene by the protein NF-κb. The compounds also stimulated mRNA expression of xenobiotic metabolic genes in both lineages and alterations in the cell cycle, probably caused by ER stress. The p53 mutation in the HuH-7.5 cell lineage seems to be related with the greater antiproliferative effects of these compounds.
Footnotes
Acknowledgments
The authors gratefully acknowledge CAPES (Coordenação de Aperfeiçoamento de Pessoal de Nível Superior/Brasil), CNPq (Conselho Nacional de Desenvolvimento Científico e Tecnológico/Brasil), FINEP (Financiadora de Estudos e Projetos/Brasil), and Fundação Araucária (Fundação de Amparo a Pesquisa do Estado do Paraná/Brasil) for support infrastructure and fellows of the university.
Author contributions
DPF and MSM conceived and designed the experiments, wrote the paper. DPF, BIB, TAZ, LAM, LVAL, and SRL performed the experiments and analysis of the data. All authors have read and approved the final manuscript.
Declaration of conflicting interests
The author(s) declared no potential conflicts of interest with respect to the research, authorship, and/or publication of this article.
Funding
The author(s) disclosed receipt of the following financial support for the research, authorship, and/or publication of this article: This work was supported by CAPES (Coordenação de Aperfeiçoamento de Pessoal de Nível Superior/Brasil), CNPq (Conselho Nacional de Desenvolvimento Científico e Tecnológico/Brasil), FINEP (Financiadora de Estudos e Projetos/Brasil), and Fundação Araucária (Fundação de Amparo a Pesquisa do Estado do Paraná/Brasil).