
Abstract
Purpose:
To evaluate the neurotoxic effect of amalgam dental fillings on plasma mercury (Hg) levels and retino-choroidal layers measured by spectral domain optical coherence tomography (SD-OCT).
Materials/Methods:
Study participants included 56 cases with amalgam dental fillings and 44 healthy controls. All participants were examined in terms of detailed ophthalmic examination, oral examination, and body mass index (BMI). The measurement of retinal layers and choroid was performed using SD-OCT. Venous blood samples were collected and blood Hg levels were measured using cold vapor atomic absorption spectrometric analysis. Correlations between SD-OCT measurement results and blood Hg levels were analyzed.
Results:
There were no differences between groups in terms of age, sex, or BMI. The mean blood Hg level was 2.76 ± 1.21 µg/L in the amalgam group and 2.06 ± 1.15 µg/L in the control group (p = 0.04). The Hg/BMI ratio was 0.12 ± 0.06 kg/m2 in the amalgam group and 0.09 ± 0.05 kg/m2 in the control group (p = 0.01). Reduced volumes of ganglion cell layer and inner plexiform layer were observed in the amalgam group when compared with the control group (p < 0.05).
Conclusion:
Amalgam dental fillings can cause retinal neurotoxicity. SD-OCT can be useful for evaluating amalgam-related retinal neurotoxicity.
Introduction
Inorganic mercury (Hg) is a component of amalgam. Amalgam has been used in dentistry for more than 150 years and is still frequently used in restorative dental materials. 1,2 Inorganic Hg may be found in one of three oxidation states (Hg0, Hg+, and Hg++), each with a specific toxic profile. Hg toxicity varies with the form of Hg, the dose, and the rate of exposure. Elemental Hg (Hg0) includes metallic Hg and Hg vapor. 1
Amalgam dental fillings consist of approximately 50% elemental Hg. Studies have shown that amalgam dental fillings are not inert and that rigorous chewing and brushing of the teeth stimulates the release of Hg vapor or inorganic ions from amalgam surfaces. The released Hg can be inhaled or dissolved in saliva, then swallowed and distributed via blood throughout the body. 1,3 Adults with dental amalgam fillings are exposed to approximately 1–10 μg Hg/day of elemental Hg, which is 80% of the total Hg absorbed daily. 1,4 After removing all amalgam dental fillings, a patient’s blood Hg level decreases substantially. 5 Elemental Hg is lipid soluble and passes easily through the blood–brain barrier and blood–retina barrier, so a major target is the neurologic tissues. 1,6 Hg is a heavy metal with known neurotoxic effects on human health. 7 However, the toxicity of amalgam is still a controversial issue. 2
Spectral domain optical coherence tomography (SD-OCT) is an objective and noninvasive method for evaluating retinal and choroidal tissue. It is used in the evaluation of many neurotoxic and neurodegenerative conditions. 8 –10 Inorganic Hg can accumulate in the retinal and choroidal tissue; therefore neurotoxicity due to inorganic Hg in such these tissues can be expected. 3,6,11 We aimed to evaluate amalgam toxicity using SD-OCT findings and to evaluate the relationship of these findings with blood Hg levels.
Materials and methods
This prospective study was conducted in the Department of Ophthalmology at the Adıyaman University School of Medicine. Written informed consent was obtained from all participants, and the study was performed in accordance with the Declaration of Helsinki. The study was approved by the ethics committee of Adıyaman University Faculty of Medicine with number of 2016/1-18.
Fifty-six patients with amalgam dental fillings (amalgam group) and 44 healthy age- and gender-matched volunteers (control group) were enrolled. All participants were admitted to the study following a detailed clinical examination of their oral cavity. The presence and number of amalgam dental fillings and whether any intervention was made to amalgam dental fillings in the last year were noted. In face-to face interviews, all participants were questioned about their demographic characteristics, smoking habits, alcohol use, occupation, duration of residence at study areas, past medical histories, and dietary habits. Potential participants who had been living in the region for less than 5 years, had smoking or alcohol use habits, who abided by non-Mediterranean dietary habits, and/or had a medical condition or profession that might have affected blood Hg levels were excluded from the study. We also excluded patients with a history of interventions involving amalgam dental fillings in the past 4 months.
Complete ocular examinations were performed to assess the best corrected visual acuity, biomicroscopy, tonometry, and fundus examination by dilating eye. Participants with any pathology that might have affected retinal or choroid SD-OCT measurements (such as glaucoma, anemia, uveitis, ocular pathology, and past ocular surgery) were excluded from the study. Each participant’s height and weight were measured and their body mass index (BMI) was then calculated as weight (kg) divided by the square of height (m2).
SD-OCT measurements
SD-OCT (Spectralis™ OCT, Version 6.0, Heidelberg Engineering, Germany) measurements of both eyes were performed through undilated pupils at the Adıyaman University Medical Faculty Department of Ophthalmology. All measurements were conducted by the same technician, who blinded as to the characteristics of each group of individuals. Macular and peripapillary SD-OCT scans were performed. The retinal nerve fiber layer (RNFL) thickness was evaluated at seven regions, to include (temporal (T), nasal (N), temporal superior (TS), nasal superior (NS), temporal inferior (TI), nasal inferior (NI), and global (G) with peripapillary SD-OCT measurements (Figure 1). The averaged thicknesses of the seven regions were recorded in micrometer. The measurements of six regions were highly correlated with global RNFL thickness; therefore we used only global RNFL thickness measurements in our analysis. Segmentation of the macular SD-OCT measurement into layers (RNFL, ganglion cell layer (GCL), inner plexiform layer (IPL), inner nuclear layer (INL), outer plexiform layer (OPL), and outer nuclear layer (ONL)) was automatically done by the device (Figure 2). The SD-OCT mapping software generates automated retinal thickness measurements based on nine subfield analyses of three concentric rings with diameters of 1, 3, and 6 mm as defined by the Early Treatment Diabetic Retinopathy Study. 12 The averaged thicknesses of nine regions were recorded in micrometer. The volume measurements of GCL, IPL, INL, OPL, and ONL were determined, and the macular volume of each layer was recorded in cubic millimeters (mm3; Figure 3). Choroid thickness (CT) values were measured manually by the same author; this person was blinded about of the diagnosis of the subjects. CT was accepted as the distance between the outer edge of the retina pigment epithelium and choroid–sclera border. A perpendicular line was drawn between these two lines using a device measurement tool in the subfoveal area and with intervals of 500 μm from the subfoveal to the nasal and temporal areas (Figure 4). The mean values of these three measurements were accepted as the CT.
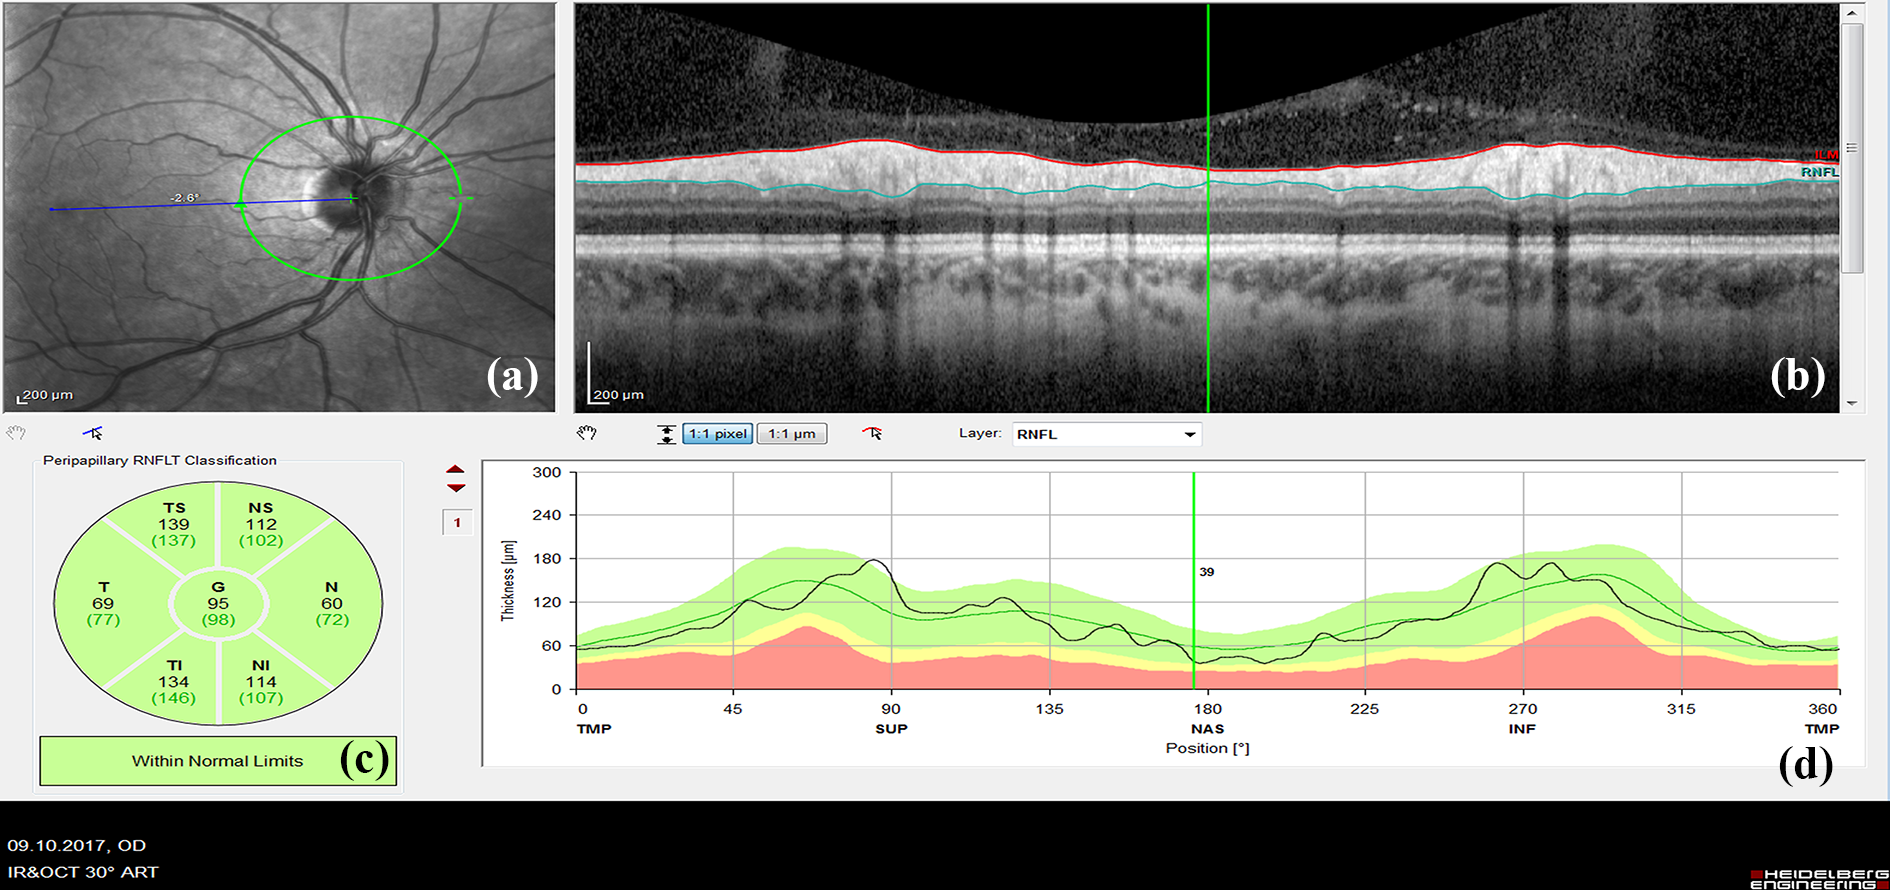
Measurement of RNFL thicknesses with SD-OCT. (a) A circle drawn around the optic disc to measure peripapillary RNFL thickness. (b) A picture demonstrating RNFL section. (c) Measured RNFL thickness in micrometer at seven sectors: temporal superior (TS), nasal superior (NS), temporal (T), nasal (N), temporal inferior (TI), nasal inferior (NI), and global (G) sectors. (d) RNFL thickness map. RNFL: retinal nerve fiber layer; SD-OCT: spectral domain optical coherence tomography.
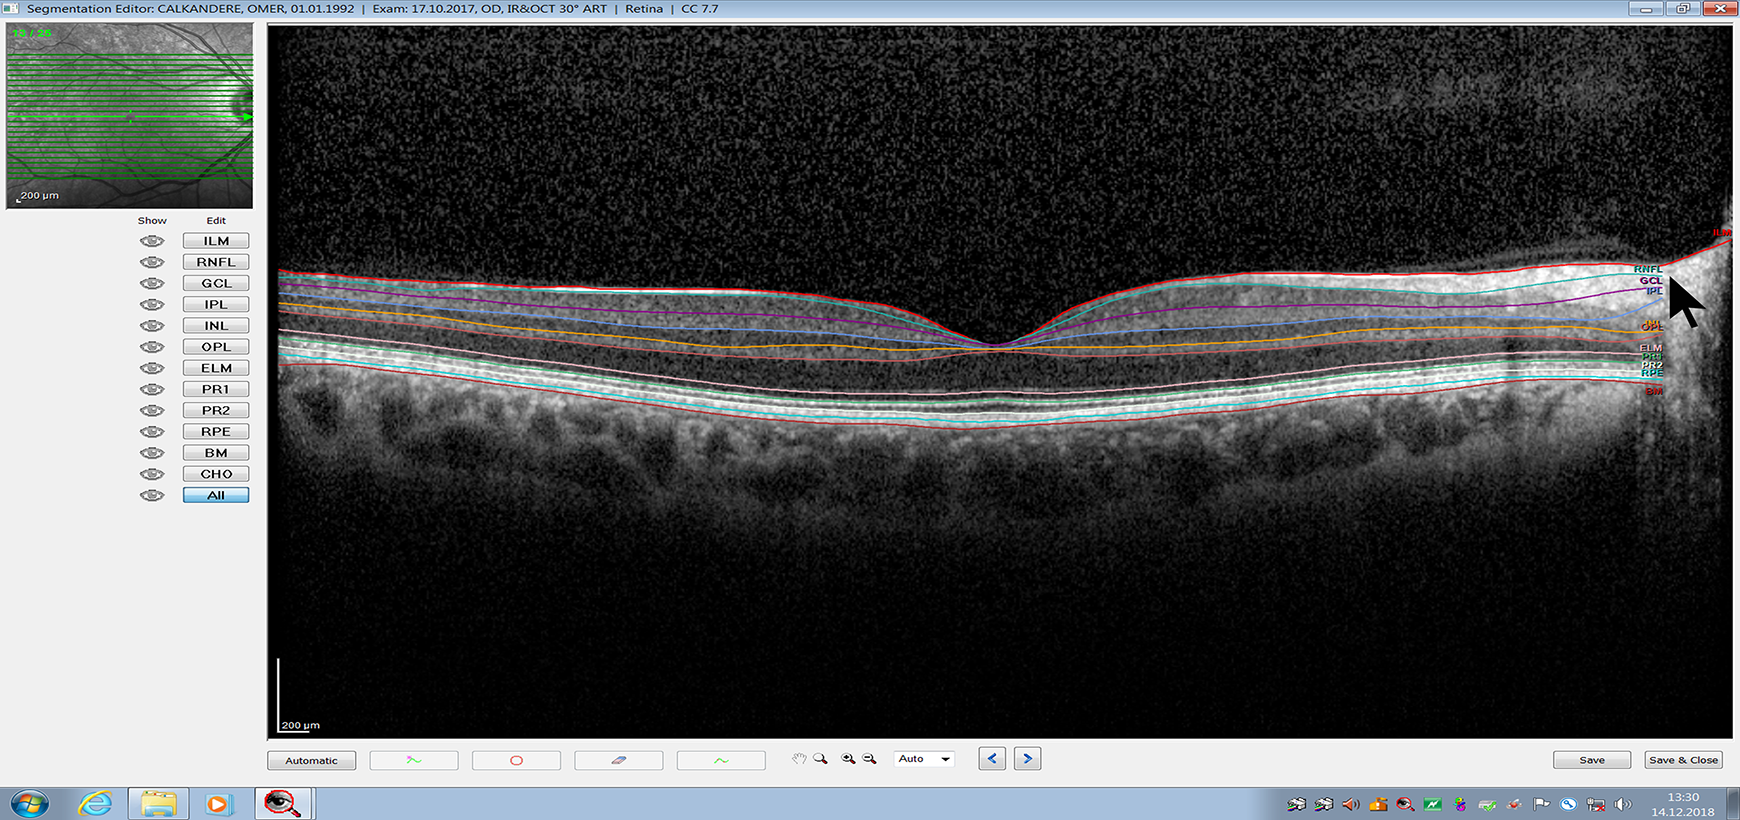
Automatic segmentation of the retina for measurement of retinal layers by spectral domain optical coherence tomography. The RNFL, GCL, IPL layers (arrow). RNFL: retinal nerve fiber layer; GCL: ganglion cell layer; IPL: inner plexiform layer; INL: inner nuclear layer; OPL: outer plexiform layer.

Measurement of IPL. (a) A circle drawn around the macula to measure IPL thickness in micrometer. (b) A picture demonstrating IPL section. (c) Measured IPL thickness at nine sectors in micrometer and volume of the IPL in cubic millimeters (mm3). (d) The thickness map of the IPL. ETDRS: Early Treatment Diabetic Retinopathy Study; IPL: inner plexiform layer.

Manually measured choroidal thickness in micrometer on spectral domain optical coherence tomography scans. A perpendicular line (middle yellow line) was drawn at the subfoveal from the outer edge of the retinal pigment epithelium to the choroid–sclera junction. Two additional lines were drawn at the nasal and temporal area with 500 µm intervals from the subfoveal line.
Laboratory analyses of Hg
Whole blood samples were collected from subjects in ethylenediaminetetraacetic acid–coated and trace metal-free Vacutainer tubes (BD Medical, Franklin Lakes, NJ, USA). The frozen samples were transported for analysis to the Laboratory of Department of Medical Biochemistry of Adıyaman University School of Medicine. They were stored frozen (−80°C) and typically analyzed within 1 week of collection.
We used cold vapor atomic absorption spectrometric (CVAAS) analysis for measuring Hg levels in blood samples. CVAAS analysis was carried out at Laboratory of Department of Medical Biochemistry of Adıyaman University School of Medicine. Blood samples were briefly digested using a Berghof microwave digestion system (Berghof Products Instruments GmbH, Eningen, Germany) by the addition of 5 ml 65% HNO3 and 2 ml H2O2 to 2 ml of blood. A temperature program was applied as described by Özdabak et al. 13 Hg levels in digested blood samples were determined using an Analytik Jena (Analytik Jena AG, Jena, Germany) ZEEnit 700p AA spectrometer equipped with HS60 Hydride system. Standard working solutions (SCP Science, Canada) were prepared by serial dilution of 1000 mg/L standard stock solution. A reducing agent was also used; this was a combination of 0.3% (m/V) NaBH4 and 0.1% (m/V) NaOH.
Statistical analysis
SPSS 15.0 (IBM Corp., Armonk, New York, USA) was used for statistical analysis of the data. The mean, standard deviation, and median (minimum–maximum) were used in descriptive statistics. A χ2 test was used to analyze categorical variables. Normality of the data was tested using the Kolmogorov–Smirnov normality analysis. The independent two-sample t-test was used to compare two normally distributed variables. A Pearson test was used to determine correlation of the variables, and p < 0.05 probability values were considered statistically significant.
Results
The groups were composed of 13 men and 43 women in the amalgam group, 18 men and 26 women in the control group (p = 0.12). The median (minimum–maximum) of ages in the amalgam and control groups were 32 (17–55) years and 29.50 (16–53) years, respectively (p = 0.64). The mean BMI in the amalgam and control groups were 23.54 ± 4.21 kg/m2 and 22.93 ± 3.92 kg/m2, respectively (p = 0.45). There were no statistically significant differences between the groups in terms of age, sex, or BMI (Table 1).
Features of the amalgam and control groups.
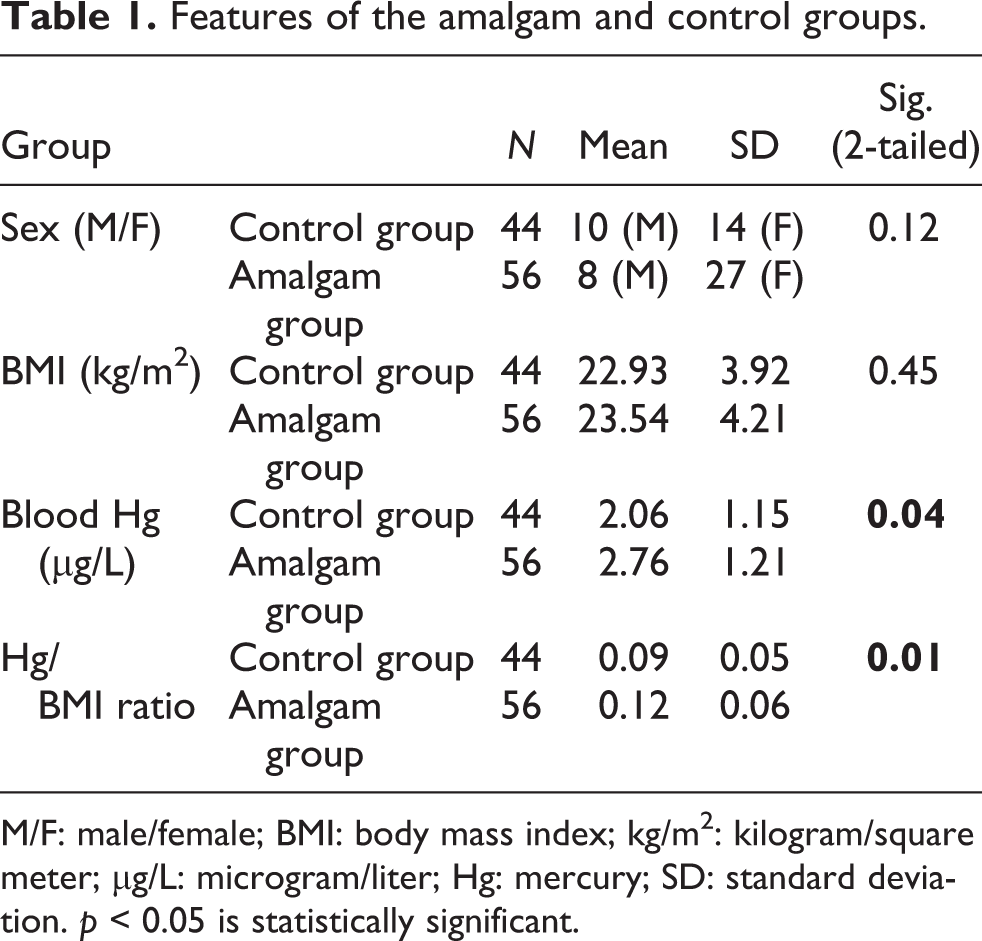
M/F: male/female; BMI: body mass index; kg/m2: kilogram/square meter; µg/L: microgram/liter; Hg: mercury; SD: standard deviation. p < 0.05 is statistically significant.
The number of amalgam dental fillings varied from a minimum of 1 to a maximum of 5, and the mean of amalgam dental fillings number was 2.77 ± 0.25 in the amalgam group. The mean values of blood Hg in the amalgam and control groups were 2.76 ± 1.21 µg/L and 2.06 ± 1.15 µg/L, respectively (p = 0.04; Table 1, Figure 5). Hg/BMI ratios in the amalgam and control groups were 0.12 ± 0.06 and 0.09 ± 0.05, respectively (p = 0.01; Table 1, Figure 6).
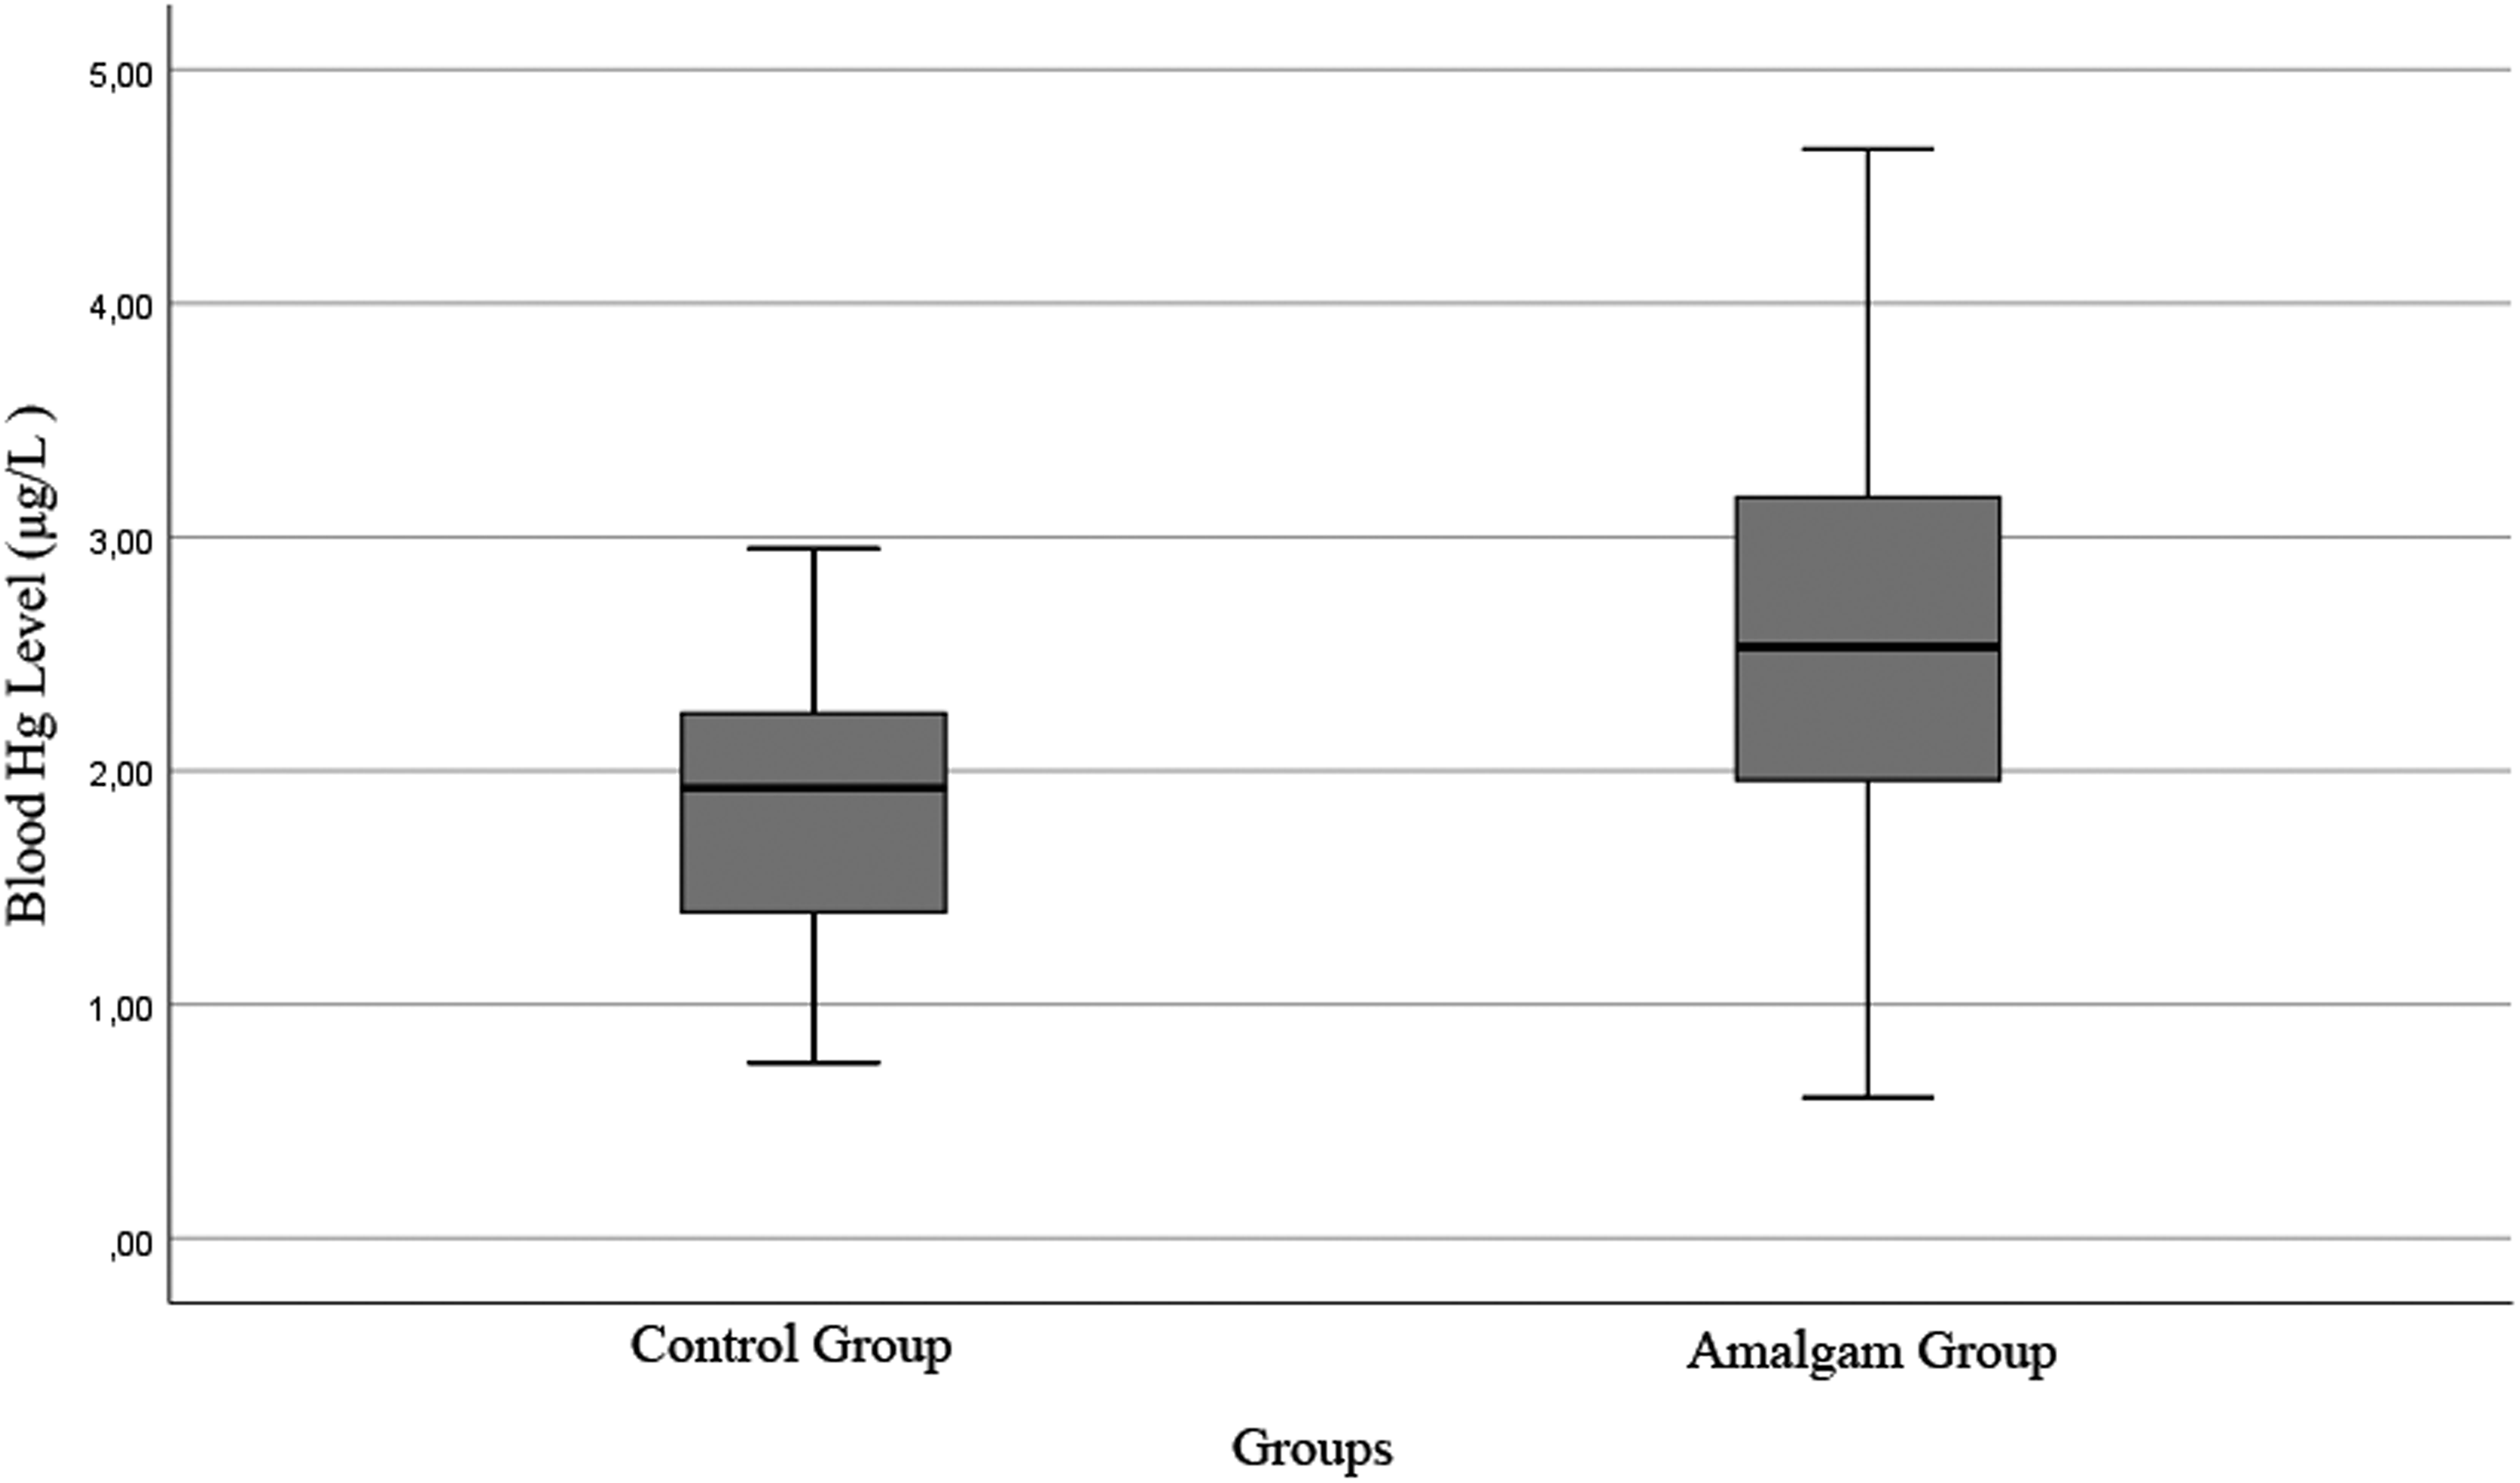
Boxplot distribution of blood Hg level of the groups in microgram/liter (µg/L). Hg: mercury.

Boxplot distribution of Hg/BMI ratios of the groups. Hg/BMI: mercury/body mass index.
Since SD-OCT measurements of the right and left eyes were highly correlated and provided similar results, only the results of the right eye are discussed. This is to decrease the complexity of the tables. Retrograde degeneration from lesions into the optic nerves is associated with neuronal loss, lower macular volume, and peripapillary RNFL thinning. 8 Therefore, we used macular layer volumes and peripapillary RNFL thicknesses in our evaluation. The volumes of GCL and IPL were significantly decreased in the amalgam group as compared to the control group (p = 0.02; Table 2). There was no statistically significant difference between the two groups in terms of the volumes of INL, OPL, or ONL, and the thickness of RNFL or CT (Table 2). A positive correlation was found between the number of amalgam dental fillings with Hg levels and Hg/BMI ratio (p = 0.001) in the amalgam group. A negative correlation was found between IPL volumes with blood Hg levels (p = 0.04) and Hg/BMI ratio (p = 0.02; Table 3) in the amalgam group.
Comparison of the thicknesses of the RNFL, the volume of retinal layers, and the thicknesses of choroids in the amalgam and control groups.

RNFL: retinal nerve fiber layer; GCL: ganglion cell layer; IPL: inner plexiform layer; INL: inner nuclear layer; OPL: outer plexiform layer; ONL: outer nuclear layer; SD: standard deviation; µm: micrometer; mm3: cubic millimeters. p < 0.05 is statistically significant.
Pearson correlation analysis of variables in the amalgam group.

Hg: mercury; RNFL: retinal nerve fiber layer; GCL: ganglion cell layer; IPL: inner plexiform layer; INL: inner nuclear layer; OPL: outer plexiform layer; ONL: outer nuclear layer; µm: micrometer; mm3: cubic millimeters; µg/L: microgram/liter; BMI: body mass index. p < 0.05 is statistically significant.
Discussion
Amalgam has always been a popular choice in dental restorations. It has been used in dentistry due to its low cost, ease of application, strength, durability, and bacteriostatic effects. 1,14 However, there are conflicting results about amalgam-related chronic Hg neurotoxicity. 2 In several studies, blood Hg concentrations were found to be high and related to the presence and number of amalgam fillings. 15,16 On the other hand, there are studies in which the blood Hg level in patients with amalgam tooth filler is not different from the control group. 14,17 In our study, we found higher blood Hg levels and a positive correlation between blood Hg levels and the number of amalgam fillings in the amalgam group. In a critical review, Ekstrand et al. 4 suggested that the blood Hg concentrations of the amalgam-filled individuals were significantly lower than the highest acceptable Hg levels. The World Health Organization (WHO) 18 considers 15–20 µg/L to be the highest acceptable level for safe blood Hg levels. However, the WHO also points out that there is no safe level for Hg vapor in humans. 18 Guzzi and coworkers 19 studied Hg levels in the brain tissues of cadavers who had amalgam fillings. They found the highest content levels of Hg associated with amalgam surfaces and total Hg levels approaching or exceeding 300 µg/L in some cases. Animal studies support such findings. 20
The visual system, which can be considered as an extension of the brain, is sensitive to Hg neurotoxicity. Hg can cause ocular symptoms such as partial or complete loss of vision, visual field constriction, contrast sensitivity, or color vision loss. The retina, therefore, is affected by Hg neurotoxicity and implicated in the cascade of visual symptoms. 21 Mela et al. 6 studied Hg neurotoxicity in methylmercury-exposed fish retinas and found dose-dependent Hg deposits in the photoreceptor layer, the IPL, and the OPL. They commented that Hg can pass through the retinal barrier and may accumulate in the retina as a result of sub-chronic exposure. In another study, abundant Hg deposits were found in GCL, IPL, INL, OPL, ONL, and the photoreceptor layer. They demonstrated that Hg deposits are more concentrated in the center of the retina where the SD-OCT scans are performed. 22 However, these studies were conducted in sub-chronic conditions and with high doses of methylmercury. 6,22 But amalgam neurotoxicity is related to chronic low-dose elemental Hg toxicity. Warfvinge and Bruun 3,11 studied Hg neurotoxicity on monkeys’ retinas which were exposed to Hg vapor. They detected Hg deposits mainly in the optic nerves, retinal pigment epithelium, IPLs, vessel walls, and GCL. Our findings are consistent with these works in that we found decreases in the volume of GCL and IPL layers. However, a negative correlation was found only between the volume of IPL with blood Hg levels and Hg/BMI ratios.
Plexiform layers are synaptic sites in the retina. The IPL is the second synaptic layer in which connections among bipolar, amacrine, horizontal, and ganglion cells take place. Hg affects synaptic transmissions and impairs communication between the retinal cells. 23 Bonci et al. 24 demonstrated that apoptotic process in the GCL results in decreases of amacrine, horizontal, and bipolar cells in the retinas of Hoplias malabaricus after exposure to methylmercury. We suggest that the decrease of the GCL layer could reflect the death of these cells. Glutamate is accepted as a potential mediator of inorganic Hg neurotoxicity. 25 It has been shown to act as a neurotoxin which exerts its toxic effects predominantly on GCL, leading to cell death. 26 Glutamate receptors are expressed in high density throughout the IPL in the primate retina. 27 Therefore, it is expected that GCL–IPL complex is more affected from Hg-related glutamate neurotoxicity. Chronic low exposures to Hg can induce β-amyloid secretions. 28 Subretinal drusen formation increases the risk of age-related macular degeneration and accumulation of β-amyloid peptides plays an important role in retinal drusen formation. 29
Ekinci et al. 30 evaluated Hg toxicity by optical coherence tomography in industrial Hg battery workers. They found significant decreases in the thicknesses of RNFL, macular retinas, and choroids. They also found a negative correlation between blood Hg levels and thicknesses of RNFL, macula, and choroids. We evaluated macular layers instead of macular thicknesses. Our results showed no statistically significant differences in RNFL and CT, but they did show significant differences in the volumes of GCL and IPL. We found a negative correlation between IPL with Hg and Hg/BMI ratios. The most sensitive parameter of Hg neurotoxicity was found to be the volume of the IPL layer. The decreased volume of the GCL–IPL complex was observed in many neurodegenerative diseases such as Parkinson’s and Alzheimer’s diseases. In these studies, the relationship between the severity and duration of the disease and the GCL–IPL volumes thinning was determined. 9,10 A relationship was also found between the dental amalgam fillings and the risk and severity of the diseases. 28,31
This study has limitations. The number of subjects was small. Visual field examination, color vision, and electroretinogram tests were not performed. The comparison of OCT measurements with such tests can give valuable information about amalgam-related neurotoxicity. Since the thinning of GCL–IPL complex occurs before the visual field change, monitoring the thickness of macular GCL–IPL complex may be effective in early detection of functional impairment. 32 We did not evaluate the levels of urine Hg and the correlation between urine Hg level and SD-OCT findings. The surfaces of the amalgam occlusal areas were not determined, which can affect blood Hg levels.
In conclusion, patients with amalgam tooth fillings had higher blood Hg levels than those who did not. Hg0 in amalgam dental fillings can cause chronic retinal neurotoxicity. SD-OCT can be an objective method for evaluating amalgam-related neurotoxicity. The volume of GCL–IPL complex can be a useful parameter for evaluating amalgam-related neurotoxicity. However, further research is needed in this regard to determine repeatability, specificity, and sensitivity.
Footnotes
Declaration of Conflicting Interests
The author(s) declared no potential conflicts of interest with respect to the research, authorship, and/or publication of this article.
Funding
The author(s) disclosed receipt of the following financial support for the research, authorship, and/or publication of this article: This work was supported by the Scientific Research Projects Unit of Adıyaman University with the project number TIPFMAP/2015-0013.