
Abstract
ATP-sensitive potassium channels (KATP) may mediate a potential neuroprotective role in Alzheimer’s disease (AD). Given that exposure to Aβ1-42 in cultured primary cholinergic neurons for 72 h significantly upregulates the expression of KATP subunits Kir6.2/SUR1, we aim to study the underlying signal transduction mechanisms that are involved in Aβ1–42-induced upregulation of KATP subunits Kir6.2/SUR1. In the present study, we first identified the primary cultured rat cortical and hippocampal neurons using immunocytochemistry. 0.5 μM NF-κB inhibitor SN-50, 2 μM p38MAPK inhibitor SB203580 or 2 μM PKC inhibitor Chelerythrine chloride (CTC) were then added in three separate groups, followed by 2 μM Aβ1–42 30 min later in all 3 groups. Western Blot was performed 72 h later to detect the expression of KATP subunits Kir6.2/SUR1. We found that Aβ1–42 significantly increased the level of KATP subunits Kir6.2/SUR1 expression at 72 h when compared with the control group (p < 0.05). However, when compared with the Aβ1–42 group, the level of KATP subunits Kir6.2/SUR1 expression at 72 h significantly decreased in the SN50 + Aβ1–42 group, SB203580 + Aβ1–42 group, and the CTC + Aβ1–42 group (p < 0.05). Our findings suggest that the NF-κB, p38 MAPK, and PKC signal pathways are partially involved in the upregulation of KATP subunits Kir6.2/SUR1 expression induced by Aβ1–42 cytotoxicity in neurons, which supports a potential theoretical basis of targeting these signal pathways in the treatment of AD.
Keywords
Introduction
Alzheimer’s disease (AD) is the most common neurodegenerative disease in elderly people and is characterized by hallmark pathological amyloid plaques (Aβ). 1 Considerable evidences show that Aβ could lead to membrane depolarization, mitochondrial dysfunction, and oxidative stress, which could further stimulate the generation and accumulation of Aβ. 2,3 Based on these findings, mitochondrial ATP-sensitive potassium channels (KATP) openers activate potassium channels and have been shown to protect cultured neurons against toxicity induced by Aβ. 4
KATP channels are widely distributed in different brain regions. The different subunits composition within KATP channels determines the brain regions’ susceptibility to hypoxia, oxidative stress, toxicity, and blood glucose metabolism. 5 In this regard, previous studies have demonstrated that KATP channels with the Kir6.2/SUR1 subunit were upregulated by Aβ1–42 and ATP. 4,6 However, the underlying pathophysiology remains unclear. Given that signaling pathways are implicated in the pathogenesis of AD, further studies focusing on the role of Aβ1–42 in upregulating the signal transduction of KATP channels with the Kir6.2/SUR1 subunit will be paramount as further insight in the signaling transduction pathway may unravel a potential therapeutic target in AD. 7
NF-κB, p38 MAPK and protein kinase C (PKC) signaling pathways have been linked to AD pathophysiology. The NF-κB signaling pathway is shown to be upregulated in AD, 8 while analysis of postmortem AD tissues shows an increase level of p38 MAPK phosphorylation associated with Aβ plaques and neurofibrillay tangles (NFTs). 9,10 In addition, oligomeric Aβ can also disrupt the PKC signaling pathway. 11
In the present study, we aim to investigate the role of NF-κB, p38 MAPK, and PKC signaling pathways in the upregulation of KATP subunits Kir6.2/SUR1 expression by Aβ1–42 in primary cultured rat cortical and hippocampal neurons.
Materials and methods
Ethics statement
The rats were housed at the Institutional Animal Care and Use Committee (IACUC), and the Ethics Committee of Shandong Provincial Qianfoshan Hospital approved the study. Wistar rats (birth within 24 h) were housed under controlled temperature (21°C) and light conditions (12-h light/dark cycle) with free access to water and standard diet.
Reagents
Sources of the reagents used in this study were as follow: Poly-l-lysine, Aβ1–42, cytarabine, SN50, SB203580, chelerythrine chloride (CTC; Sigma, St. Louis, MO, USA); Neurobasal medium, fetal bovine serum (Gibco-BRL, USA); B27-supplement (Invitrogen, California, USA); goat anti-ChAT, rabbit anti-kir6.2, rabbit anti-SUR1, and GAPDH antibodies (Santa Cruz, California, USA); and the ECL light-emitting liquid (Millipore, Billerica, MA, USA).
Cell cultures
Disinfection of the Wistar rats was performed under sterile conditions using 75% ethanol. The cortex and hippocampus were removed and isolated from brains on ice while the meninges were removed by micro-tweezers under a microscope. Using D-hanks cleaning, the brain tissues were cut into pieces and digested for 10 min using 0.125% trypsin. Subsequently, digestion was terminated by Dulbecco’s Modified Eagle Medium (DMEM) (containing 10% fetal bovine serum), filtered (300 mesh), centrifuged (1000 r/min, 5 min), dispersed and mixed by DMEM. The cell suspension was seeded in 60 mm petri dishes (poly-l-lysine pre-coated), cultured (incubator, 37°C, 95% air and 5% CO2), and after 24 h, replaced with serum-free medium (98% Neurobasal medium + 2% B27 + 1% the two antibiotics). The density of the cells was 3.0 × 10⁶ cells/mL. The cells were treated with cytarabine (5 μmol/L) and cultured for 3–5 days to inhibit the proliferation of gliocyte.
Identification of cholinergic neurons by immunocytochemistry
Choline acetyl transferase (Choactase, ChAT) is a sulfur-based protein with a molecular weight of 65 kDa. ChAT is a presynaptic choline synthesis enzyme which can accurately determine the cholinergic neurons with ChAT antibody as a marker. In this study, cells were plated in glass coverslips and pre-coated with poly-l-lysine. The cells were grown for 7 days in proliferation growth medium, formaldehyde fixed (4% paraformaldehyde, 4°C, 30 min), and washed with PBS (3 × 5 min). Goat anti-ChAT (1:100) was applied overnight (4°C), washed with PBS, biotinylated secondary IgG (1:200) applied for 1 h, room temperature for 30 min, and washed with PBS. The cells were dripped with SABC for 20 min, washed with PBS four times and visualized with DAB for 5 min, stained with hematoxylin. The results were then observed under a light microscope (IM50, Leica, German), and 10 random 20 × 20 fields were observed under the microscope. The cytoplasm of ChAT positive neurons was stained brown (Figure 1).

Identification of cholinergic neurons by choline acetyl transferase immunocytochemistry (20 × 20). Scale bar = 20 μM.
Experimental treatments
Aβ1–42 (0.1 mg) was dissolved in dimethylsulfoxide (DMSO) with a concentration of 0.5 mol/L and diluted with PBS (pH 7.4), incubated (37°C, 72 h), and stored at 4°C. Stocks were diluted in serum-free medium prior to experiments and the final concentration of DMSO in cell cultures did not exceed 0.1% as DMSO in this concentration will not have harmful effects to the cells. The cells were then randomly divided into four groups: the control group, the Aβ1–42 group, the Aβ1–42 + SN50/SB203580/CTC group, and the SN50/SB203580/CTC group and cultured for 7 days. The control group was treated with equal volume PBS and culture medium; the Aβ1–42 group was treated with Aβ1–42 (2 μM) 4 ; Aβ1–42 + SN50/SB203580/CTC group was treated with SN50(0.5 μM)/SB203580(2 μM)/CTC(2 μM), followed by the addition of Aβ1–42 (2 μM) 30 min later; SN50/SB203580/CTC group was treated with SN50(0.5 μM)/SB203580 (2 μM)/CTC(2 μM), respectively. Western blot analysis was then carried out in all four groups after 72 h.
Western blot analysis
Cells were collected, washed in ice-cold phosphate buffered saline, and lysed in ice in 250 μL lysis buffer (50 mmol/L Tris-HCl pH 8.0, 150 mmol/L NaCl, 0.02% sodium vandate, 0.1% SDS, 0.5% deoxycholic acid, 100 μg/mL PMSF, 0.2 μg/mL leupeptin, 1% NP-40) per dish. After incubation in ice for 20 min, cell lysates were centrifuged (10,000 × g for 10 min at 4°C) and the protein concentrations in the extracts were determined by bicinchoninic acid (BCA) Protein Assay Kit (Pierce, Rockford, Illinois, USA). Forty micrograms protein samples undergone sodium dodecyl sulphate–polyacrylamide gel electrophoresis (SDS-PAGE) and transferred to polyvinylidene fluoride (PVDF) membrane, blocked with 5% skim milk for 1 h, and closed overnight with primary antibody (rabbit anti-rat Kir6.2 polyclonal antibody (1:500) or rabbit anti-rat SUR1 (1:500) (4°C, shaker)). The PVDF was washed 3 times in TBST (TBS with 0.05% v/v Tween-20) at room temperature and incubated with horseradish peroxidase-conjugated secondary antibody diluted in TBST (1:3,000) for 1 h at room temperature followed by washing. Signal detection was performed with an enhanced chemiluminiscence kit and GAPDH as an internal reference. Analysis of the integral value of the optical density was then performed using an NIH image (1.34) analysis software.
Statistical analysis
Quantitative analyses of the Western blots were performed with the Lecca Qwin Image program by calculating the relative density of the immunoreactive bands after acquisition of the blot image with a Nikon CCD video camera (Nikon Instruments Co, Ltd, Japan) module. Results were expressed as means ± standard deviation. The statistical analyses were performed using one-way analysis of variance, followed by a two-tailed student’s t test. Multiple comparison test was performed where appropriate. Statistical analysis was performed by using the SAS, version 9.4 software (SAS Institute Inc.). A value of p < 0.05 was considered significant.
Results
The effect of NF-κB inhibitor SN50 on the subunit SUR1 of neural KATP expression is induced by Aβ1–42
Western blot results showed that Aβ1–42 significantly increased the level of KATP subunit SUR1 expression at 72 h compared with the control group (p < 0.05). Compared with Aβ1–42 group, the level of KATP subunit SUR1 expression decreased significantly in both SN50 + Aβ1–42 and SN50 groups (p < 0.01). When compared with the control group, Aβ1–42 group, and SN50+Aβ1–42 group separately, the level of KATP subunit SUR1 expression decreased significantly in the SN50 group (p < 0.01; Figure 2).
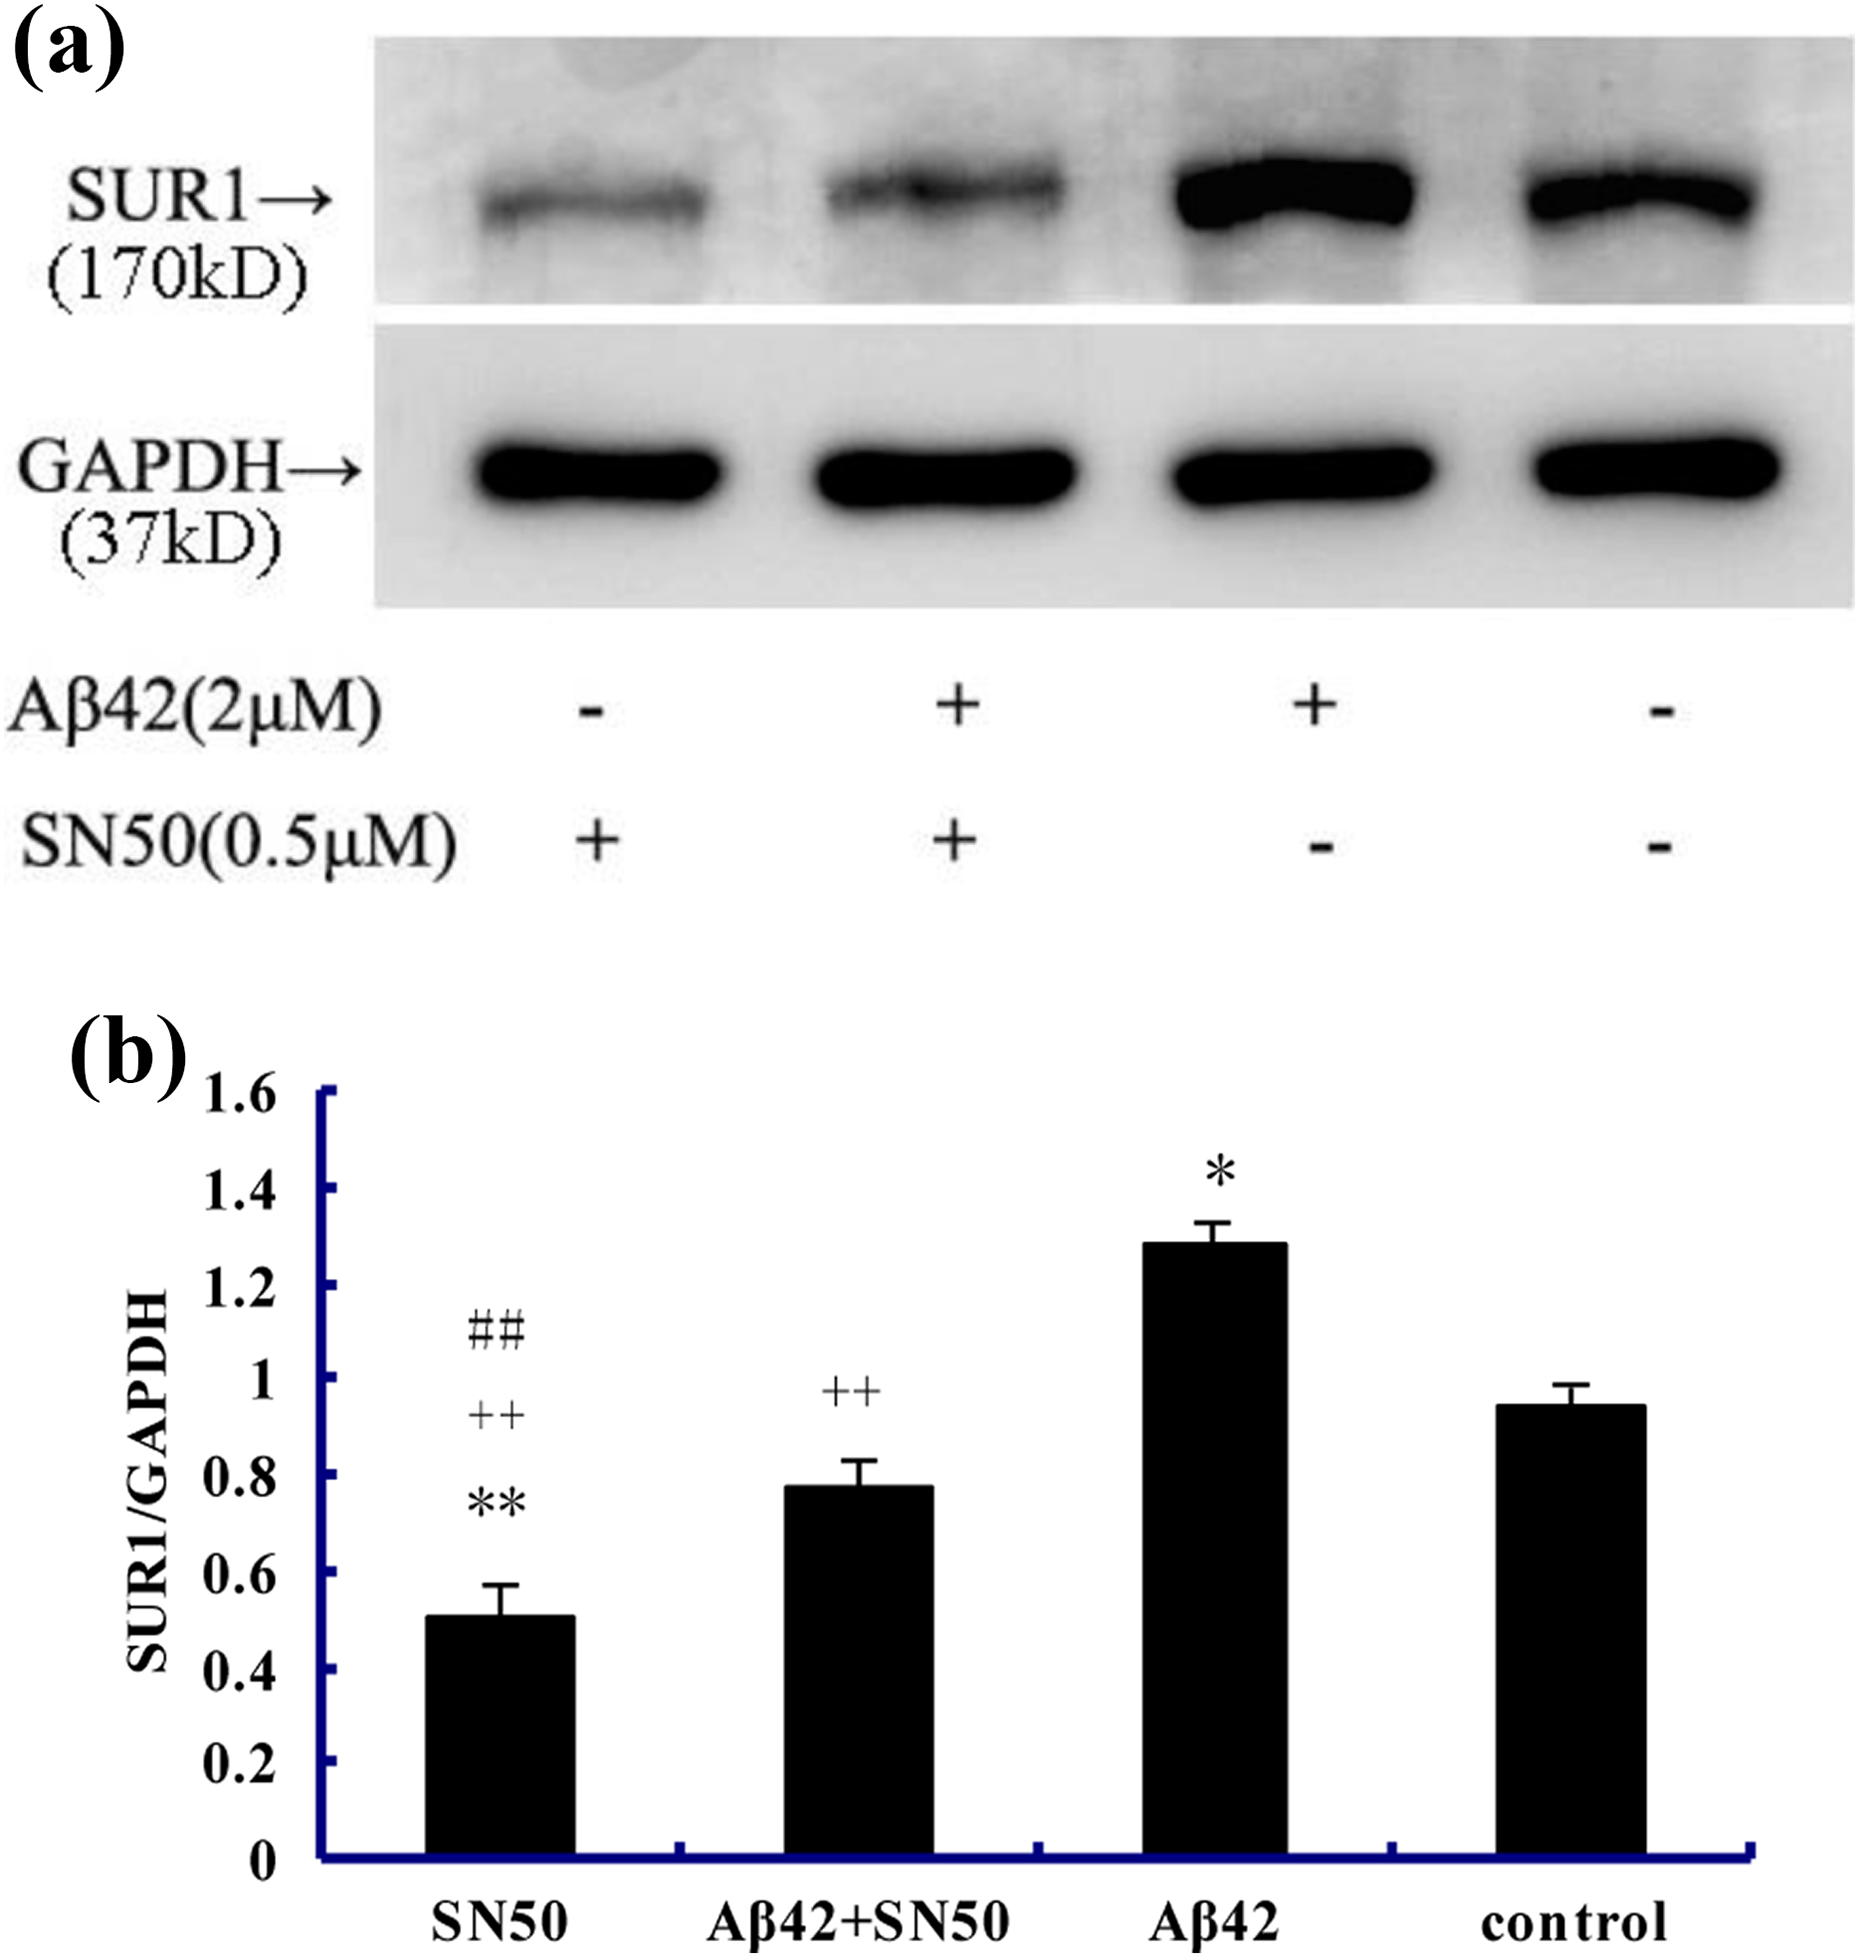
(a) Western blot showed that the effect of control group, Aβ1–42 group, SN50 + Aβ1–42 group, and SN-50 group on the subunit SUR1 expression in primary cultured neurons for 72 h. (b) Protein levels were determined by densitometric analysis of Western blots and were normalized to GAPDH; values are means ± SD of three independent experiments. *p < 0.05 or **p < 0.01 denote Aβ1–42 or SN50 versus control; ++p < 0.01denotes Aβ1–42 + SN50 or SN50 versus Aβ1–42; ##p < 0.01 denotes SN50 versus SN50 + Aβ1–42 group, separately (n = 3).
The effect of NF-κB inhibitor SN50 on the subunit Kir6.2 of neural KATP expression is induced by Aβ1–42
Western blot results showed that Aβ1–42 significantly increased the level of KATP subunit Kir6.2 expression at 72 h compared with the control group (p < 0.05). Compared with Aβ1–42 group, the level of KATP subunit Kir6.2 expression decreased significantly in both SN50 + Aβ1–42 and SN50 groups (p < 0.01 and p < 0.05). When compared with both SN50 + Aβ1–42 and control groups, there is no difference in the level of KATP subunit Kir6.2 expression in the SN50 group (p > 0.05; Figure 3).

(a) Western blot showed that the effect of control group, Aβ1–42 group, SN50 + Aβ1–42 group, and SN-50 group on the subunit Kir6.2 expression in primary cultured neurons for 72 h. (b) Protein levels were determined by densitometric analysis of Western blots and were normalized to GAPDH; values are means ± SD of three independent experiments. *p < 0.05 denotes Aβ1–42 group versus control; +p < 0.05 or ++p < 0.01 denote SN50 or Aβ1–42 + SN50 group versus Aβ1–42 group, separately (n = 3).
The effect of p38 MAPK inhibitor SB203580 on the subunit SUR1 of neural KATP expression is induced by Aβ1–42
Western blot results showed that Aβ1–42 significantly increased the level of KATP subunit SUR1 expression at 72 h compared with the control group (p < 0.05). Compared with Aβ1–42 group, the level of KATP subunit SUR1 expression decreased significantly in both SB203580 + Aβ1–42 and SB203580 groups (p < 0.05). When compared with the control and SB203580 + Aβ1–42 group separately, there is no difference in the level of KATP subunit SUR1 expression in the SB203580 group (p > 0.05; Figure 4).

(a) Western blot showed that the effect of control group, Aβ1–42 group, SB203580 + Aβ1–42 group, and SB203580 group on the subunit SUR1 expression in primary cultured neurons for 72 h. (b) Protein levels were determined by densitometric analysis of Western blots and were normalized to GAPDH; values are means ± SD of three independent experiments. *p < 0.05 denotes Aβ1–42 group versus control; +p < 0.05 denotes Aβ1–42 + SB203580 group or SB203580 group versus Aβ1–42 group, separately (n = 3).
The effect of p38 MAPK inhibitor SB203580 on the subunit Kir6.2 of neural KATP expression is induced by Aβ1–42
Western blot results showed that Aβ1–42 significantly increased the level of KATP subunit Kir6.2 expression at 72 h compared with the control group (p < 0.05). Compared with Aβ1–42 group, the level of KATP subunit Kir6.2 expression decreased significantly in both SB203580 + Aβ1–42 and SB203580 groups (p < 0.05 and p < 0.01, respectively). When compared with both control group and SB203580 + Aβ1–42 group separately, the level of KATP subunit Kir6.2 expression decreased significantly in the SB203580 group (p < 0.05; Figure 5).

(a) Western blot showed that the effect of control group, Aβ1–42 group, SB203580 + Aβ1–42 group, and SB203580 group on the subunit Kir6.2 expression in primary cultured neurons for 72 h. (b) Protein levels were determined by densitometric analysis of Western blots and were normalized to GAPDH; values are means ± SD of three independent experiments. *p < 0.05 denotes Aβ1–42 group or SB203580 group versus Control; +p < 0.05 or ++p < 0.01 denote Aβ1–42 + SB203580 group or SB203580 group versus Aβ1–42 group, #p < 0.05 denotes SB203580 group versus Aβ1–42 + SB203580 group, separately (n = 3).
The effect of PKC inhibitor CTC on the subunit SUR1 of neural KATP expression is induced by Aβ1–42
Western blot results showed that Aβ1–42 significantly increased the level of KATP subunit SUR1 expression at 72 h compared with the control group (p < 0.05). Compared with Aβ1–42 group, the level of KATP subunit SUR1 expression decreased significantly in both CTC + Aβ1–42 and CTC groups (p < 0.05 and p < 0.01, respectively). When compared with both control and CTC + Aβ1–42 groups, the level of KATP subunit SUR1 expression decreased significantly in the CTC group (p < 0.05; Figure 6).

(a) Western blot showed that the effect of control group, Aβ1–42 group, CTC + Aβ1–42 group, and CTC group on the subunit SUR1 expression in primary cultured neurons for 72 h. (b) Protein levels were determined by densitometric analysis of Western blots and were normalized to GAPDH; values are means ± SD of three independent experiments. *p < 0.05 denotes Aβ1–42 or CTC versus control; +p < 0.05 or ++p < 0.01 denotes Aβ1–42 + CTC or CTC versus Aβ1–42;#p < 0.05 denotes CTC versus Aβ1–42 + CTC, separately (n = 3).
The effect of PKC inhibitor CTC on the subunit Kir6.2 of neural KATP expression is induced by Aβ1–42
Western blot results showed that Aβ1–42 significantly increased level of KATP subunit Kir6.2 expression at 72 h compared with the control group (p < 0.05). Compared with Aβ1–42 group, the level of KATP subunit Kir6.2 expression decreased significantly in both CTC + Aβ1–42 and CTC groups (p < 0.01). Compared with CTC + Aβ1–42 group, the level of KATP subunit Kir6.2 expression increased significantly in the CTC group (p < 0.05). When compared with the control group, there is no difference in the level of KATP subunit Kir6.2 expression in the CTC group (p > 0.05; Figure 7).

(a) Western blot showed that the effect of control group, Aβ1–42 group, CTC + Aβ1–42 group, and CTC group on the subunit Kir6.2 expression in primary cultured neurons for 72 h. (B) Protein levels were determined by densitometric analysis of Western blots and were normalized to GAPDH; values are means ± SD of three independent experiments. *p < 0.05 denotes Aβ1–42 group or Aβ1–42 + CTC group versus control; ++p < 0.01 denotes CTC or Aβ1–42 +CTC versus Aβ1–42 group; #p < 0.05 denotes CTC group versus Aβ1–42 + CTC group, separately (n = 3).
Discussion
Aβ-induced neurotoxicity plays a key role in the pathogenesis of AD. 12 Evidence suggests that excessive oxidative stress and free radicals toxic effects constitute one of the mechanisms of Aβ-induced neurotoxicity leading to the development of AD. 13 In a healthy individual, the production and elimination of free radicals are normal physiological processes which maintain a dynamic equilibrium. However, when excessive oxidative stress is induced by Aβ, this may eventually break this balance, leading to cell death mainly via the apoptotic pathway. 14 Aβ causes modification of the lipid membrane and protein oxidation, increases reactive oxygen species (ROS), and decreases mitochondrial function and ATPase activity. 15 These lead to energy metabolism and mitochondrial membrane potential dysfunctions and decreased cell viability. On the other hand, studies also show that cyclosporin A, erythropoietin, and ATP-sensitive potassium channel opener diazoxide may exert protective effects on Aβ-induced neurotoxicity. 16,17
KATP is a multi-protein complex composed of inward rectifier potassium channel with two different subunits: Kir6.1/Kir6.2 and SUR1/SUR2 and the formation of heterogeneous octamer to 1:1. KATP plays an important role within the plasma membrane by reducing the excitability of cardiac cells, neurons, and other excitable cells. In the mitochondria, KATP (Mito-KATP) is involved in the regulation of the mitochondrial membrane potential (ΔΨm) and regulates the generation of ATP and ROS. 18 Our previous study in cultured primary rat cholinergic neurons showed that exposure to Aβ1–42 for varying durations could induce differential increase of KATP subunits expression while at the same time inhibit KATP channel ion currents. Importantly, preactivation of mitoKATP by diazoxide could reverse above changes. 19 In addition, exposure to Aβ1–42 for 24 h did not affect the expression of KATP subunits Kir6.2/SUR1. 5,20
Our results showed that exposure to 2 μM Aβ1–42 for 72 h significantly increased the expression of KATP subunits Kir6.2 and SUR1 in primary cultured neurons compared with the control group. One possible mechanism is the persistence of oxidative stress induced by Aβ1–42 which could lead to mitochondrial dysfunction, cell metabolism disorder, and decreased intracellular ATP level. Given that the KATP subunits Kir6.2/SUR1 are especially sensitive to oxidative stress, 6 the expression of Kir6.2/SUR1 subunits may significantly increase as the levels of intracellular ATP decrease. In addition, Aβ1–42 may induce neuroinflammation by activating glial cells which further stimulate the expression of Kir6.2/SUR1 via nonspecific signal pathways. The increased activation and protein expression of the Kir6.2/SUR1 subunit may be a physiological response to maintain normal cell membrane potential and spontaneous electrical activity to prevent Aβ1–42 cytotoxicity.
NF-κB is a nuclear transcription factor in a variety of cells within the human body. Activated NF-κB plays a key role in the pathophysiology of diseases by regulating gene expression, immune response, and apoptosis signaling when translocated to the nucleus. 21 Studies have reported that Aβ activates NF-κB expression in the neurons. 8,22 Furthermore, Mattson et al. showed the anti-apoptotic mechanism of NF-κB by inducing the production of manganese superoxide dismutase (Mn-SOD) which inhibited the formation of peroxynitrite and membrane lipid peroxidation in AD. 23
In this study, exposure to Aβ1–42 for 72 h significantly increased the expression of KATP subunits Kir6.2/SUR1 when compared with the control group. We demonstrated this using SN50, a NF-κB inhibitor with 41 amino acid residues of the polypeptide. SN50 contains the p50 nuclear localization sequence that penetrates the cell and specifically blocks the shift of NF-κB from the cytoplasm to the nucleus and hence inhibits NF-κB DNA binding activity. In the SN50 + Aβ1–42 group, the levels of KATP subunits Kir6.2/SUR1 expression significantly decreased compared with the Aβ1–42 group, indicating that SN50 significantly decreased Aβ1–42-induced Kir6.2/SUR1 protein expression level. One possible mechanism is that SN50 interferes with NF-κB by inhibiting NF-κB nuclear translocation, thereby affecting the subunits Kir6.2/SUR1 mRNA transcription expression induced by Aβ1–42. NF-κB signal pathway is also involved in the increase in expression of KATP Kir6.2/SUR1 subunits induced by Aβ in neurons.
However, the KATP subunit SUR1 expression in SN50 group significantly decreased when compared with the control group, Aβ1–42 group and SN50 + Aβ1–42 group. This finding suggests that the inhibitory effect of SN50 on the increased expression of KATP subunit SUR1 induced by Aβ1–42 is nonspecific. Compared with both SN50 + Aβ1–42 and control groups, there is no difference in the expression of the KATP subunit Kir6.2 in the SN50 group. This suggests that the inhibitory effect of SN50 on the increased expression of subunit Kir6.2 induced by Aβ1–42 is specific. Therefore, we conclude that the NF-κB signal pathway is partially involved in the increased expression of the KATP subunits Kir6.2/SUR1 induced by Aβ in neurons.
The MAPKs are a class of serine/threonine kinases that responds to extracellular signals such as growth factors, mitogens, and cellular stress that mediates proliferation, differentiation, and cell survival in mammalian cells. The p38 MAPK is a member of MAPKs within mammalian cells. 24 p38 MAPK is located in the cytoplasm during normal physiological conditions and can be quickly transferred to the nucleus when activated to trigger transcription factors, gene expression, and cell-delayed death. 25 Pro-inflammatory cytokines and stress stimuli can activate p38 MAPK. 26,27 It is shown that Aβ is able to stimulate glial cell cultures and activate p38 MAPK and MK2, hence upregulating the production of inflammatory cytokines such as IL-1β and TNF-α. 28 –30 In this regard, an oligomeric Aβ synthetic peptide strongly stimulates p38 MAPK kinase. 31 Due to overstimulation of the Aβ-stimulated glial cells, an increased release of inflammatory mediators lead to neuroinflammatory and neurotoxic effects on surrounding neurons 32 and the loss of neurons observed in neurodegenerative diseases. In human AD brain and transgenic mouse models, activated p38α MAPK has been reported to localize in areas where NFTs, amyloid plaques, and glial cells are present under pathophysiological conditions. 9
The selective p38 MAPK inhibitor SB203580 plays a major role in T160 of the ATP-binding active site, 33 by causing the p38 MAPK to lose a kinase activity. As a result, the p38 MAPK is unable to bind with ATP. It is also known that the activities of p38α and p38β can be inhibited readily by SB203580 by binding to the ATP binding pocket of p38 MAPK. While this inhibits its ability to undergo autophosphorylation, the capacity of p38 MAPK to be phosphorylated by upstream MAPKK is not affected. Taking advantage of this chemical property, SB203580 has been used to identify p38 MAPK autophosphorylation in cultured cells in several prior published studies. 34,35 In the SB203580 + Aβ1–42 group, the expression of the KATP subunits Kir6.2/SUR1 significantly decreased compared with the Aβ1–42 group, which indicates that SB203580 significantly decreased Aβ1–42-induced Kir6.2/SUR1 protein expression level. The possible mechanism is the proliferation of surrounding glial cell activated by Aβ1–42, which releases inflammatory products and activation of p38 MAPK. The p38 MAPK is then transferred quickly to the nucleus, activating the transcription factor, and causing the increase in mRNA expression of the KATP subunits Kir6.2/SUR1. This finding suggests that activated p38 MAPK not only has a neuroinflammatory effect that leads to the increase of Kir6.2/SUR1 mRNA expression but also has a neurotoxic effect on surrounding neurons. However, SB203580 occupies the ATP binding sites that result in p38 MAPK losing its ability to bind with ATP, thereby not only weakening the Aβ cytotoxicity action but also significantly decreasing Aβ1–42-induced Kir6.2/SUR1 protein expression level. Therefore, the p38 MAPK signal pathway is also involved in the increased expression of KATP subunits Kir6.2/SUR1 induced by Aβ1–42 cytotoxicity in neurons.
In the SB203580 group, the expression of the KATP subunits Kir6.2 significantly decreased compared with the control, Aβ1–42, and SB203580 + Aβ1–42 groups separately, indicating that the inhibitory effect of SB203580 on the increased expression of subunit Kir6.2 induced by Aβ1–42 is nonspecific. However, when compared with both control and SB203580 + Aβ1–42 groups, there is no difference in the expression of the KATP subunit SUR1 in the SB203580 group, indicating that the inhibitory effect of SB203580 on the increased expression of KATP subunit SUR1 induced by Aβ1–42 is specific. Therefore, we conclude that p38 MAPK signal pathway is partially involved in the increased expression of the KATP subunits Kir6.2/SUR1 induced by Aβ in neurons.
PKC is a phospholipid-dependent serine/threonine kinase and consists of at least 12 isoenzymes. 36 PKC is distributed in the cell membrane and cytoplasm 37 and exists in an inactive form in the cytoplasm when in the resting state. PKC will shift to the cell membrane when activated during stress. Numerous studies have suggested that phorbol 12-myristate 13-acetate is a nonspecific PKC activator that is capable of decreasing the level of Aβ in neurons. 38 The α-secretases are potently regulated by PKC, particularly the α- and ε-isozymes. 39 In addition, oligomeric Aβ treatment can activate cytosolic PKC in NT2 within 24 h. 11 PKC activation also has a crucial role in learning and memory enhancement. Conversely, inhibition of PKC consistently abolishes learning and memory retention. The strategy of PKC-mediated activation of α-secretases, therefore, has the advantage of three parallel beneficial consequences in AD therapy: increasing production of sAPPα, reducing Aβ, and enhancing memory via PKC-mediated phosphorylation of downstream substrates. 40
In this experiment, the cortical and hippocampal cholinergic neurons were processed by a PKC inhibitor CTC, and the expression of KATP subunits Kir6.2/SUR1 in the CTC + Aβ1–42 group significantly decreased compared with Aβ1–42 group. This finding indicates that CTC significantly decreased Aβ1–42-induced Kir6.2/SUR1 protein expression level. The possible mechanism is that the activation of the PKC from the cytoplasm to the cell membrane promotes a variety of protein phosphorylations, including serine or threonine residues of ion channel protein. This changes the KATP channel protein conformation and gating kinetics that increases the expression of the KATP subunits Kir6.2/SUR1. The PKC inhibitor CTC inhibits a series of protein phosphorylation action, thereby decreasing the expression of KATP channel protein to regulate the opening and closing of ion channels. Therefore, the PKC signal pathway is also involved in the increased expression of KATP subunits Kir6.2/SUR1 in neurons.
Compared with both control and CTC + Aβ1–42 groups, the expression of KATP subunit SUR1 significantly decreased in the CTC group, indicating that the inhibitory effect of CTC on the increased expression of KATP subunit SUR1 induced by Aβ1–42 is nonspecific. But when compared with the control group, there is no difference in the expression of the KATP subunit Kir6.2 in the CTC group. This indicates that the inhibitory effect of CTC on the increased expression of KATP subunit Kir6.2 induced by Aβ1–42 is specific. It is concluded that PKC signal pathway is also partially involved in the increased expression of the KATP subunit Kir6.2/SUR1 induced by Aβ1–42 cytotoxicity in neurons.
KATP may also mediate a potential neuroprotective role in AD. Our previous study showed that the exposure of primary cultured cholinergic neurons to Aβ1–42 for 72 h leads to a differential increase in the expression of KATP subunits. In this study, the NF-κB, p38 MAPK, and PKC signal pathways are partially involved in the increased expression of the KATP subunits Kir6.2/SUR1 induced by Aβ1–42 cytotoxicity in neurons, as inhibiting the above signal pathways reduces the expression of KATP subunits Kir6.2/SUR1 in neurons.
Conclusions
Our findings indicate that the signal pathways of NF-κB, p38 MAPK, and PKC play a key role in increasing the levels of Aβ1–42-induced Kir6.2/SUR1 protein expression. We postulate that the possible underlying causes include neuroinflammation, gene transcription, and protein phosphorylation. These findings support a potential theoretical basis of targeting these signal pathways in the treatment of AD.
Footnotes
Authors’ note
G Ma is now affiliated with East Hospital, Tongji University School of Medicine, People’s Republic of China.
Authors’ contribution
Yanju Li and Maowen Ba contributed equally to this work.
Declaration of Conflicting Interests
The author(s) declared no potential conflicts of interest with respect to the research, authorship, and/or publication of this article.
Funding
The author(s) disclosed receipt of the following financial support for the research, authorship, and/or publication of this article: This work was supported by the General Program of the National Natural Science Foundation of the People’s Republic of China (project proposal no. 30870874 and 81571234) and the Young Scholars General Program of the National Natural Science Foundation of the People’s Republic of China (project proposal no. 30600202).