
Abstract
Naproxen is an anti-inflammatory drug that affects cellular calcium ion (Ca2+) homeostasis and viability in different cells. This study explored the effect of naproxen on [Ca2+]i and viability in Madin-Darby canine kidney cells (MDCK) canine renal tubular cells. At concentrations between 50 μM and 300 μM, naproxen induced [Ca2+]i rises in a concentration-dependent manner. This Ca2+ signal was reduced partly when extracellular Ca2+ was removed. The Ca2+ signal was inhibited by a Ca2+ channel blocker nifedipine but not by store-operated Ca2+ channel inhibitors (econazole and SKF96365), a protein kinase C (PKC) activator phorbol 12-myristate 13-acetate, and a PKC inhibitor GF109203X. In Ca2+-free medium, pretreatment with 2,5-di-tert-butylhydroquinone or thapsigargin, an inhibitor of endoplasmic reticulum Ca2+ pumps, partly inhibited naproxen-induced Ca2+ signal. Inhibition of phospholipase C with U73122 did not alter naproxen-evoked [Ca2+]i rises. At concentrations between 15 μM and 30 μM, naproxen killed cells in a concentration-dependent manner, which was not reversed by prechelating cytosolic Ca2+ with the acetoxymethyl ester of 1,2-bis(2-aminophenoxy)ethane-N,N,N′,N′-tetraacetic acid acetoxymethyl. Annexin V/propidium iodide staining data suggest that naproxen induced apoptosis. Together, in MDCK renal tubular cells, naproxen induced [Ca2+]i rises by inducing Ca2+ release from multiple stores that included the endoplasmic reticulum and Ca2+ entry via nifedipine-sensitive Ca2+ channels. Naproxen induced cell death that involved apoptosis.
Introduction
Naproxen is a commonly prescribed nonsteroidal anti-inflammatory drug 1 to deal with pain. 2,3 In vitro evidence shows that naproxen can cause cell death in various cancerous cell lines, such as MCF-7 or MDA-MB-231 human breast cancer cells, 4 MG63 human osteosarcoma cells, 5 Caco2 human colorectal adenocarcinoma cells, HepG2 human hepatocellular carcinoma cells, Hela human epitheloid cervix carcinoma cells, A5W9 human lung carcinoma cells, UM-UC-5 or UM-UC-14 human urinary bladder cancer cells, and so on. 6 –8 It has shown that the in vivo nephrotoxicity induced by naproxen is primarily due to nonoliguric acute renal failure and acute interstitial nephritis. 9,10 However, whether naproxen affects cultured renal cells is unclear. Therefore, the aim of this study was to explore the effect of naproxen on renal tubular cells.
A rise in [Ca2+]i can initiate many pathophysiological cellular processes; however, a unregulated [Ca2+]i rise may cause harm to the cell. 11 Naproxen has not been shown to increase [Ca2+]i in any cell type. In one study, naproxen was thought to impair the metabolic responses to calcium ion (Ca2+)-dependent hormones acting by at least two mechanisms. One is by interfering with the supply of external Ca2+ through a direct action on the plasma membrane Ca2+ influx and the other is by affecting the refilling of the agonist-sensitive internal stores, including endoplasmic reticulum and mitochondria. 12 The MDCK cell line is a useful model for renal cell research. It has been shown that in this cell, [Ca2+]i rises and death can be induced by stimulation with several agents including sulforaphane, 13 bisphenol A, 14 melittin, 15 and safrole. 16
Fura-2 was applied as a fluorescent Ca2+-sensitive probe to measure [Ca2+]i alterations in this study. Naproxen-induced [Ca2+]i rises were characterized, the concentration–response plots were established, and the pathways underlying naproxen-evoked Ca2+ signal were discussed. The effect of naproxen on cell viability and the role of apoptosis were also examined.
Materials and methods
Materials
The reagents for cell culture were from Gibco® (Gaithersburg, Maryland, USA). Other reagents were from Sigma-Aldrich® (St Louis, Missouri, USA).
Cell culture
MDCK canine renal tubular cells purchased from Bioresource Collection and Research Center (Taiwan) were cultured in Dulbecco’s modified Eagle medium supplemented with 10% heat-inactivated fetal bovine serum, 100 U ml−1 penicillin, and 100 μg ml−1 streptomycin.
Solutions used in [Ca2+]i measurements
Ca2+-containing medium (pH 7.4) had 140 mM sodium chloride, 5 mM potassium chloride, 1 mM magnesium chloride (MgCl2), 2 mM calcium chloride (CaCl2), 10 mM 4-(2-hydroxyethyl)-1-piperazineethanesulfonic acid (HEPES), and 5 mM glucose. Ca2+-free medium contained similar chemicals as Ca2+-containing medium except that CaCl2 was replaced with 0.3 mM ethylene glycol tetraacetic acid (EGTA) and 2 mM MgCl2. Naproxen was dissolved in dimethyl sulfoxide (DMSO) as a 0.1 M stock solution. The other chemicals were dissolved in water, ethanol, or DMSO. The concentration of organic solvents in the experimental solutions did not exceed 0.1% and did not affect viability, apoptosis, or basal [Ca2+]i.
[Ca2+]i measurements
[Ca2+]i was measured as previously described. 13 –16 Confluent cells grown on 6 cm dishes were trypsinized and made into a suspension in culture medium at a density of 106 ml−1. Cell viability was determined by trypan blue exclusion. The viability was greater than 95% after the treatment. Cells were subsequently loaded with 2 μM fura-2-acetoxymethyl ester for 30 min at 25°C in the same medium. After loading, cells were washed with Ca2+-containing medium twice and were made into a suspension in Ca2+-containing medium at a density of 107 ml−1. Fura-2 fluorescence measurements were performed in a water-jacketed cuvette (25°C) with continuous stirring; the cuvette contained 1 ml of medium and 0.5 million cells. Fluorescence was monitored with a Shimadzu RF-5301PC spectrofluorophotometer (Japan) immediately after 0.1 ml cell suspension was added to 0.9 ml Ca2+-containing or Ca2+-free medium, by recording excitation signals at 340 and 380 nm and emission signal at 510 nm at 1 s intervals. During the recording, reagents were added to the cuvette by pausing the recording for 2 s to open and close the cuvette-containing chamber. For calibration of [Ca2+]i, after completion of the experiments, the detergent Triton X-100 (0.1%) and CaCl2 (5 mM) were added to the cuvette to obtain the maximal fura-2 fluorescence. Then the Ca2+ chelator EGTA (10 mM) was added to chelate Ca2+ in the cuvette to obtain the minimal fura-2 fluorescence. Control experiments showed that cells bathed in a cuvette had a viability of 95% after 20 min of fluorescence measurements. [Ca2+]i was calculated as previously described. 17
Cell viability assays
Viability was assessed as previously described. 13 –16 The measurement of cell viability was based on the ability of cells to cleave tetrazolium salts by dehydrogenases. Augmentation in the amount of developed color directly correlated with the number of live cells. Assays were performed according to manufacturer’s instructions designed specifically for this assay (Roche Molecular Biochemical, Indianapolis, Indiana, USA). Cells were seeded in 96-well plates at a density of 10,000 cells/well in culture medium for 24 h in the presence of 0–30 μM naproxen. The cell viability detecting tetrazolium reagent 4-[3-[4-lodophenyl]-2-4(4-nitrophenyl)-2H-5-tetrazolio-1,3-benzene disulfonate] (WST-1; 10 μM pure solution, Molecular Probes® (Eugene, OR, USA)) was added to samples after naproxen treatment, and cells were incubated for 30 min in a humidified atmosphere. In experiments using 1,2-bis(2-aminophenoxy)ethane-N,N,N′,N′-tetraacetic acid acetoxymethyl (BAPTA/AM) to chelate cytosolic Ca2+, cells were treated with 5 μM BAPTA/AM for 1 h prior to incubation with naproxen. The cells were washed once with Ca2+-containing medium and incubated with or without naproxen for 24 h. The absorbance of samples (A450) was determined using enzyme-linked immunosorbent assay reader. Absolute optical density was normalized to the absorbance of unstimulated cells in each plate and expressed as a percentage of the control value.
Alexa® Fluor 488 annexin V/propidium iodide staining for apoptosis
Annexin V/propidium iodide (PI) staining assay was employed to detect cells in early apoptotic and late apoptotic stages. Cells were exposed to naproxen at concentrations of 0–30 μM for 24 h and were harvested after incubation and washed in cold phosphate-buffered saline. Cells were resuspended in 400 μl reaction solution with 10 mM of HEPES, 140 mM of NaCl, and 2.5 mM of CaC12 (pH 7.4). Alexa Fluor 488 annexin V/PI staining solution (Molecular Probes, Invitrogen, Eugene, Oregon, USA) was added in the dark. After incubation for 15 min, the cells were collected and analyzed in a FACScan flow cytometry analyzer (FACScan; Becton Dickinson, Mountain View, CA, USA). Excitation wavelength was at 488 nm and the emitted green fluorescence of annexin V (FL1) and red fluorescence of PI (FL2) were collected using 530 and 575 nm band pass filters, respectively. A total of 20,000 cells were analyzed per sample. Light scatter was measured on a linear scale of 1024 channels and fluorescence intensity was on a logarithmic scale. The amount of early apoptosis and late apoptosis was determined, respectively, as the percentage of annexin V+/PI− or annexin V+/PI+ cells. Data were later analyzed using the flow cytometry analysis software WinMDI Version 2.8 (by Joe Trotter, freely distributed software). X and Y coordinates refer to the intensity of fluorescence of annexin V and PI, respectively.
Statistics
Data are reported as means ± SEM of three to five experiments. Data were analyzed by one-way analysis of variances using the Statistical Analysis System (SAS®, SAS Institute Inc., Cary, North Carolina, USA). Multiple comparisons between group means were performed by post hoc analysis using the Tukey’s honestly significant difference procedure. A p value less than 0.05 is considered significant.
Results
Effect of naproxen on [Ca2+]i.
The baseline [Ca2+]i was 50 ± 3 nM (Figure 1(a)). In Ca2+-containing medium, at concentrations between 50 μM and 300 μM, naproxen induced [Ca2+]i rises in a concentration-dependent manner. At 300 μM, naproxen induced a [Ca2+]i rise that attained to an initial peak of net increase of 200 ± 2 nM (n = 3) followed by a rapid decay and a gradual rise that reached a net level of 175 ± 3 nM at the time point of 200 s. The Ca2+ response saturated at 300 μM naproxen because at a concentration of 500 μM naproxen induced a similar response as that induced by 300 μM (not shown). Figure 1(b) shows that in the absence of extracellular Ca2+, naproxen also induced [Ca2+]i rises in a concentration-dependent manner. Figure 1(c) shows the concentration–response plots of naproxen-induced response in the presence and absence of extracellular Ca2+. The half maximal effective concentration value was 121 ± 2 or 151 ± 2 μM in the presence or absence of Ca2+, respectively, by fitting to the Hill equation.

Effect of naproxen on [Ca2+]i in fura-2-loaded MDCK cells. (a) Naproxen was added at 30 s. The concentration of naproxen was indicated. The experiments were performed in Ca2+-containing medium. (b) Effect of naproxen on [Ca2+]i in the absence of extracellular Ca2+. Naproxen was added at 30 s in Ca2+-free medium. (c) A concentration–response plot of naproxen-induced [Ca2+]i rises in the presence or absence of extracellular Ca2+. Y axis is the percentage of the net (baseline subtracted) area under the curve (30–200 s) of the [Ca2+]i rise induced by 300 μM naproxen. Data are mean ± SEM of three separate experiments. *p < 0.05: compared with open circles; Ca2+: calcium ion.
Naproxen-activated Ca2+ entry pathways
Figure 1 shows that naproxen-induced Ca2+ response saturated at 300 μM; thus in the following experiments, the response induced by 300 μM naproxen was used as control. The Ca2+ entry pathways of naproxen-induced [Ca2+]i rises were explored. The store-operated Ca2+ influx inhibitors (econazole (0.5 μM) and SKF96365 (5 μM)), the Ca2+ channel blocker nifedipine (1 μM), a protein kinase C (PKC) activator phorbol 12-myristate 13-acetate (10 nM), and a PKC inhibitor GF109230X (2 μM) were applied. Among them, only nifedipine inhibited 300 μM naproxen-induced [Ca2+]i rises by 30 ± 8% (Figure 2(a)). Figure 2(b) shows that nifedipine did not inhibit naproxen-induced Ca2+ signal in Ca2+-free medium.

Effect of Ca2+ channel blockers and PKC modulators on naproxen-induced [Ca2+]i rises. The [Ca2+]i rise induced by 300 μM naproxen was taken as control. (a and b) In blocker- or modulator-treated groups, the reagent was added 1 min before naproxen. The concentration was 1 μM for nifedipine, 0.5 μM for econazole, 5 μM for SKF96365, 10 nM for PMA, and 2 μM for GF109203X. The experiments were performed in Ca2+-containing medium. Data are expressed as the percentage of control (first column) that is the maximum value of 300 μM naproxen-induced [Ca2+]i rises. Data are mean ± SEM of three separate experiments. *p < 0.05: compared with open circles; Ca2+: calcium ion; PKC: protein kinase C; PMA: phorbol 12-myristate 13-acetate.
Internal Ca2+ stores of naproxen-induced Ca2+ signal
The intracellular Ca2+ store of naproxen-induced [Ca2+]i rises was examined. The endoplasmic reticulum is a major Ca2+ store in most cell types. 11 Figure 3(a) shows that in Ca2+-free medium, addition of 2,5-di-tert-butylhydroquinone (BHQ) (50 μM), an inhibitor of endoplasmic reticulum Ca2+ pumps, 18 induced a [Ca2+]i rise of 81 ± 2 nM followed by a slow decay. Naproxen (300 μM) added at 500 s induced a [Ca2+]i rise of 45 ± 2 nM, which was 30 ± 2% of the control naproxen-induced [Ca2+]i rises (150 ± 2 nM) shown in Figure 1(b). Thapsigargin, another chemical similar to BHQ in action mechanisms, 19 was used. Figure 3(b) shows that thapsigargin induced a [Ca2+]i rise of 110 ± 3 nM. Subsequently added 300 μM naproxen induced a [Ca2+]i rise of 48 ± 2 nM that was 32 ± 2% of the control naproxen effect.

Intracellular Ca2+ stores of naproxen-induced Ca2+ release. (a and b) Experiments were performed in Ca2+-free medium. Naproxen (300 μM), BHQ (50 μM), and thapsigargin (1 μM) were added at time points indicated. Data are mean ± SEM of three separate experiments. Ca2+: calcium ion; BHQ: 2,5-di-tert-butylhydroquinone.
Lack of a role of phospholipase C in naproxen-induced [Ca2+]i rises
Phospholipase C (PLC)-dependent generation of inositol 1,4,5-trisphosphate (IP3) plays an important role in releasing Ca2+ from the endoplasmic reticulum. 20 Because naproxen was able to release Ca2+ from the endoplasmic reticulum, the role of IP3 in this process was investigated. U73122, an inhibitor of IP3 production, 21 was applied to see whether IP3 was required for naproxen-induced Ca2+ release. First, experiments were performed to assure that U73122 effectively abolished production of IP3. Figure 4(a) shows that adenosine triphosphate (ATP) (10 μM) induced a [Ca2+]i rise of 25 ± 2 nM. ATP is an IP3-dependent agonist of [Ca2+]i rises in most cell types. 22 Figure 4(b) shows that incubation with 2 μM U73122 did not change basal [Ca2+]i but abolished ATP-induced [Ca2+]i rises. This suggests that U73122 effectively inhibited IP3 formation. Figure 4(b) also shows that addition of 300 μM naproxen after U73122 and ATP treatments elicited a [Ca2+]i rise that was similar to control (addition of naproxen alone). Furthermore, U73122 (2 μM) failed to have an inhibition in Figure 4(b).
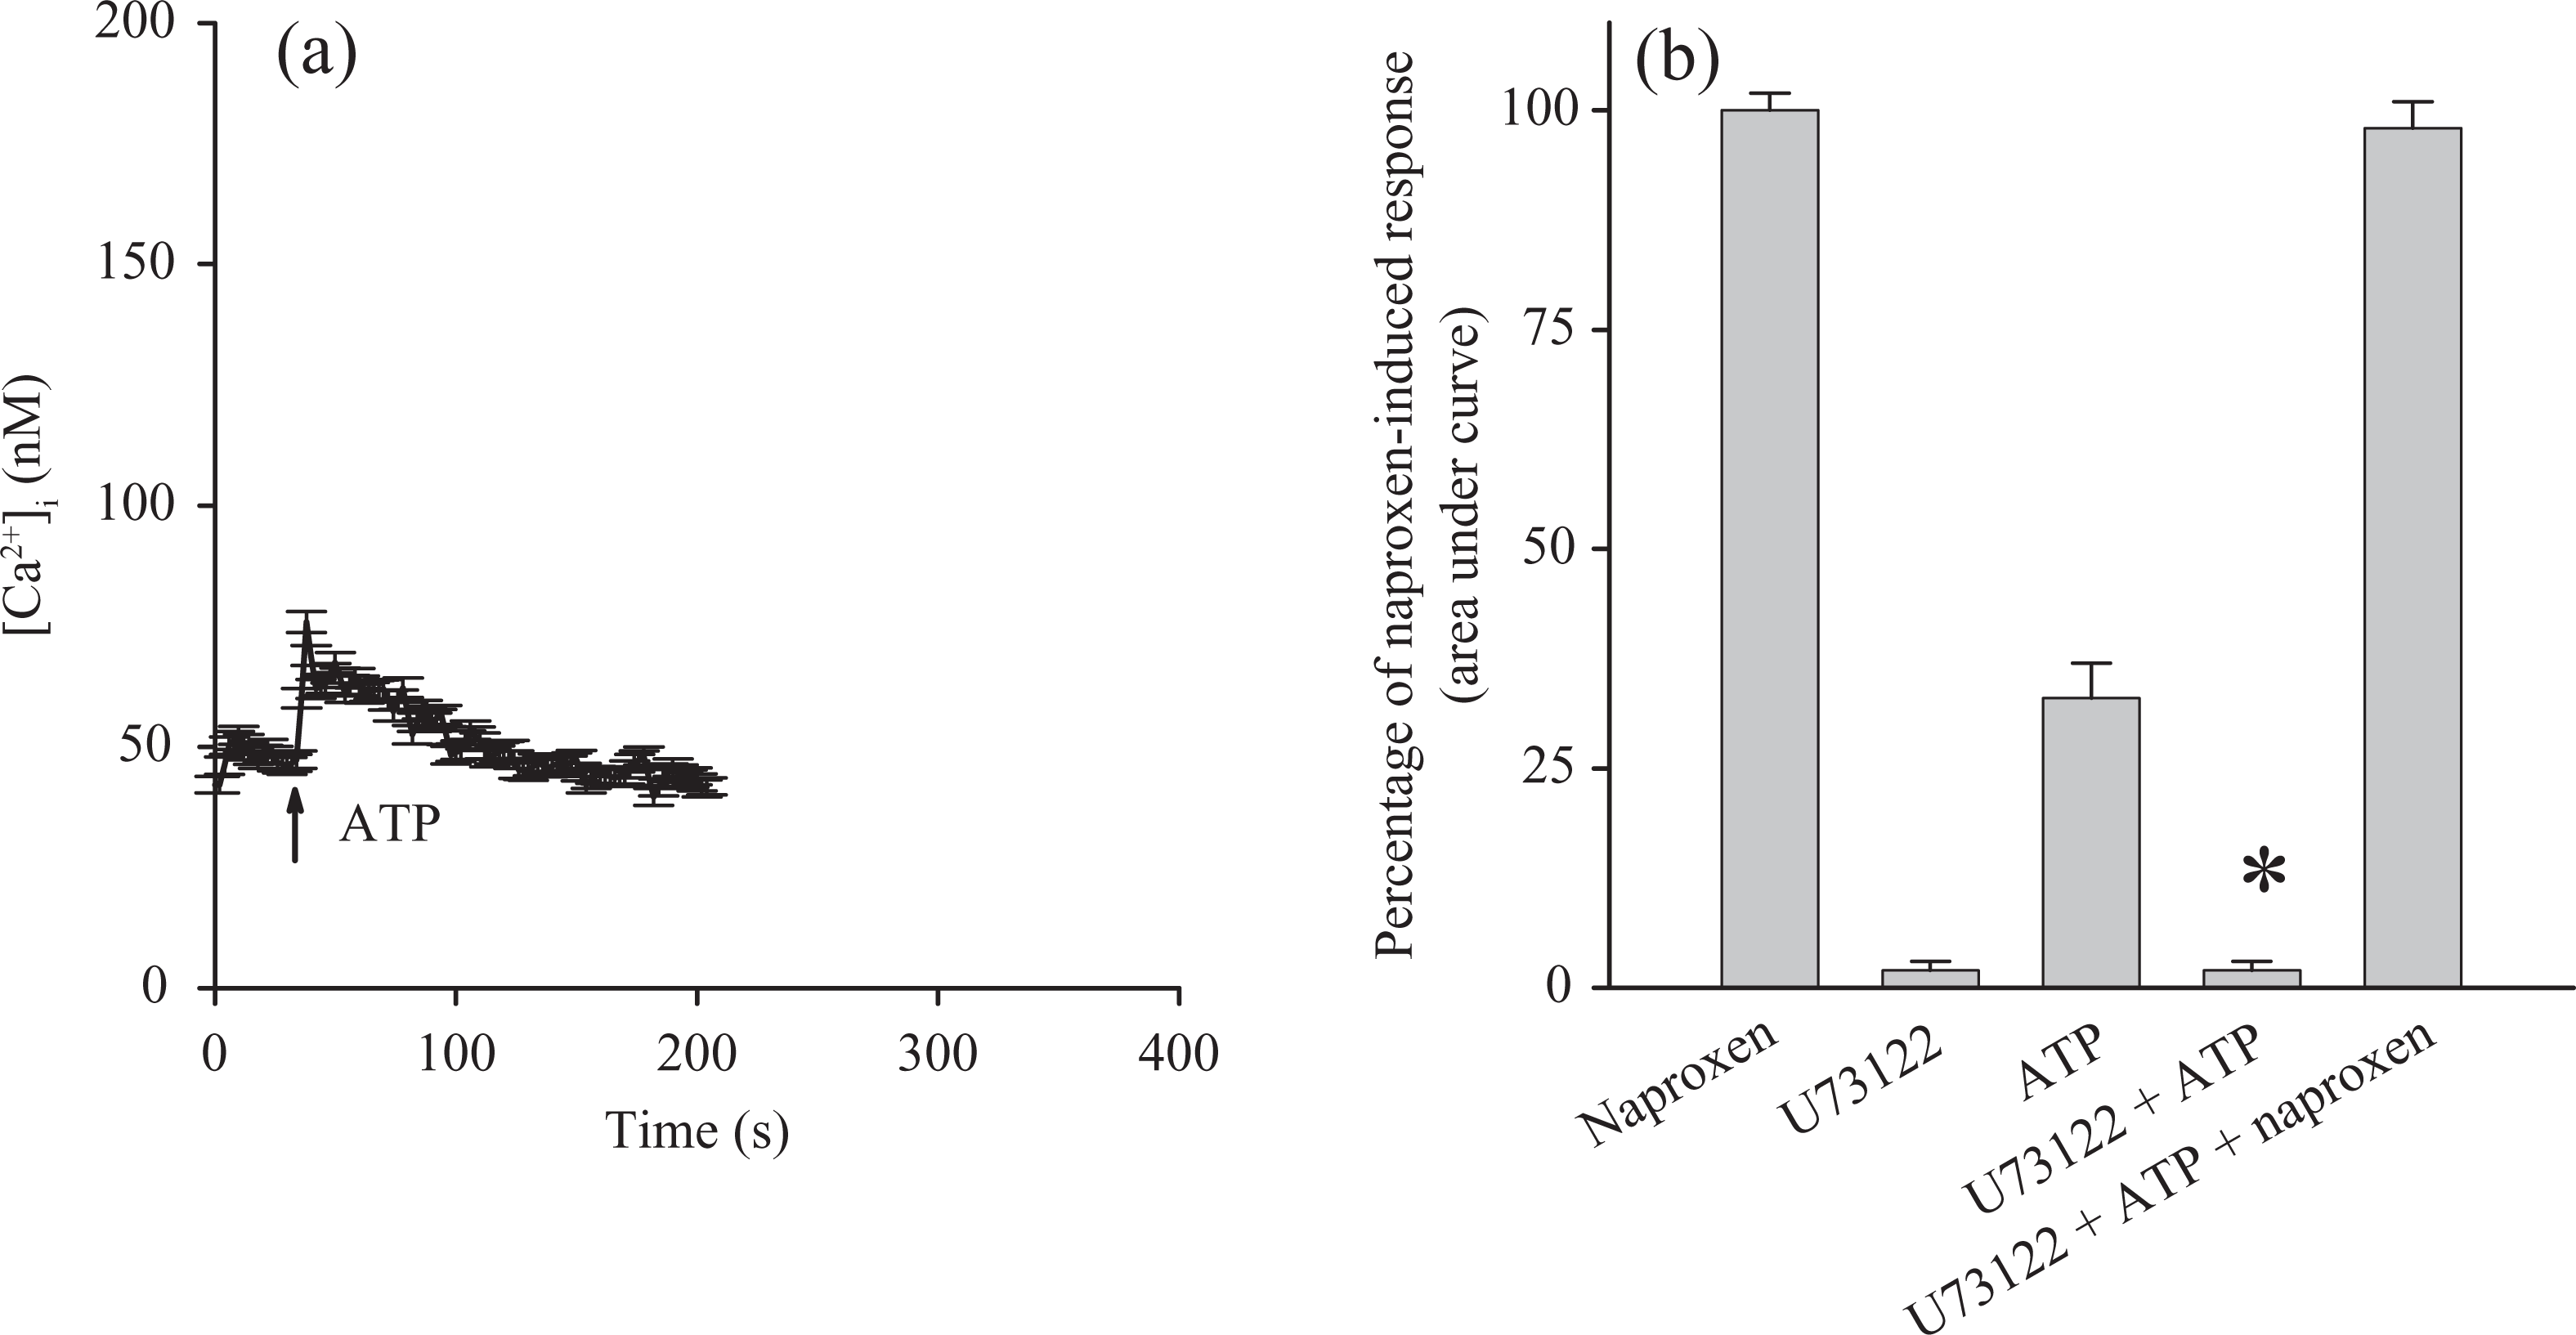
Effect of U73122 on naproxen-induced Ca2+ release. Experiments were performed in Ca2+-free medium. (a) ATP (10 μM) was added as indicated. (b) U73122 (2 μM), ATP (10 μM), and naproxen (300 μM) were added as indicated. Data are mean ± SEM of three separate experiments. *p < 0.05: compared with first bar; Ca2+: calcium ion; ATP: adenosine triphosphate.
Effect of naproxen on cell viability
Cells were treated with 0–30 μM naproxen for 24 h, and the tetrazolium assay was performed. In the presence of naproxen, cell viability decreased in a concentration-dependent manner between 15 μM and 30 μM (Figure 3). The next question was whether the naproxen-induced cytotoxicity was related to preceding [Ca2+]i rises. The intracellular Ca2+ chelator BAPTA/AM (5 μM) 23 was used to prevent a [Ca2+]i rise during naproxen pretreatment. At 300 μM, naproxen did not evoke [Ca2+]i rises in BAPTA/AM-treated cells (not shown). Figure 5 shows that 5 μM BAPTA/AM loading did not alter control cell viability. In the presence of 15–30 μM naproxen, BAPTA/AM loading failed to prevent naproxen-induced cell death.
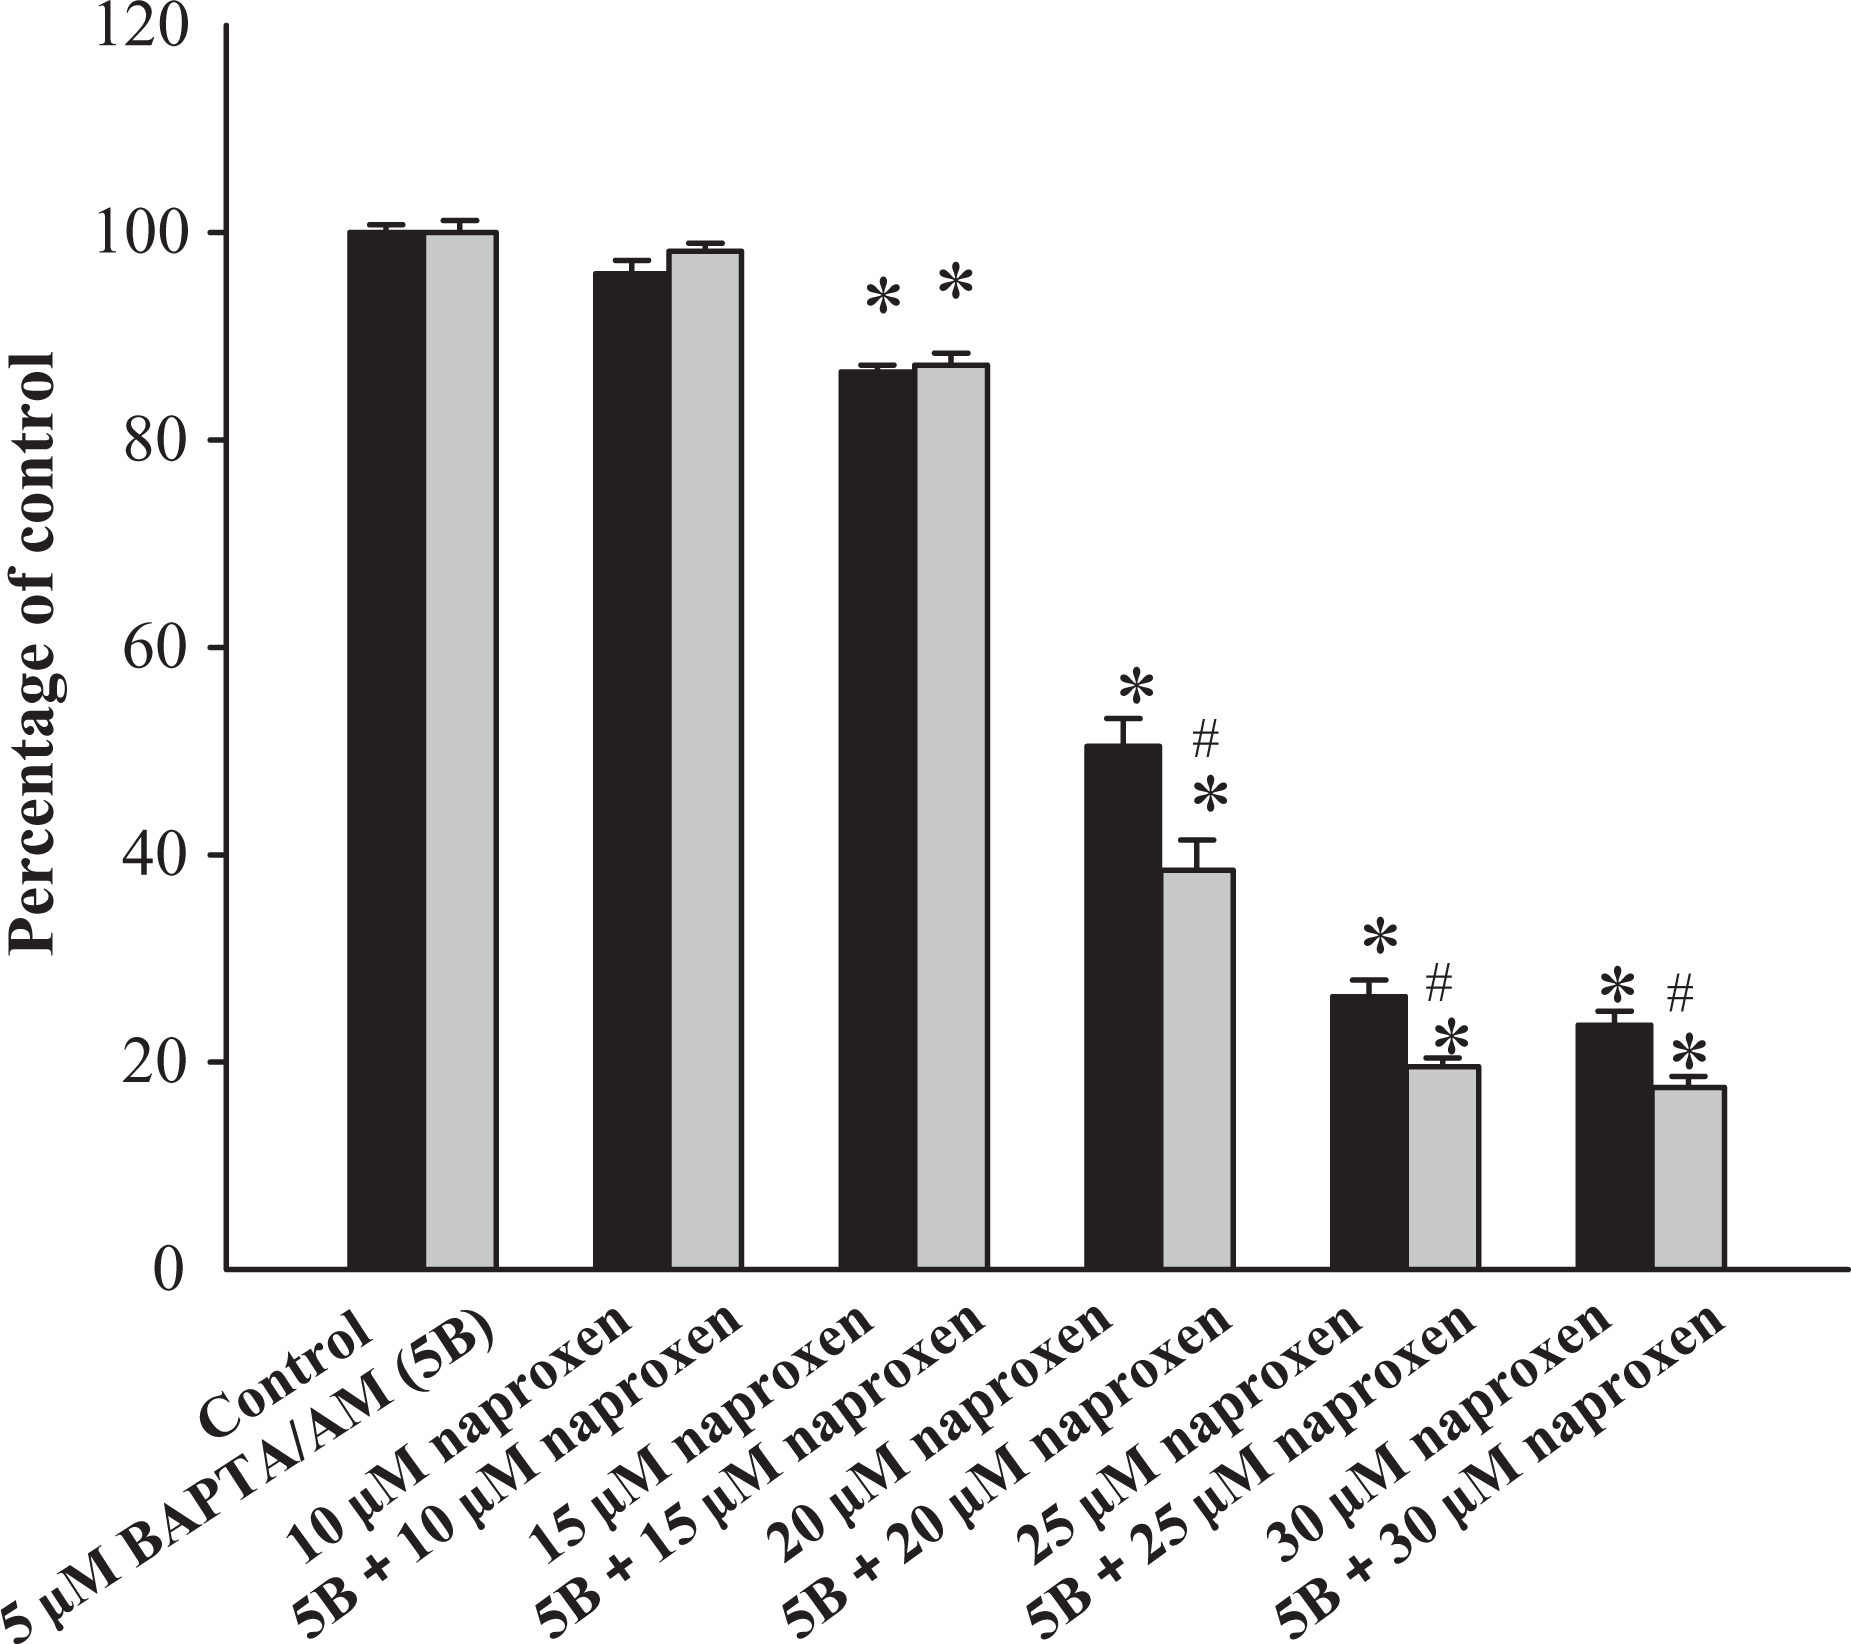
Cytotoxic effect of naproxen. Cells were treated with 0–30 μM naproxen for 24 h, and the cell viability assay was performed. Data are mean ± SEM of three separate experiments. Each treatment had six replicates (wells). Data are expressed as percentage of control response, that is, the increase in cell numbers in naproxen-free groups. Control had 10,656 ± 288 cells/well before experiments and had 13,916 ± 811 cells/well after incubation for 24 h. In each group, the Ca2+ chelator BAPTA/AM (5 μM) was added to cells followed by treatment with naproxen in medium. Cell viability assay was subsequently performed. *p < 0.05: compared with control; Ca2+: calcium ion; BAPTA/AM: 1,2-bis(2-aminophenoxy)ethane-N,N,N′,N′-tetraacetic acid acetoxymethyl.
The role of apoptosis in naproxen-induced cell death
Because the cytotoxic response was most significant between 15 μM and 30 μM naproxen, these concentrations were chosen for apoptotic experiments. Annexin V/PI staining was applied to detect apoptotic cells after naproxen treatment. Figure 6(a) and (b) shows that treatment with 15–30 μM naproxen induced apoptosis.

Naproxen-induced apoptosis as measured by annexin V/PI staining. (a) Cells were treated with 0–30 μM naproxen, respectively, for 24 h. Cells were then processed for annexin V/PI staining and analyzed by flow cytometry. (b) The percentage of early apoptotic cells and late apoptotic/necrotic cells. Data are mean ± SEM of three separate experiments. *p < 0.05: compared with control; PI: propidium iodide.
Discussion
This study shows that naproxen induced [Ca2+]i rises in cultured renal tubular cells. The interaction of naproxen and Ca2+ signaling has not been shown previously in any cell type. Our data are the first to show that naproxen causes [Ca2+]i rises in MDCK canine renal tubular cells. This [Ca2+]i rise is characterized by both Ca2+ entry and Ca2+ release. Removal of extracellular Ca2+ reduced the naproxen-induced response throughout the measurement period, suggesting that naproxen-induced Ca2+ signal was contributed by both Ca2+ entry and Ca2+ release.
In this study, three Ca2+ entry blockers (nifedipine, econazole, and SKF96365) were applied to explore the naproxen-induced Ca2+ influx pathways. The data show that nifedipine was the only agent that inhibited naproxen-induced [Ca2+]i rises in MDCK cells. Accumulated evidence shows that nifedipine not only blocks L-type Ca2+ channels but also store-operated Ca2+ channels. 24 –26 However, MDCK cells do not possess voltage-gated Ca2+ channels. 27 Furthermore, econazole and SKF96365 are widely used as store-operated Ca2+ entry blockers. 24 –26 Therefore, naproxen appeared to induce Ca2+ influx through a nifedipine-sensitive, non-store-operated Ca2+ entry pathway. Transient receptor potential (TRP) Ca2+ channels have been shown to exist in MDCK cells. 28 However, there is no evidence showing that TRP channels are inhibited by nifedipine. Additionally, since stimulation of PLC produces IP3 and diacylglycerol, which then activates PKC, the effect of modulation of PKC activity on naproxen-induced [Ca2+]i rises was explored. Our findings show that naproxen-induced [Ca2+]i rises were not altered by PKC activator or inhibitor.
The BHQ-sensitive endoplasmic reticulum stores appear to play a role in naproxen-induced Ca2+ release because BHQ pretreatment inhibited 30% of naproxen-induced [Ca2+]i rises. In MDCK cells, mitochondria and lysosomes were shown to be potential Ca2+ stores. 29 Thus naproxen may also release Ca2+ from these stores. It seems that PLC-dependent pathways did not play a role in naproxen-induced Ca2+ release, since the response was not changed by inhibiting this enzyme. In other non-excitable cell types, PLC-independent Ca2+ release pathways may include NADPH oxidase pathway and phospholipase A2 pathway. 30 However, the status in MDCK cells is unknown.
The results suggest that naproxen at concentrations lower than that induced [Ca2+]i rises decreased cell viability. Note that [Ca2+]i measurements and viability were two totally different assays. [Ca2+]i measurements were conducted online and terminated within 4–15 min. After 20 min incubation with naproxen, cell viability was still >95%. In contrast, in viability assays, cells were treated with naproxen overnight in order to obtain measurable changes in viability. This is why 30 μM naproxen decreased cell viability in the tetrazolium assay by approximately 70%, whereas 300 μM naproxen did not alter viability in [Ca2+]i measurements.
Ca2+ is known to regulate some types of cell death. 11 Our data suggest that naproxen-induced cell death was not dependent on cytosolic Ca2+ levels. In MDCK cells, some chemicals such as melittin from honey bee venom could induce Ca2+-dependent cell death, 15 while others induced Ca2+-independent death such as the broccoli-derived compound sulforaphane. 13 Furthermore, naproxen (15–30 μM) induced cell death through apoptosis based on annexin V/PI staining data. Furthermore, several studies have also shown that the clinical plasma level of naproxen may reach 20–40 μM. 31 –33 Thus our data may have clinical relevance.
Together, in MDCK renal tubular cells, naproxen induced [Ca2+]i rises by inducing PLC-independent Ca2+ release from multiple stores that included the endoplasmic reticulum and Ca2+ entry via nifedipine-sensitive Ca2+ channels. Naproxen induced cell death that involved apoptosis.
Footnotes
Authors’ Note
HHC and CTC contributed equally to this work
Conflict of interest
The authors declared no conflicts of interest.
Funding
This work was supported by a grant from Chang Bing Show Chwan Memorial Hospital (RD10101) to HHC.