
Abstract
In this study, effects of melatonin, quercetin and resveratrol on hepatocellular injury in streptozotocin (STZ)-induced experimental diabetes were aimed to be investigated by histological and biochemical methods. Thirty-five male Wistar albino rats were divided into five groups, namely, control, diabetes (STZ 45 mg/kg/single dose/intraperitoneally (ip)), diabetes + melatonin (10 mg/kg/30 days/ip), diabetes + quercetin (25 mg/kg/30 days/ip) and diabetes + resveratrol (10 mg/kg/30 days/ip). Initial and final blood glucose levels and body weights (BWs) were measured. At the end of the experimentation, following routine tissue processing procedure, sections were stained with haematoxylin–eosin (H-E), periodic acid Schiff and Masson’s trichrome. Tissue malondialdehyde (MDA) and glutathione (GSH) levels and superoxide dismutase (SOD) and catalase (CAT) activities were examined. The diabetic rats had significantly higher blood glucose levels than those of control rats (p = 0.0001). Mean BWs of diabetic rats were significantly decreased when compared with the control rats (p = 0.0013). Histopathological alterations including cellular glycogen depletion, congestion, sinusoidal dilatation, inflammation and fibrosis were detected in diabetes group. On the other hand, histopathological changes markedly reduced in all of the treatment groups (p = 0.001). Mean tissue MDA level was increased but mean tissue CAT and SOD activities and GSH levels were decreased in the diabetes group. Melatonin, quercetin and resveratrol administered diabetic rats showed an increase in CAT activities and GSH levels and a decrease in MDA levels (p < 0.05, for all). Melatonin, quercetin and resveratrol administrations markedly reduced hepatocellular injury in STZ-induced experimental diabetes.
Introduction
Diabetes mellitus (DM) is a metabolic disorder characterized by hyperglycaemia arising from reduction in β cell mass. 1 It is a highly common disorder throughout the world. Its long-term complications affecting small and large blood vessels are directly related with the duration of hyperglycaemia. 2 Streptozotocin (STZ), an antibiotic produced by Streptomyces achromogenes, is the most commonly used agent inducing experimental diabetes. 3,4 The exact mechanism by which STZ destroys pancreatic β cells and induces hyperglycaemia is still unclear. 3,5
Melatonin (N-acetyl-5-methoxytryptamine) is an indoleamide synthesized and secreted by the pineal gland, retina and many other tissues with a daily rhythmical peak in the dark phase. 6,7 Quercetin (3,5,7,3′4′-pentahydroxyflavone) is one of the most widely distributed flavonoids, present in fruits, vegetables and many other dietary sources. 8,9 Although the antidiabetic properties of flavonoids can be explained by a wide variety of mechanisms, the antioxidant capacity of this group of natural compounds plays an important role in the prevention of hyperglycaemia and related complications. 10 Resveratrol (3,5,4′-trihydroxystilbene), naturally occurring stilbene, is a phytoalexin present in more than 70 plant species such as Polygonum cuspidatum, mulberry (Morus species), grape and red wine. 11,12 Results of many investigations have provided evidence for its beneficial effects in organisms. The anti-cancer, antioxidant, antifungal infection, anti-inflammatory activity, antiplatelet activity, pro-apoptotic and cardioprotective properties of resveratrol have been well established recently. 12 –15
The purpose of the this study was to investigate the effects of melatonin, quercetin and resveratrol on hepatocellular injury in STZ-induced diabetes.
Materials and methods
Thirty-five male Wistar albino rats (Inonu University Animal Research Center, Malatya, Turkey), weighing between 300 and 350 g, were housed in individual cages for 30 days in a well-ventilated room with a 12-h light/12-h dark cycle at 21°C. Animals were fed with standard rat chow and tap water ad libitum. All experiments were approved by the Ethics Committee for Animal Experiments, Faculty of Medicine, Inonu University, Turkey, and followed the National Institutes of Health’s (NIH) Guide for the Care and Use of Laboratory Animals.
Experimental diabetes
After 12-h fasting, the rats were injected intraperitoneally (ip) with a single dose of 45 mg/kg STZ (Sigma, St Louis, Missouri, USA). 15 Three days following STZ injection, blood glucose levels were calculated using a glucometer (Accu-Check Active, ROCHE, Germany) in samples obtained from the tail vein. Animals having a blood glucose level of more than 270 mg/dl were selected for the study. The rats were observed daily for mortality or morbidity. BWs of all animals were recorded.
Groups
The animals were randomly divided into five groups consisting of seven rats each. Group 1 (C): control group; received ip injection of 4% ethanol. Group 2 (DM): diabetes group; received STZ (45 mg/kg/single dose/ip). Group 3 (DM + M): diabetes + melatonin group; diabetic rats received 10 mg/kg/ip/melatonin (product no. BIM0105, Apollo Scientific Limited, UK) for 30 days. 15 Group 4 (DM +Q): diabetes + quercetin group; diabetic rats received 25 mg/kg/ip quercetin (Lot no: 10159068, Alfa Aesar, Ward Hill, Massachusetts, UK) for 30 days. 8 Group 5 (DM + R): diabetes + resveratrol group; diabetic rats received 10 mg/kg/ip resveratrol (product no: M57735199, Molekula, UK) for 30 days. 12 Antioxidant agents were dissolved in 4% ethanol daily. 15
Histological analysis
Animals were killed by ketamine anaesthesia at the end of 30 days. The livers were rapidly removed by laparotomy. Tissue samples were placed in 10% formalin and prepared for routine paraffin embedding. Paraffin blocks were cut at 5 µm thick, mounted on slides, stained with haematoxylin–eosin (H–E), periodic acid Schiff (PAS) and Masson’s trichrome (MT). Sections were examined for histopathological alterations including congestion, sinusoidal dilatation, inflammation, fibsosis and glycogen depletion in 10 different fields on each section. Each of the findings indicating liver injury was semiquantitatively graded as absent (0), mild (1), moderate (2) and severe (3) with a maximum total score of 15. Sections were examined using a Leica DFC280 light microscope and a Leica Q Win and Image Analysis system (Leica Micros Imaging Solutions Ltd., Cambridge, UK).
Biochemical analysis
After removal, all tissues were washed twice with cold saline solution, placed into glass bottles, labelled and stored in a deep freeze (−80°C) until processing. After weighing, the liver was cut into small pieces with scissors on ice and homogenized (for 2 min at 5000 r/min) in four volumes of ice-cold Tris-hydrochloric acid buffer (50 mM, pH 7.4) using a glass Teflon homogenizer (IKA Ultra-Turrax T25 basic homogenizer, Germany). Malondialdehyde (MDA) levels were carried out on the homogenate. The homogenate was then centrifuged at 5000g for 60 min to remove debris. The clear supernatant fluid was used to measure catalase (CAT) activity, GSH and protein assays at this stage. The supernatant solution was extracted with an equal volume of an ethanol/chloroform mixture (5/3, v/v). After centrifugation at 5000g for 30 min, the clear upper layer (the ethanol phase) was used for the superoxide dismutase (SOD) activity and protein assays. All reparation procedures were performed at 4°C.
MDA level determination
Lipid peroxidation (as MDA) levels in liver homogenate were measured with the thiobarbituric acid reaction by the method of Esterbauer and Cheeseman. 16 The quantification of thiobarbituric acid reactive substances was determined by comparing the absorption with a standard curve of MDA equivalents generated by acid-catalyzed hydrolysis of 1,1,3,3 tetramethoxypropane. The values of MDA were expressed as nanomoles per gram wet tissue.
SOD activity determination
Total (copper–zinc and manganese) SOD (EC 1.15.1.1) activity was determined according to the method of Sun et al. 17 The principle of the method is based on the inhibition of nitroblue tetrazolium (NBT) reduction by the xanthine–xanthine oxidase system as a superoxide generator. Activity was assessed in the ethanol phase of the supernatant after 1.0 ml ethanol/chloroform mixture (5/3, v/v) was added to the same volume of sample and centrifuged at 4000g. One unit of SOD was defined as the amount of enzyme causing 50% inhibition in the NBT reduction rate. SOD activity was also expressed as units per milligram protein.
CAT activity determination
CAT (EC 1.11.1.6) activity was determined according to Aebi’s method. 18 The principle of the method is based on the determination of the rate constant (k) for the H2O2 decomposition rate at 240 nm. Results were expressed as k per gram protein in liver tissue.
GSH determination
GSH content was determined according to Ellman. 19 GSH reacts with 5,5′-dithiobis-2-nitrobenzoic acid, and the absorbance spectra of the product have a maximum absorbance at 410 nm. The results were expressed as micromoles per gram wet tissue.
Protein determination
The protein content in the liver was measured by the method of Lowry et al. 20 with bovine serum albumin as the standard.
Statistical analysis
Statistical analysis was carried out using the Statistical Package for the Social Sciences (SPSS) for Windows version 13.0 (SPSS Inc., Chicago, Illinois, USA) statistical program. All data are expressed as arithmetic mean ± standard error (SE). Normality for continued variables in groups were determined by the Shapiro Wilk test. The variables didn’t show normal distribution (p < 0.05). So, Kruskal–Wallis and Mann–Whitney U tests were used for comparison of variables among the studied groups. The value of p < 0.05 was regarded as significant.
Results
Blood glucose levels
The mean blood glucose level of DM group was significantly higher than that of control group (p = 0.0001). When compared with the DM group, blood glucose levels of all of the treatment groups significantly decreased (p = 0.0001). The lowest blood glucose level was detected in DM + Q group. However, no significant difference was detected among treatment groups (p > 0.05). The mean blood glucose levels of all groups are summarized in Table 1.
The mean blood glucose levels of all groups (mg/dl).a

DM: diabetes mellitus; DM + M: diabetes mellitus + melatonin; DM + Q: diabetes mellitus + quercetin; DM + R: diabetes mellitus + resveratrol.
aData are expressed as arithmetic mean ± SE of seven animals. b p = 0.0001 versus control group.
c p = 0.0001 versus DM group.
Body weights
The initial BWs at the beginning of the study were similar in all groups (p > 0.05). The final BWs of rats in DM group were significantly decreased when compared with the control group (p = 0.0013), whereas no significant difference was detected among treatment groups (p > 0.05). The mean initial and final BWs of all groups are summarized in Table 2.
The mean BWs of all groups (g).a
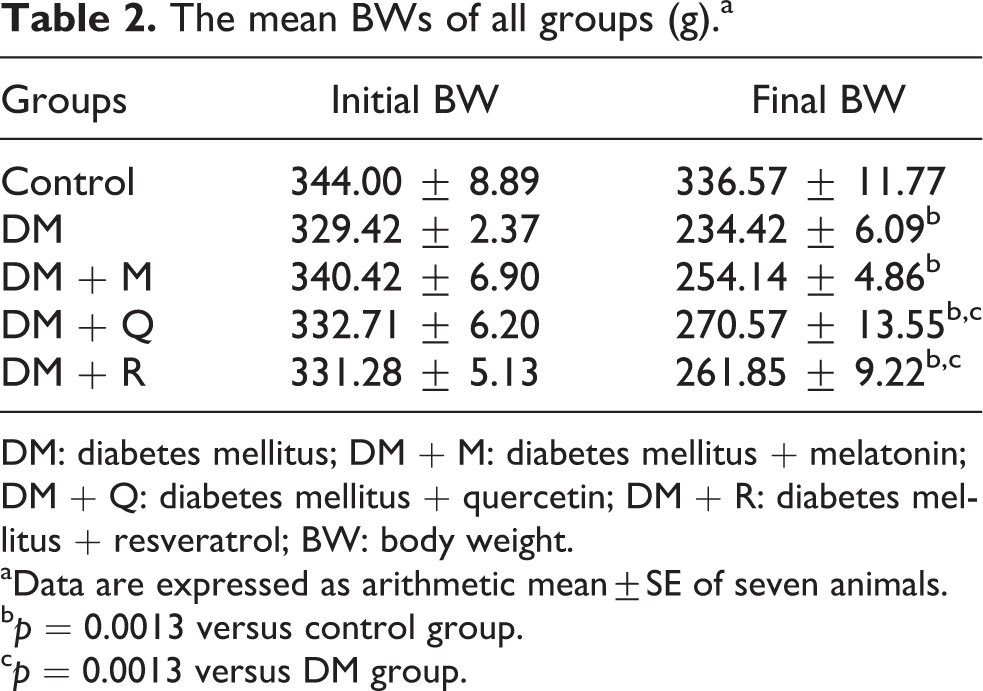
DM: diabetes mellitus; DM + M: diabetes mellitus + melatonin; DM + Q: diabetes mellitus + quercetin; DM + R: diabetes mellitus + resveratrol; BW: body weight.
aData are expressed as arithmetic mean±SE of seven animals.
b p = 0.0013 versus control group.
c p = 0.0013 versus DM group.
Histopathological findings
The control group was normal in histological appearence (Figure 1). In DM group, several histopathological changes including sinusoidal congestion (Figure 2(a)), sinusoidal dilatation (Figure 2(b)), periportal and focal inflammation (Figure 2(c) and (d)) and portal fibrosis (Figure 2e) were observed. Hepatocytes with pycnotic nuclei and eosinophilic cytoplasm were occasionally noticed in parenchyma (Figure 2(f)). Additionally in PAS-stained sections, glycogen depletion in hepatocytes was detected when compared with the control group (Figure 2(g) and (h)). The mean histopathological damage scores (MHDS) were 0.28 ± 0.18 in control group and 9.00 ± 0.21 in DM group (p = 0.001).

The control group was normal in histological appearence. (a) H-E; ×20. (b) H-E; ×40. (c) The hepatocyte cytoplasms containing glycogen were stained purple-pink in sections PAS; ×20. (d) MT; X40. PAS: periodic acid Schiff; H-E: haematoxylin–eosin; MT: Masson’s trichrome.

Several histopathological alterations were detected in DM group. (a) Sinusoidal congestion, H-E; X20. (b) Sinusoidal dilatation, H-E; ×40. (c) Periportal inflammation (arrows), H-E; ×20. (d) Focal inflammation (star), H-E; ×20. (e) Periportal fibrosis, MT; ×20. (f) Hepatocytes with pycnotic nucleus and eosinophilic cytoplasm, H-E; ×40. (g) Decreased glycogen storage in hepatocytes, PAS; ×20. (h) PAS; ×40. DM: diabetes mellitus; H-E: haematoxylin–eosin; MT: Masson’s trichrome; PAS: periodic acid Schiff.
In all of the treatment groups, although the liver tissue preserved its normal histological appearance, inflammation, sinusoidal dilatation and congestion (Figure 3(a) to (c)) were sometimes detected. Glycogen content of hepatocytes was preserved in comparison with the DM group (Figure 3(d) to (f)). Furthermore, any sign of hepatic fibrosis was observed in treatment groups (Figure 3(g) to (i)). MHDSs of DM + M, DM + Q and DM + R groups were 4.57 ± 0.36, 4.00 ± 0.57 and 5.14 ± 0.34, respectively. Differences were significant between DM group and all of the treatment groups (p = 0.001, for all). However, no significant difference was detected among these groups (p > 0.05). The MHDSs of all groups are summarized in Table 3.

Histological appearence of treatment groups. (a) DM + M group: mild sinusoidal dilatation was observed. H-E; ×20. (b) DM + Q group: Sinusoidal dilatation and congestion markedly decreased. However, inflammation was observed in some of areas. H-E; X20. (c) DM + R group: Sinusoidal dilatation and mild congestion were detected in this group. H-E; ×20. (d) DM + M group: The appearence of glycogen storage in hepatocytes was similar to control. PAS; ×20. (e) DM + Q group: Loss of glycogen in hepatocytes was observed in some of areas. PAS; ×20. (f) DM + R group: Glycogen content of hepatocytes markedly decreased. PAS; ×20. (g) DM + M group: Histological appearence was similar to control. MT; ×40. (h) DM + Q group: MT; X40. (i) DM + R group: MT; ×40. DM + M: diabetes mellitus + melatonin; H-E: haematoxylin–eosin; DM + Q: diabetes mellitus + quercetin; DM + R: diabetes mellitus + resveratrol; PAS: periodic acid Schiff; MT: Masson’s trichrome.
The MHDS of all groups.a

DM: diabetes mellitus; DM + M: diabetes mellitus + melatonin; DM + Q: diabetes mellitus + quercetin; DM + R: diabetes mellitus + resveratrol; MHDS: mean histopathological damage score.
aData are expressed arithmetic mean±SE of seven animals.
b p = 0.001 versus control group.
c p = 0.001 versus DM group.
Biochemical findings
The mean tissue MDA level of the DM group was significantly higher than that of the control group (p = 0.018). Among the treatment groups, only the mean tissue MDA level of the DM + M group was lower than that of the DM group (p = 0.034). Antioxidant enzyme levels/activities were decreased in DM group, whereas they were increased in treatment groups; significant differences in the mean tissue GSH levels and CAT activities were detected between DM and DM + M group (p = 0.002 and p = 0.035, respectively). Additionally, mean tissue GSH levels were significantly increased in DM + Q and DM + R groups in comparison with the DM group (p = 0.002). Quercetin and resveratrol administrations had no statistically significant effect on SOD and CAT activities (p > 0.05). The mean biochemical levels are given in Table 4.
The mean biochemical levels of all groups.a

MDA: malondialdehyde; SOD: superoxide dismutase; CAT: catalase; GSH: glutathione; DM: diabetes mellitus; DM + M: diabetes mellitus + melatonin; DM + Q: diabetes mellitus + quercetin; DM + R: diabetes mellitus + resveratrol.
aData are expressed arithmetic mean ± SE of seven animals.
b p = 0.018 versus control group.
c p = 0.047 versus control group.
d p = 0.025 versus control group.
e p = 0.034 versus control group.
f p = 0.034 versus DM group.
g p = 0.035 versus DM group.
h p = 0.002 versus DM group.
Discussion
DM is a well-known endocrine disorder arising from dysfunction and/or death of pancreatic β cells leading to insulin insufficiency.
21
Especially long-term diabetes causes substantial changes in many vital organs including liver.
22
STZ is a deoxy-s (((methyl-nitrosoamino)carbonyl)-amino)-
Several workers have reported that STZ-induced insulin deficiency leads to increased blood glucose level. In our study, single dose of STZ resulted in a significant increase in blood glucose levels. However, melatonin, quercetin and resveratrol reduced blood glucose levels as previously reported. 12,21,23 –28 Previous studies showed that antidiabetic effects of resveratrol are mediated by attenuation of oxidative damage. 29 –31
STZ treatment has been reported to reduce BW. 32 –34 We also detected weight loss of diabetic rats in comparison with control rats, whereas weight gain of antioxidant administered rats. Guneli et al. and Andallu and Varadacharyulu reported that antioxidative agents prevent weight loss in diabetic rats. 35,36
Several studies have reported that diabetes generate histopathological changes in the liver. 12,32,37 –41 In H-E-stained sections, we observed congestion, sinusoidal dilatation and inflammation. Similarly, Yanardag et al., Guven et al. and Soetikno et al. found hydropic swelling, granular degeneration, microvesicular vacuolization, focal necrosis, hepatocyte cord disarrangement and inflammation in diabetic liver. 32,37,42 Shairibha and Rajadurai found severe necrosis, oedema and inflammation. 38 Taslidere et al. found haemorrhagic areas in liver parenchyma. 39 Zafar et al. observed congestion with mild centrilobular hepatocyte degeneration, lymphoplasmacytic infiltration and destruction of some of the bile ducts. 43 We observed hepatocytes with pycnotic nucleus and eosinophilic cytoplasm in some areas as Yanardag et al. and Taslidere et al. previously reported. 32,39 Finally, periportal fibrosis was evident in our study. Similary Soetikno et al., Zafar et al., Das et al. and Thulesen et al. showed hepatic fibrosis in diabetic rats. 42 –45
Glycogen, the main energy source of hepatocytes, is an important parameter indicating liver damage. We evaluated hepatic glycogen storage using the PAS staining method. A significant glycogen loss was observed in the diabetic groups as previously reported. 39,43,45,46,47 Zafar et al. concluded that it might be a result of displacement of glycogen granules by lipid droplets. 43
In our study, melatonin, quercetin and resveratrol were all beneficial in reducing diabetes-induced hepatocellular injury in rats. Guven et al. found melatonin to be protective against STZ-induced diabetic liver injury. 37 Sirovino et al. found quercetin beneficial in reducing lymphocyte infiltrations, apoptosis and vacuolization in diabetic mice. 48 Hamadi et al. reported beneficial effects of resveratrol against ballooning degeneration, necrosis, and inflammatory cells infiltration. 12
Oxidative stress is an imbalance between the production of free radicals and antioxidants defense capacity. 12 The liver is the main organ of oxidative and detoxifying processes, as well as free radical reactions, thus at the early stage of many diseases biomarkers of oxidative stress are elevated in the liver. 49 The liver is subjected to reactive oxygen species (ROS)-mediated injury in diabetes. 50 In physiological condition, excessive generation of ROS could be rapidly detoxified by antioxidant enzymes including SOD and CAT. It is well known that hyperglycaemia increases mitochondrial ROS production and impairs cellular antioxidant enzymes, which could represent a key event in the development and progression of the complications of diabetes. 12,21
MDA, an indicator of free radical generation, is an end-product of lipid peroxidation. 12,51 Increased levels of hepatic MDA were reported in STZ-induced diabetes previously. 9,12,32,37,41,42,48,51 –53 Many antioxidants have been shown to be beneficial in reducing diabetes-induced MDA increase. Melatonin has been reported to be beneficial in reducing hepatic MDA levels in diabetes. 37,52,54,55 Dias et al. and Sirovina et al. found quercetin effective in reducing hepatic MDA levels in diabetes. 9,48 Atef and Ezz reported that increased MDA levels in diabetes was reduced by resveratrol administration. 53 However, Chang et al. reported that resveratrol had no effect on tissue MDA level in rats with diabetes. 21
Hepatocytes have an antioxidant enzyme system including GSH, CAT and SOD that is capable of reducing free radical-induced oxidative injury. GSH, one of the important nonenzymatic antioxidants, is synthesized mainly in the liver. 32 SOD is a metalloprotein and is the first enzyme involved in the antioxidant defence by lowering the steady-state level of O2. CAT is localized in the peroxisomes or the microperoxisomes, which catalyzes the decomposition of H2O2 to water and oxygen, thus protects the cell from oxidative damage induced by H2O2. 41 H2O2 may be an important mediator for tissue damage in STZ-induced diabetes. Yanardag et al., Abolfathi et al. and Korkmaz et al. reported decreased hepatic GSH level in diabetes. 32,41,54 Korkmaz et al. and Bicer et al. found that GSH levels were significantly increased by melatonin administration. 54,55 Sanders et al. reported decreased GSH levels and CAT activity, but increased SOD activity in diabetic conditions. 56 However, Guven et al. reported no significant difference between diabetes and control group in hepatic GSH levels. 37 They also found decreased SOD actvity in diabetic condition was increased by melatonin. Dias et al. and Yilmaz et al. reported increased SOD and CAT activities; 9,51 however, Abolfathi et al. reported decreased SOD and CAT activities in diabetes. 41 Hamadi et al. and Atef and Ezz reported that resveratrol treatment increased SOD and CAT enzyme activities. 12,53 We detected increased MDA levels whereas decreased GSH levels and CAT and SOD activities in diabetic conditions. Melatonin, quercetin and resveratrol decreased MDA levels and increased CAT activity and GSH levels. There was no significant difference in SOD activity among treatment groups. These results together suggest that melatonin, quercetin and resveratrol are effective to protect liver against oxidative stress induced by STZ-induced diabetes.
In conclusion, we report that administrations of melatonin, quercetin and resveratrol lower concentration of blood glucose and reduce histopathological changes in diabetic liver. These agents also decrease production of MDA and regulates cellular antioxidant enzymes of diabetic rat liver.
Footnotes
Conflict of interest
The authors declared no conflicts of interest.
Funding
This study was supported by the Inonu University Scientific Research Foundation.