
Abstract
The role of oxygen radicals are known for the pathogenesis of kidney damage. The aim of the present study was to investigate the antioxidative effects of melatonin, quercetin, and resveratrol on streptozotocin (STZ)-induced diabetic nephropathy in rats. A total of 35 male Wistar rats were divided into 5 groups as follows: control, diabetes mellitus (DM), DM + melatonin, DM + quercetin, and DM + resveratrol. All the injections started on the same day of single-dose STZ injection and continued for 30 days. At the end of this period, kidneys were removed and processed for routine histological procedures. Biochemical parameters and morphological changes were examined. In DM group, blood glucose levels were significantly increased, whereas body weights were decreased compared with the control group. Significant increases in blood urea nitrogen and tissue malondialdehyde (MDA) levels and decreases in superoxide dismutase and catalase activities were detected in DM group. Administration of melatonin, quercetin, and resveratrol significantly reduced these values. Melatonin was more efficient in reducing MDA levels than other antioxidants (p < 0.05). STZ-induced histopathological alterations including epithelial desquamation, swelling, intracytoplasmic vacuolization, brush border loss and peritubular infiltration. Additionally, basement membrane thickening and sclerotic changes were observed in glomerulus. Transforming growth factor-β1 positive cells were also increased. Melatonin, quercetin, and resveratrol significantly reduced these histopathological changes. Our results indicate that melatonin, quercetin, and resveratrol might be helpful in reducing diabetes-induced renal damage
Introduction
Diabetes mellitus (DM) is a metabolic disease that develops in case of insulin release from β cells is insufficient or absent. 1 Many of the complications of DM including renal failure, cardiomyopathy, vascular damage, and vision loss have been attributed to chronic hyperglycemia. 2 Oxidative stress also plays an important role in the etiology of diabetic complications. 3,4 Oxidative stress is caused by the overproduction of reactive oxygen radicals that are highly toxic to all the components of the cells, particularly to the cellular membranes in which they interact with the lipid bilayer and produce lipid peroxides. 5 Hyperglycemia is suggested to promote oxidative stress through both nonenzymatic and enzymatic mechanisms. 4
Streptozotocin (STZ), an antibiotic produced by Streptomyces achromogenes, is the most commonly used agent for inducing experimental diabetes. 5,6 STZ damages the membranes of insulin-producing β cells and results in the depletion of intracellular nicotinamide adenine dinucleotide in islet cells. 3,4
Antioxidant treatment has been shown to be an important therapeutic option for reducing tissue damage and preventing complications in DM. 7 Melatonin (N-acetyl-5-methoxytryptamine), one of strongest antioxidant agent, is an indole amide secreted mainly by the pineal gland with a daily rhythmical peak in the dark phase. 8 It is capable of protecting cells from free-radical damage via its free radical-scavenging and antioxidant properties. 7 Quercetin (3,3′,4′,5,7-pentahydroxyflavone), a lipid-soluble compound, is also capable of radical scavenging, preventing lipid damage and reducing lipid hydroperoxide production. 9 Resveratrol (3,5,4′-trihydroxystilbene) is a naturally occurring diphenol in more than 70 plant species. Results of many investigations have provided evidence for its beneficial effects related to anticancer, antioxidant, anti-inflammatory and cardioprotective properties in organisms. 10,11
Many studies emphasize the central role of transforming growth factor-β (TGF-β) produced by renal mesangial and tubular cells in the initiation and progression of diabetic renal disease. 12,13 TGF-β stimulates these cells to synthesize collagen and other matrix components. Hyperglycemia increases the production and activation of TGF-β in the kidney. 14,15
In the present study, we aimed to evaluate the effects of melatonin, quercetin, and resveratrol administration on STZ-induced diabetes via investigating histopathological and biochemical alterations in kidneys.
Materials and methods
Experimental design
A total of 35 male Wistar albino rats (Inonu University Animal Research Center, Malatya, Turkey), weighing between 300 and 350 g, were housed in individual cages for 30 days in a well-ventilated room with a 12-h light:12-h dark cycle at 21°C. Animals were fed with standard rat chow and tap water ad libitum. After 12-h starvation, the animals were induced diabetes by a single intraperitoneal (i.p.) injection of STZ freshly dissolved in 0.9% saline at a dose of 45 mg/kg (Sigma, St Louis, Missouri, USA). Three days after STZ injection, blood glucose levels of all groups were measured using reagent strips (Accu-Check Active Glucose test strips, Roche, Germany) with a glucometer (Accu-Check Active, Roche) in samples obtained from the tail vein. Animals having 270 mg/dL or higher blood glucose levels were considered to be diabetic. Rats were observed daily for mortality or morbidity. Body weights of all animals were recorded.
The animals were randomly divided into 5 groups each consisting of 7 rats. Group 1—control group (C): nondiabetic rats received 4% ethanol by i.p. injections for 30 days; group 2—diabetes mellitus group (DM): rats received single i.p. injection of STZ dissolved in 0.9% saline at a dose of 45 mg/kg (diabetic rats); group 3—diabetes + melatonin group (DM + M): diabetic rats treated with melatonin (i.p.; Apollo Scientific Limited, UK, product no: BIM0105), dissolved in 4% ethanol, at a dose of 10 mg/kg/day; group 4—diabetes + quercetin group (DM + Q): diabetic rats treated with quercetin (i.p.; Alfa Aesar, Ward Hill, Massachusetts, USA, lot no: 10159068), dissolved in 4% ethanol at a dose of 25 mg/kg/day; and group 5—diabetes + resveratrol group (DM + R): diabetic rats treated with resveratrol (i.p.; Molekula, UK, product no: M57735199), dissolved in 4% ethanol at a dose of 10 mg/kg/day. All the injections started on the same day of single dose STZ injection and continued for 30 days.
The experiments were performed in accordance with the guide for the care and use of laboratory animals of Inonu University’s Animal Ethics Committee.
Histopathological evaluations
After 30 days of dosage administration, the rats were anesthetized by ketamine. Blood samples were collected from tail vein of the rats and then kidneys were removed by laparotomy. The right kidneys from each rat were weighed. Tissue samples were divided into two portions. The first part of the samples was processed for light microscopic examination, while the second part was prepared for biochemical evaluation. The first part of the samples were placed in 10% formalin for 24 h and prepared for routine paraffin embedding. Paraffin blocks were cut at 5 μm thickness, mounted on slides, and stained with hematoxylin–eosin (H-E), periodic acid Schiff (PAS), and toluidine blue (TB) staining methods. Under 20× magnification, tubular changes including hydropic degeneration (swelling/vacuolization), desquamation, brush border loss, and peritubular infiltration were semiquantitatively graded as follows: 0: (normal), 1: mild, 2: moderate, and 3: severe at a maximum score of 12. Glomerular damage was evaluated on the sections stained with PAS. Under 40× magnification, 20 glomeruli were randomly examined. Glomerulosclerotic injury was semiquantitatively graded as follows: 0: intact glomeruli (normal), 1: lesions affecting ≤25% of the glomerular area (mild sclerosis), 2: lesions affecting 25–50% of the glomerular area (moderate sclerosis), and 3: lesions affecting ≥75% of the glomerular area (severe sclerosis).
Immunohistochemical analysis
For immunohistochemical analysis, sections were mounted on polylysine-coated slides. After rehydrating, samples were transferred to citrate buffer (pH 7.6) and heated in a microwave oven for 20 min. After cooling for 20 min at room temperature, the sections were washed with phosphate-buffered saline (PBS), then kept in 0.3% hydrogen peroxide (H2O2) for 7 min and afterward washed with PBS. Sections were incubated with a primary rabbit polyclonal anti-transforming growth factor-β1 (TGF-β1) antibody (sc-146, lot no: C0211; Santa Cruz Biotechnology, Santa Cruz, California, USA) for 2 h. They were rinsed in PBS and incubated with biotinylated goat anti-polyvalent for 10 min and streptavidin peroxidase for 10 min at room temperature. Staining was completed with chromogen + substrate for 15 min, and slides were counterstained with Mayer’s hematoxylin for 1 min, rinsed in tap water, and dehydrated. Anti-TGF-β1 antibody was used according to the manufacturer’s instructions. Brownish yellow granules in cytoplasm were recognized as positive staining for TGF-β1. Under 20× magnification, 100 tubules were selected randomly from each section and the relative intensity of immunostaining within cells was also scored as: 0 = absent, 1 = mild to moderate, and 2 = severe.
All sections were examined using a Leica DFC280 light microscope and a Leica Q Win and Image Analysis system (Leica Micros Imaging Solutions Ltd, Cambridge, UK).
Biochemical evaluations
Preparation of tissue homogenates
Tissues were homogenized (PCV Kinematica Status Homogenizator) in ice-cold PBS (pH 7.4). The homogenate was sonified with an ultrasonifier (Bronson sonifier 450) by 3 cycles (20-s sonications and 40-s pause on ice) and then was centrifuged (15,000g, 10 min, 4°C). Cell-free supernatant was subjected to enzyme assay immediately.
MDA levels
The analysis of lipid peroxidation was carried out as previously described by Buege and Aust with a minor modification. 16 The reaction mixture was prepared by adding 250 μL homogenate into 2 mL reaction solution (15% trichloroacetic acid:0.375% thiobarbituric acid:0.25 N hydrochloric acid, 1:1:1, w/v) and heated at 100°C for 15 min. The mixture was cooled to room temperature, centrifuged (10,000g for 10 min), and the absorbance of the supernatant was recorded at 532 nm. 1,1,3,3-tetramethoxypropane was used as malondialdehyde (MDA) standard. MDA results were expressed as nanomoles per milligram protein in the homogenate.
CAT activity
Catalase (CAT) activity was measured for the supernatants by the method followed by Luck. 17 The decomposition of the substrate H2O2 was monitored spectrophotometrically at 240 nm. Specific activity was defined as micromole substrate decomposed per minute per milligram of protein. CAT levels were expressed as micromole per milligram of protein.
SOD activity
Superoxide dismutase (SOD; copper, zinc-SOD) activity was measured in the supernatant fraction using xanthine oxidase/cytochrome c method according to the method followed by McCord and Fridovich 18 where one unit of activity is the amount of enzyme needed to cause half-maximal inhibition of cytochrome c reduction. The amount of SOD in the extract was determined as nanograms of enzyme per milligram protein utilizing a commercial SOD as standard.
tGSH levels
The formation of 5-thio-2-nitrobenzoate is followed spectrophotometrically at 412 nm. 19 The amount of glutathione GSH in the extract was determined as nanomoles per milligram protein utilizing a commercial GSH as the standard.
Determination of protein
Protein levels of the tissue samples were measured by the Bradford method. 20 The absorbance measurement was taken at 595 nm using an ultraviolet–visible spectrophotometer. Bovine serum albumin was used as protein standard.
BUN and creatinine levels
Blood samples for the measurement of blood urea nitrogen (BUN) and creatinine levels were drawn into ethylenediaminetetraacetic acid-containing tubes and immediately placed on ice. All tubes were centrifuged within several minutes of collection and stored at −70°C until assay. Serum samples were assayed for BUN and creatinine. Analyses were performed on an Abbott Architect c 1600 automatic analyzer (Abbott Park, Illinois, USA).
Statistical analysis
Statistical analysis was carried out using the Statistical Package for Social Sciences for Windows version 13.0 (SPSS Inc., Chicago, Illinois, USA) and MedCalc (SBB Consulting 10, UK) statistical programs. All data are expressed as arithmetic mean ± standard error. Normality for continued variables in groups was determined by the Shapiro–Wilk test. The variables didn’t show normal distribution (p < 0.05). So, Kruskal–Wallis and Conover tests were used for comparison of variables among the studied groups. The value of p < 0.05 was regarded as significant.
Results
Body and kidney weights
The initial body weights were similar in control and the other groups (p > 0.05). The mean final body weight of diabetic group was significantly lesser than that of the control group (p = 0.0013). On the other hand, the mean final body weights of the DM + Q and DM + R groups were significantly higher than that of DM group (p = 0.0013). No significant difference wasdetected between DM + M and DM groups (p > 0.05). There was also no significant difference in the kidney weights among the groups. The mean body and kidney weights of all groups are shown in Table 1.
The mean BWs and kidney weights of all groups (in grams).a

DM: diabetes mellitus; C: control; M: melatonin; Q: quercetin; R: resveratrol; BW: body weight.
aData are expressed as arithmetic mean ± SE of seven animals.
b p > 0.05: there was no significant difference among groups for kidney weight.
c p = 0.0013 versus group 1.
d p = 0.0013 versus group 2.
Blood glucose levels
Blood glucose levels of all groups were calculated to be from 94.85 ± 2.93 mg/dL to 115.71 ± 1.42 mg/dL at the beginning of the experiment. At 72 h following STZ injection, blood glucose levels were significantly increased compared with the control group (p = 0.0001). At the end of day 30, mean blood glucose concentrations were significantly decreased in all treatment groups compared with the DM group (p = 0.0001). The mean blood glucose levels of all groups are shown in Figure 1.

The mean blood glucose levels of all groups (in milligram per deciliter). There were no significant differences among all groups in initial blood glucose levels (p > 0.05). a p = 0.0001: significantly elevated when compared with the control group; b p = 0.0001: significantly decreased when compared with the DM group. DM: diabetes mellitus.
Histopathological findings
Glomerulus and tubules were normal in histological appearance (Figure 2). DM group showed severe glomerular and tubular alterations. Tubular changes including epithelial desquamation, cellular swelling, intracytoplasmic vacuolization, and peritubular infiltration were obvious (Figure 3). In PAS-stained sections, brush border loss from proximal tubules, glycogen granules in the tubular cells, thickened capillary and tubular basal membranes, and sclerotic changes were detected (Figure 4). In TB-stained sections, numerous granules were observed in the proximal tubule cells (Figure 5(a)). The mean histopathological damage score (MHDS) of this group was 5.85 ± 0.34. Significant increase in MHDS was detected in DM group in comparison with the control group (p = 0.0003). Histopathological damage in DM + M, DM + Q, and DM + R groups were markedly reduced (Figure 6). Sclerotic changes were significantly improved in all these groups in comparison with DM group (p = 0.0001, for all) without any significant differences among them. MHDSs were 3.71 ± 0.52 in DM + M, 4.28 ± 0.35 in DM + Q, and 4.42 ± 0.52 in DM + R groups. MHDSs of DM group and those of DM + M, DM + Q, and DM + R groups were significantly different (p = 0.0003, for all). Although the lowest MHDS among groups were detected in DM + M group, no significant difference was detected. Furthermore, in TB-stained sections form DM + M group, granules in proximal tubules were more numerous than those of the other groups (Figure 5(b) to (d)). MHDSs and glomerulosclerotic score of all of the groups are summarized in Tables 2 and 3.
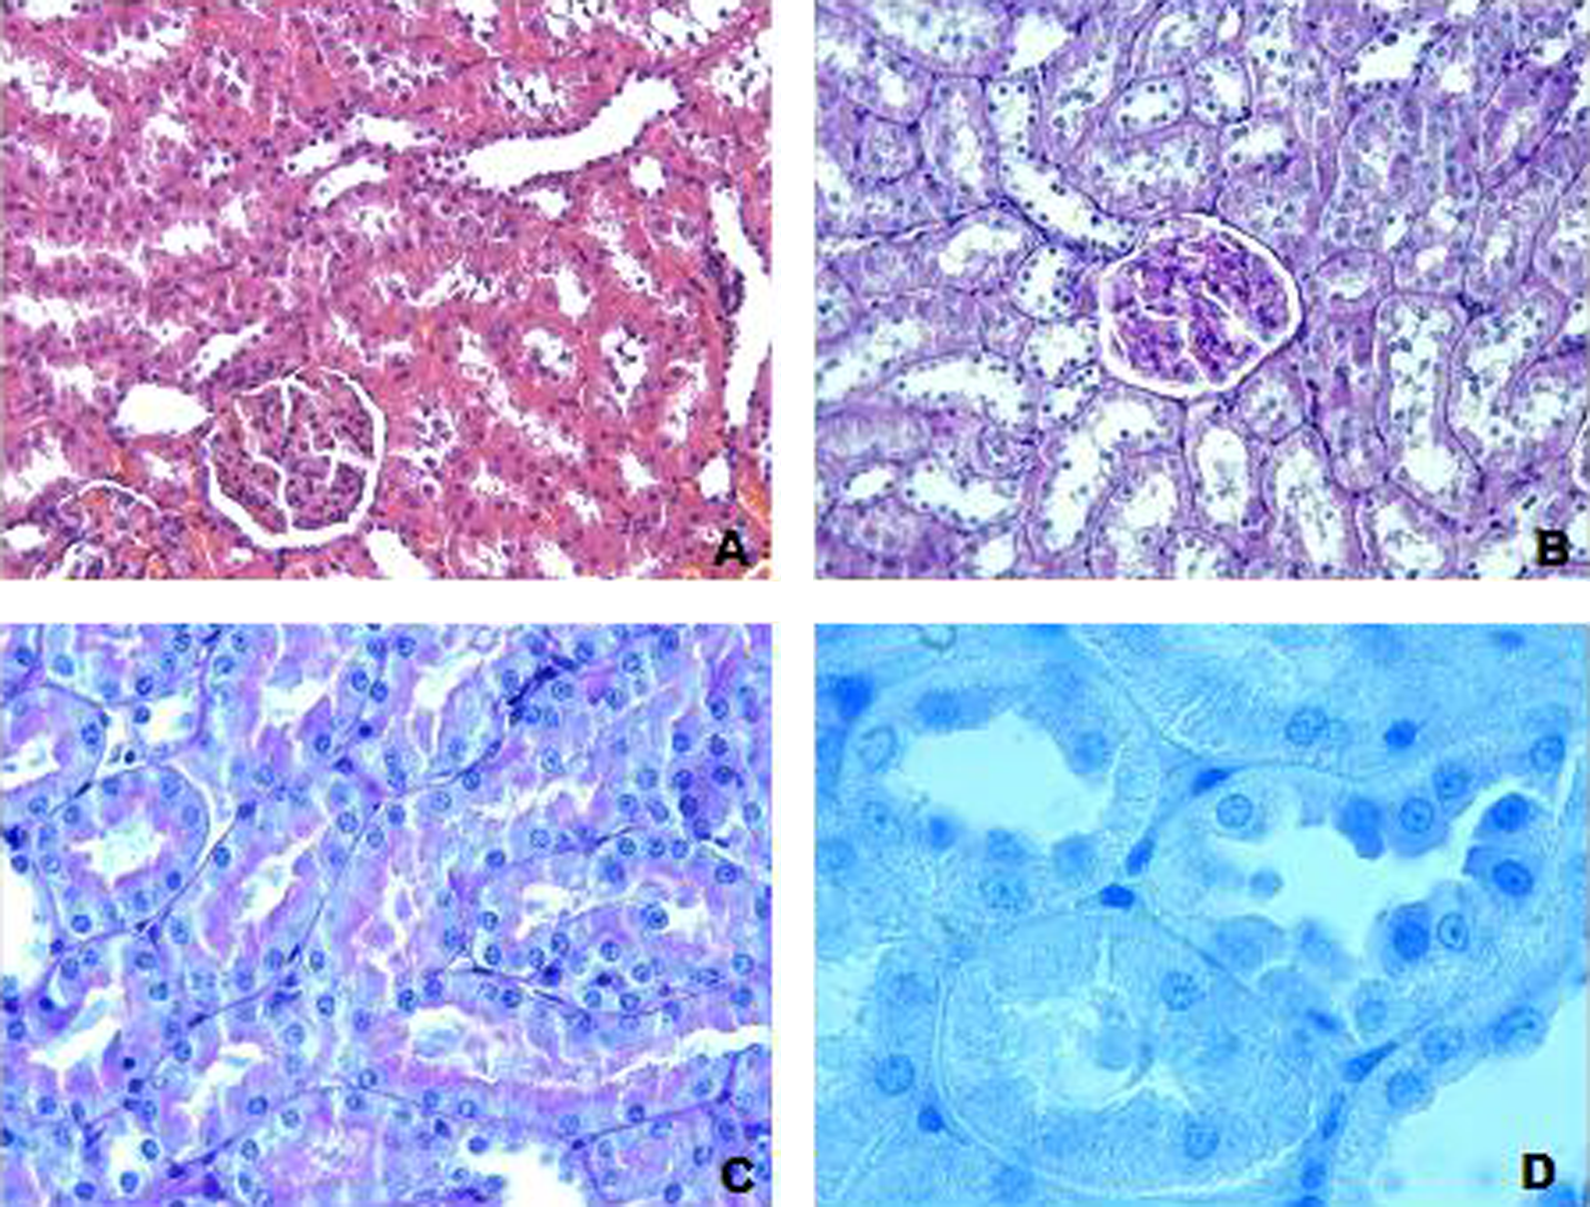
Control group. Histological appearance was normal. (a) H-E; ×20; (b) PAS; ×20; (c) PAS; ×40; (d) TB; ×100. H-E: hematoxylin–eosin; PAS: periodic acid Schiff; TB: toluidine blue.

We detected different histopathological changes in H-E-stained sections in DM group. (a) Epithelial desquamation in tubules (arrows), H-E: ×20; (b) common infiltration (stars) and hemorrhagic areas (arrows), H-E: ×20; (c) swelling of tubular cells (arrows), H-E: ×40; and (d) extensive vacuolization in proximal tubular cells (arrows), H-E: ×100. H-E: hematoxylin–eosin; DM: diabetes mellitus.
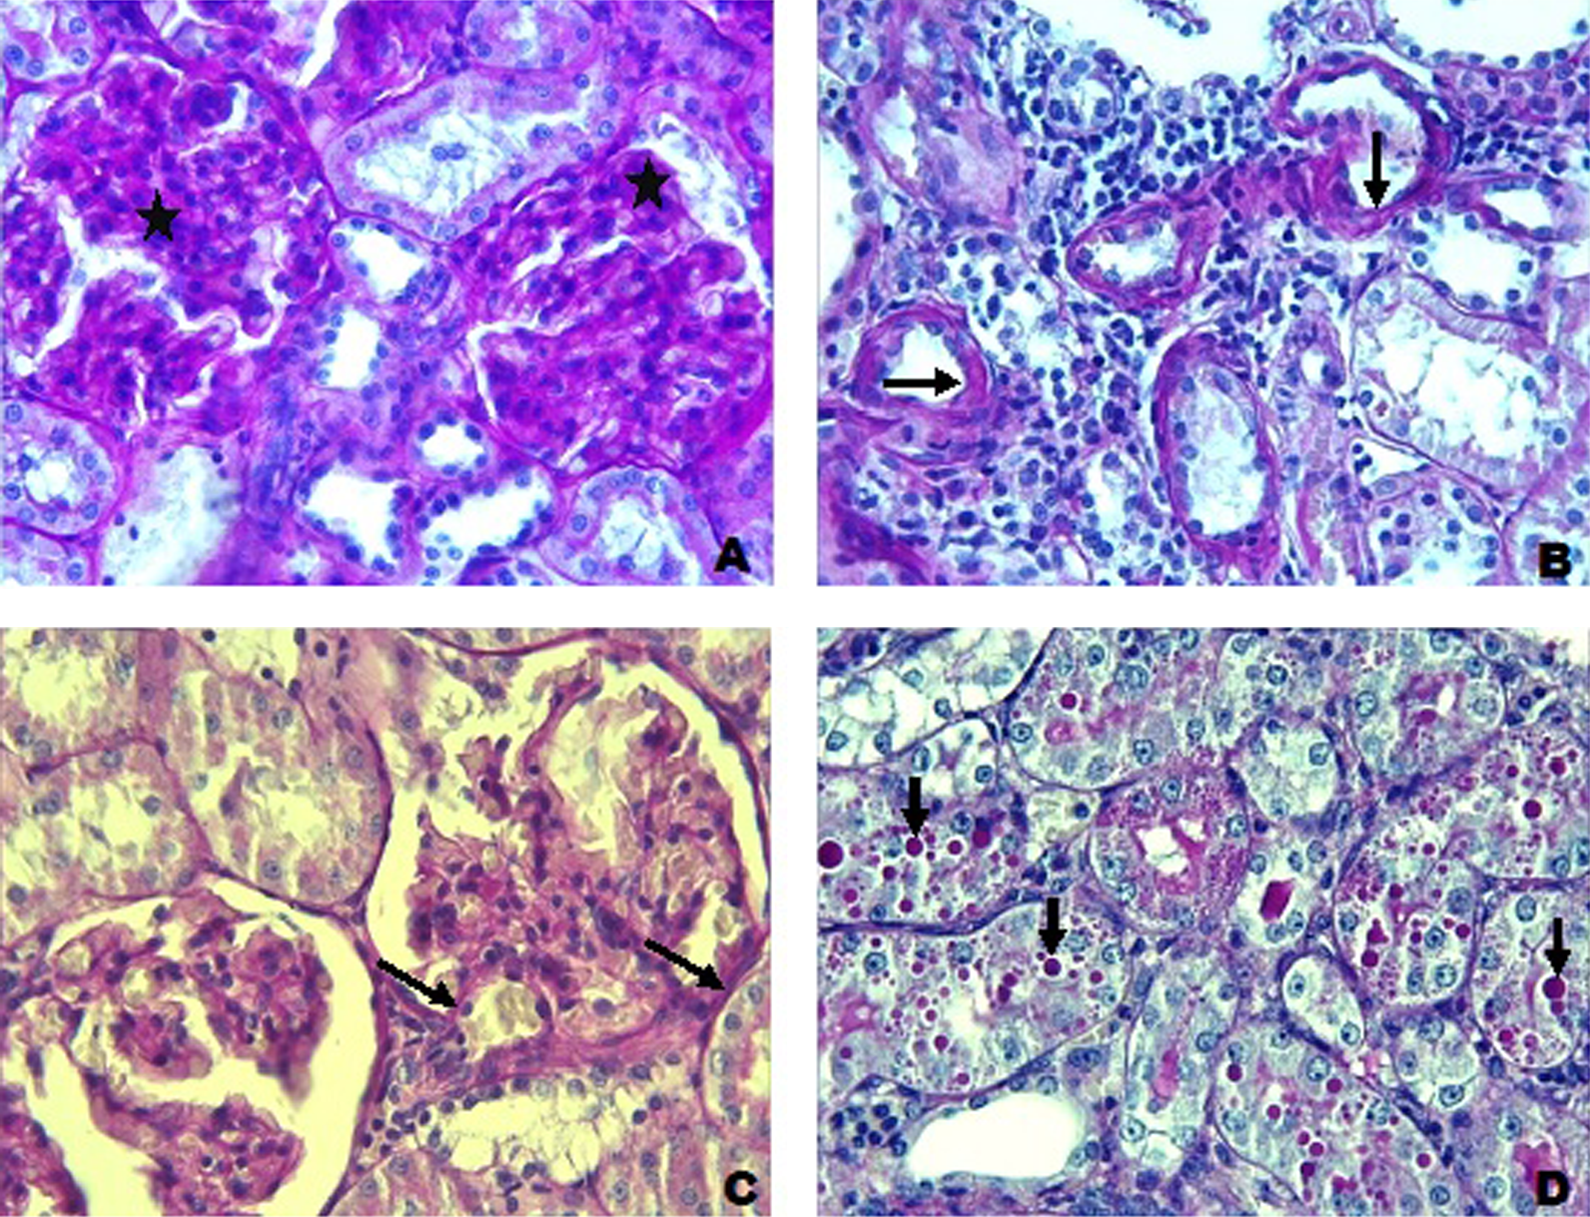
Histopathological changes in PAS-stained sections were detected in DM group. (a) Glomerulosclerosis (stars), PAS: ×40; (b) thickening of tubular basal membrane (arrows) and loss of microvilli in proximal tubules, PAS: ×40; (d) thickening of capillary basal membrane in glomerulus (arrows), PAS: ×40; and (e) in tubules, a great number of PAS (+)-stained granules in different sizes are shown, PAS: ×40. PAS: periodic acid Schiff; DM: diabetes mellitus.

(a) DM group: blue-stained, large and small granules in tubular epithelial cells (arows) were observed in this group; TB: ×100. (b) DM + M group: blue-stained granules decreased (arrows); TB: ×100. (c) DM + Q group: blue-stained granules were detected infrequently (arrow); TB: ×100. (d) DM + R group: blue-stained granules were observed rarely (arrow) in proximal tubule; TB: ×100. DM: diabetes mellitus; TB: toluidine blue; M: melatonin; Q: quercetin; R: resveratrol.

Histopathological alterations markedly diminished in treatment groups. (a) DM + M group: mild epithelial desquamation in tubules and hydropic degeneration in some tubular cells, H-E: ×20. (b) DM + M group: tubular basal membrane and microvilli in proximal tubules were partly in good condition, PAS: ×40. (c) DM + Q group: moderate epithelial desquamation in tubules (arrows), H-E: ×20. (d) DM + Q group: glomerular capillary lumen was observed clearly, PAS: ×40. (e) DM + R group: epithelial desquamation and hydropic degeneration in tubules, H-E: ×20. (f) DM + R group: loss of microvilli in some proximal tubules (thin arrow) and partly thickened basal membrane in glomerulus (thick arrow), PAS: ×40. DM: diabetes mellitus; H-E: hematoxylin–eosin; PAS: periodic acid Schiff; M: melatonin; Q: quercetin; R: resveratrol.
MHDS of all groups.a
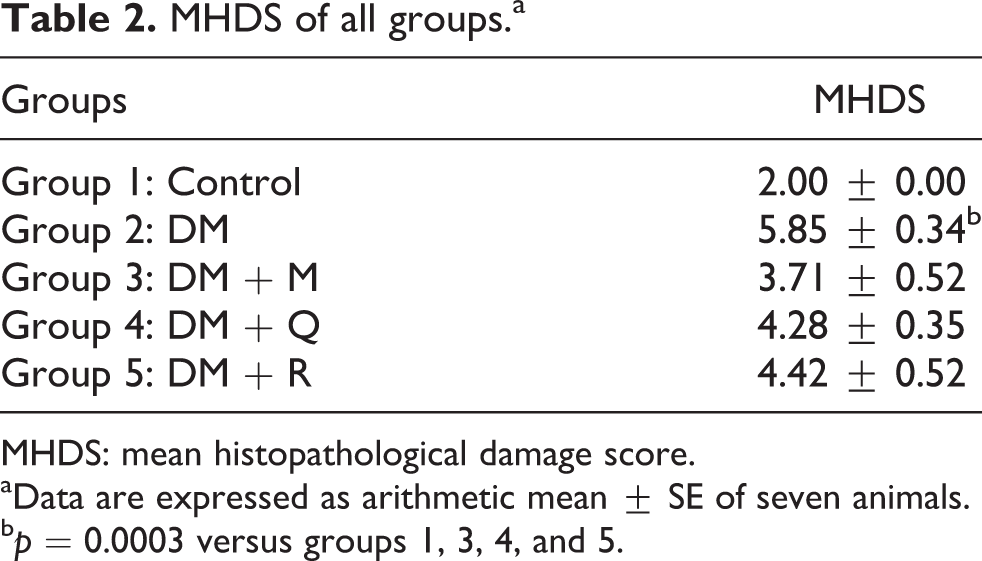
MHDS: mean histopathological damage score.
aData are expressed as arithmetic mean ± SE of seven animals.
b p = 0.0003 versus groups 1, 3, 4, and 5.
The mean glomerulosclerotic index of all groups.a

DM: diabetes mellitus; M: melatonin; Q: quercetin; R: resveratrol.
aData are expressed as arithmetic mean ± SE of seven animals.
b p = 0.0066 versus groups 1, 3, 4, and 5.
c p = 0.0004 versus groups 1, 3, 4, and 5.
d p = 0.0063 versus groups 1, 3, 4, and 5.
e p = 0.0001 versus groups 1, 3, 4, and 5.
f p = 0.0004 versus group 1.
g p = 0.0001 versus group 3.
Immunohistochemical findings
TGF-β1 intensity was not obvious in control group. In DM group, TGF-β1 expression was more prominent in comparison with that of the control group (p = 0.0001). In treatment groups, TGF-β1 expression was stronger than that of the control group but weaker than that of DM group (p < 0.05; Figure 7). No significant difference was detected among treatment groups. TGF-β1 intensity of all the groups are summarized in Table 4.

(a) Control group: glomerulus (G) and tubules (T) were normal; TGF-β1; ×40. (b) DM group: severe immunopositivity in tubules; TGF-β1; ×20. (c) DM group: slight immunopositivity in glomerulus; TGF-β1; ×40. (d) DM + M group: immunopositivity in tubules was markedly reduced; TGF-β1: ×40. (e) DM + Q group: slight immunopositivity in tubules was detected; TGF-β1: ×40. (f) DM + R group: slight immunopositivity in tubules was observed; TGF-β1; ×40. TGF-β1: transforming growth factor-β1; DM: diabetes mellitus; M: melatonin; Q: quercetin; R: resveratrol.
The number of TGF-β1 immunostaining positive tubules of all groups.a

TGF-β1: transforming growth factor-β1; DM: diabetes mellitus; M: melatonin; Q: quercetin; R: resveratrol.
aData are expressed as arithmetic mean ± SE of seven animals.
b p = 0.0002 versus groups 1 and 5.
c p = 0.0003 versus groups 1, 3, and 4.
d p = 0.0001 versus groups 1, 3, 4, and 5.
Biochemical findings
Mean tissue MDA level of DM group was significantly increased when compared with the control group (p = 0.0001). However; mean MDA levels in the treatment groups were significantly decreased when compared with the DM group (p = 0.0001). The lowest tissue MDA level was detected in DM + Q group.
Mean tissue SOD and CAT activities of DM group was significantly decreased in comparison with the control group (p = 0.0001; 0.0009, respectively). SOD activities of DM + M and DM + Q groups and CAT activity of all the treatment groups were significantly increased in comparison with the DM group (p = 0.0001; 0.0009). No significant difference between DM group and DM + R group was detected. Mean tissue total GSH (tGSH) levels of all the groups were similar. No significant difference was detected among groups (p > 0.05). The mean tissue MDA and tGSH levels and SOD and CAT activities of all groups are shown in Figure 8.

The mean tissue MDA, tGSH levels and SOD, CAT activities of all groups. a p = 0.0001:significantly elevated when compared with all the groups; p > 0.05: there were no significant differences among all groups in tissue tGSH levels. b p = 0.0001: significantly decreased when compared with the control group. c p = 0.0001: significantly increased when compared with the DM group. d p = 0.0009: significantly decreased when compared with the control group. e p = 0.0009: significantly increased when compared with the DM group. MDA: malondialdehyde; tGSH: total glutathione; DM: diabetes mellitus.
BUN and creatinine levels
Mean BUN level of DM group was significantly increased in DM group when compared with the control group (p = 0.0001). BUN levels of DM + M and DM + R groups were significantly decreased in comparison with DM group (p = 0.0001). No significant difference in serum creatinine levels was detected among experimental groups. The mean BUN and creatinine levels of all groups are shown in Figure 9.

The mean serum BUN and creatinine level of all groups. a p = 0.0001: significantly elevated when compared with the control group. b p = 0.0001: significantly decreased when compared with the DM group. p > 0.05: there were no significant differences among all groups in serum creatinine levels. BUN: blood urea nitrogen; DM: diabetes mellitus.
Discussion
Oxidative stress has an important role in the pathogenesis of diabetes-induced nephropathy. 21 The aim of the present study was to investigate the antioxidant effects of melatonin, quercetin, and resveratrol against diabetic renal damage primarily by microscopic and biochemical methods. Previous studies on antioxidant administration to diabetic rats emphasized their hypoglycemic effects in STZ-induced diabetes. 22 –25 In our study, we also detected reducing potency of antioxidants on blood glucose. Our results confirm those of some other studies stating that melatonin, quercetin, and resveratrol are beneficial on stabilizing blood glucose values. 26 –29
Body weight loss is commonly observed during short- and long-term experimental diabetes studies 9,30 We detected significant weight loss in diabetes group in comparison with the control group. Interestingly, Guneli et al. and Andallu and Varadacharyulu have reported that natural and chemical agents having free radical-scavenging properties prevented weight loss in diabetic rats. 31,32 In the present study, antioxidant-administered diabetic rats lost body weights lesser than the nontreated rats. Body weight loss in diabetic rats has been found to be related with muscle loss due to over catabolism of tissue proteins as a result of hyperglycemia. 32 Thus, the antioxidants we administered maintain the body weight by controlling blood glucose level thereby preventing protein catabolism.
In the experimental diabetes studies, results on kidney weights are contradictory. Coldiron et al. reported decreases in kidney weights, whereas Garman et al. reported significant increases in kidney weights. 9,23 Teoh et al. found no significant difference in kidney weights 33 as we did.
The most common histopathological alterations including capillary basal membrane thickening and diffused or nodular glomerulosclerosis on diabetic nephropathy occur in glomerulus. 34 Diffused glomerulosclerosis is characterized by mesangial cell proliferation and expansion of mesangial matrix. 35,36 We observed mesangial matrix expansion within glomerulus, capillary, and tubular basal membrane thickening in diabetic groups. Eddy suggested that the cause of glomerular and tubular basal membrane thickening is similar. 37 In vitro studies have proved that at high concentrations of glucose, proteoglycans, decorin, fibronectin, type-4 collagen, and laminin levels as well as TGF-β expression are increased. TGF-β inhibits collagenase production but stimulates metalloproteinase inhibitor production in tissues thus causing accumulation of extracellular matrix (ECM) proteins in glomerular and tubular basal membranes by preventing degradation. 38
We detected some diabetes-related alterations including loss of brush border, epithelial swelling or desquamation, accumulation of glycogen granules, and peritubular inflammation. Some previous studies reported similar histopathological alterations on rats. 22,26,39,40 Glomerular and tubular changes were reduced in melatonin-, quercetin-, and resveratrol-administered groups. The therapeutic effects of resveratrol is attributed to its hypoglycemic, antioxidative, anti-inflammatory, and adenosine monophosphate active protein kinase regulatory properties. 29 Chang et al. reported that resveratrol treatment improved hyperglycemia and hyperglycemia-related renal dysfunction. 29 We found quercetin beneficial in reducing diabetes-related alterations. Quercetin, a free radical scavenger and superoxide radical inhibitor, is known to be a strong antioxidant. 27,41 Mahesh and Menon and Edremitlioglu et al. reported its antioxidant power in the course of diabetes. 28,42 Beneficial effects of quercetin are attributed to its antioxidant effects as well as protective effects on β cell integrity. As a matter of fact, Vessal et al. reported its increasing effect on the number of islets of Langerhans in pancreas. 27 By this way, there is a significant decrease in plasma glucose level. The third agent we used, melatonin, is a powerful free radical scavenger and antioxidant enzyme stimulator. 43,44 Chronic melatonin application has been reported to reduce renal damage on STZ-induced diabetes in rats. 45 In tissues like kidney where glucose input is not related with insulin, blood glucose concentration is increased when aldose reductase is activated resulting in sorbitol production. Sorbitol not capable of transmitting through cell membranes but accumulates within the cytoplasm and eventually causes disintegration of the cell membranes. Additionally by its osmotic effect, it causes cell swelling. 46 Melatonin stabilize cell membranes by its high lipophilic property thus preventing the cells from hydrophobic changes.
Another interesting result of the present study was the presence of numerous granules within the cytoplasm of tubule cells in TB-stained sections. Yakan and Esrefoglu and Vardi et al. suggested that these large, heterogeneous, dense granules are in fact lysosomes increased for eliminating excess amount of intracytoplasmic glycogen. On the other hand, hyperglycemia causes glycosylation of protein and peptides resulting in the formation of glycosylation end products. 22,47 Gugliucci reported that advanced glycation end products (AGE) peptides that are filtered by glomerulus are metabolized by endolysosomal system at proximal tubules. 46 Cathepsin and metalloproteinase significantly reduce renal lysosomal enzyme activities. Both endocytosis of AGE peptides at proximal tubules and decreased lysosomal activity can result in increase of lysosome number. 48,49
TGF-β is an important growth factor stimulating ECM synthesis by mesangial and epithelial cells. 50,51 In the present study, TGF-β1 immune positivity was strong in proximal tubules whereas was weak on glomerulus in diabetic group. Rocco et al. reported increased TGF-β expression at proximal tubule epithelial cells under the effect of high glucose concentration. 52 However, in another study, a weak positivity in tubules and glomerulus was observed in the course of acute phase of diabetes in rats. 51 It is known that reactive oxygen species has a key role in increased TGF-β synthesis in diabetes. 36 In our study, we detected that melatonin, quercetin, and resveratrol administrations reduced TGF-β1 expression at proximal tubules of diabetic rats. Ha et al. reported that melatonin reduced TGF-β messenger RNA level in the kidney 1.4 times in diabetic rats. 53
Serum BUN and creatinine levels are the most important indicators of kidney functions. Lu et al.reported that BUN and creatinine levels were increased in diabetes. 24 On the other hand, Choi et al. reported no significant increase in BUN and creatinine levels in diabetic group when compared with the control group. 40 In the present study, BUN levels were increased, whereas creatinine levels were unchanged in diabetes. In experimental diabetes, some of the antioxidants including Ginkgo biloba and propolis have been found beneficial in recovering kidney functions. 24,25 We found melatonin, quercetin, and resveratrol effective in reducing BUN levels.
In the present study, oxidative stress was evaluated by means of tissue MDA and tGSH levels and SOD and CAT activities. In DM group, tissue MDA levels were increased, whereas tissue SOD and CAT activities were decreased. Similar results were reported by Obrosova et al. and Kataya and Hamza. 30,54 Glucose is oxidized to reactive ketoaldehyde and superoxide radicals. If it is not decomposed by CAT or GSH peroxidase it causes production of reactive hydroxyl radicals. Excess amounts of free radicals damage cellular proteins and nucleic acids by attaching to them. 55 They cause lipid peroxidation by increasing low-density lipoprotein. MDA is the most commonly used indicator of lipid peroxidation. Increase in tissue MDA level and decreases in cellular antioxidant enzymes emphasize oxidative stress. 56 We suggest that melatonin, quercetin, and resveratrol prevent from oxidative stress by reducing lipid peroxidation and increasing SOD and CAT activities. 57 Cam et al. reported that melatonin treatment decreased lipid peroxidation, inhibited glomerular basal membrane thickening, and mesangial matrix expansion. 45 Edremitlioglu et al. reported that quercetin treatment significantly decreased diabetes-related oxidative damage in various organs by decreasing MDA levels, but increasing antioxidant enzyme activities. 42 Lu-Jia and Li-Jing reported that resveratrol decreased MDA content and increased the SOD activity in the kidneys of diabetic rats. 58
In present study, we found that mean tissue tGSH levels of all the groups were similar. There was no significant difference among groups. On the other hand, previous experimental studies have shown that GSH enzyme activities reduced in STZ-induced diabetic nephropathy by antioxidative agents. 31,54
As a conclusion we suggest that melatonin, quercetin, and resveratrol are beneficial in improving diabetic nephropathy by preventing oxidative stress.
Footnotes
Acknowledgment
The authors extend their sincere gratitude to the Department of Histology and Embryology, Faculty of Medicine, Inonu University, Malatya, Turkey, for their support.
Conflict of interest
The authors declared no conflicts of interest.
Funding
This study was financially supported by a grant from Scientific Research Fund of Inonu University (Grant number: 2011/63).