
Abstract
Due to widely commercial applications of silver nanoparticles (Ag NPs), toxicity assessment of this NP is of great importance. This study aimed to investigate the oxidative stress and heat shock response of Ag NPs at different doses to A549 and HepG2 cells. After treatment with different concentrations of Ag NPs for 24 h, oxidative damage indicated by malondialdehyde (MDA), 8-epi-PGF2α, and 8-hydroxy-2′-deoxyguanosine (8-oxo-dG) concentrations and protein levels of heat shock protein A1A (HSPA1A) and heme oxygenase 1 (HO-1) were determined. Ag NPs induced dose-dependent increases in MDA, 8-epi-PGF2α, and 8-oxo-dG concentrations in both A549 and HepG2 cells. Stress-inducible HSPA1A and HO-1 were also significantly upregulated in a dose-dependent manner. A higher level of HSPA1A and HO-1 activation by Ag NPs occurred in HepG2 cells than that in A549 cells. Compared with that of HSPA1A, Ag NPs induced a stronger increase in protein level of HO-1 in both cell lines. Significant positive correlations between protein levels of HSPA1A and HO-1 and oxidative damage were also observed. In conclusion, Ag NPs could induce oxidative stress in human cell lines. In addition to the products of oxidative stress such as MDA and 8-oxo-dG, HSPs can be used as potential biomarkers in nanotoxicity assessment, especially HO-1.
Introduction
Nanomaterials have been widely used in recent years in aerospace engineering, nanoelectronics, environmental remediation, medical health care, and consumer products. 1,2 Of various nanomaterials, silver nanoparticles (Ag NPs) have gained much popularity due to their broad spectrum of antimicrobial activity. In 2011, for example, more than 300 products containing Ag NPs were on the market, and many of these products have great potential to directly contact with the human body, such as Ag NPs-containing fabric clothes, wound dressing, and ointments. 3,4
Ag NPs may be exposed in population by inhalation, dermal contact, and oral ingestion. The absorbed Ag NPs can pass through the respiratory or gastrointestinal tracts and distribute in many organs such as lung and liver. 5,6 There is growing evidence that Ag NPs are highly toxic in terms of cytotoxicity, genotoxicity, and oxidative stress in vivo or in vitro. 5,7,8 For instance, Ag NPs-induced toxicity, inflammation, and oxidative stresses were reported in rat liver in vivo and in human hepatocyte cell line in vitro. 5 Results from some studies suggested that Ag NPs toxicity was mediated through induction of reactive oxygen species (ROS), 9 –11 evidenced by elevated oxidative stress including lipid peroxidation, protein oxidation, and DNA damage. 12
Heat shock response is one of the major pathways that can protect cells against oxidative stress and other cell injuries, which is characterized by transcriptional upregulation of a family of genes encoding heat shock proteins (HSPs). HSPs are known as molecular chaperones that play essential roles in nascent protein folding and misfolded protein degradation. 13,14 Among the HSPs, the stress-inducible HSP (HSPA1A, HSP70) has been reported to be upregulated by pathophysiological stressors such as ischemia 15 and by environmental stressors such as air pollutants. 16,17 Because of its stress responsiveness, HSPA1A expression has been suggested as a potential biomarker for toxicity of environmental pollutants. 18 Heme oxygenase 1 (HO-1), an inducible stress protein known as HSP32, can be upregulated by various oxidizing agents, heavy metals, pro-inflammatory cytokines, and hypoxia. 19 –21 Previous studies demonstrated that moderate levels of bilirubin and carbon monoxide (CO) generated by HO-1 catalysis could exert potential antioxidant and anti-inflammatory effects, 22 and HO-1 was therefore an important contributor to cytoprotection against oxidative stress. 23,24 However, studies on the role of HSPA1A and HO-1 in the oxidative stress induced by Ag NPs are only rare.
The present study aimed to investigate the oxidative stress and heat shock response of Ag NPs at different doses to two human cell lines. Specifically, Ag NPs induced lipid peroxidation indicated by malondialdehyde (MDA) and 8-epi-PGF2α concentration, oxidative DNA damage indicated by 8-hydroxy-2′-deoxyguanosine (8-oxo-dG) concentration, and protein levels of HSPA1A and HO-1 were determined in human lung carcinoma (A549) cells and HepG2 cells to provide more experimental basis in elucidating mechanisms underlying Ag NPs toxicity.
Materials and methods
Chemicals and materials
Dulbecco’s modified Eagle’s minimal (DMEM) essential medium, trypsin, and fetal bovine serum (FBS) were obtained from GIBCO (Grand Island, New York, USA). Ag NPs were purchased from Sigma-Aldrich (St Louis, Missouri, USA, cat. no. 576832). The cell MDA assay kits were obtained from Jiancheng Bio Company (Nanjing, China). The 8-oxo-dG and 8-epi-PGF2α enzyme-linked immunosorbent assay (ELISA) kits were purchased from R&D Systems (Minneapolis, Minnesota, USA). The HepG2 cell line was kindly provided by Dr Darroudi (Leiden University, the Netherlands).
Characterization of Ag NPs
According to product information, the particle size of Ag NPs is <100 nm. To confirm and clarify the size and morphology of Ag NPs, transmission electron microscopy (TEM) characterization was performed on a HITACHI H-600 transmission electron microscope operating at an accelerating voltage of 100 kV. The Ag NPs were examined after deposition of nanoparticles suspensions onto 300 mesh holey carbon-coated copper grids. The stock solution of Ag NPs (10 mg/ml) was prepared in deionized water. Dynamic light scattering (DLS) was conducted for the characterization of hydrodynamic size of Ag NPs (2 μg/ml) diluted by DMEM supplemented with 10% FBS or deionized water.
Cell culture
A549 cells and HepG2 cells were cultured in DMEM essential medium supplemented with 10% FBS, 2 mM glutamine, 100 units/ml penicillin, and 100 µg/ml streptomycin. Cultures were maintained in a humidified atmosphere with 5% carbon dioxide at 37°C and refreshed every 2 to 3 days with subculturing.
Treatment of A549 and HepG2 cells with Ag NPs
Prior to each experiment, cells were seeded in triplicate at a density of 0.5 × 10⁴/well in 96-well culture plates or 2.5 × 10⁵/well in 6-well culture plates. After 24 h incubation, the culture medium was refreshed and supplemented with increasing concentrations of Ag NPs (12.5, 25, 50, 100, and 200 µg/ml) for another 24 h incubation. Before each experiment, the Ag NPs stock solution (10 mg/ml, in deionized water) was diluted to working concentration with the culture medium and sonicated for 20 min in an ultrasonic water bath to ensure a uniform suspension.
Determination of cell viability
The A549 and HepG2 cell viabilities were determined by measuring the capacity of cells to reduce the tetrazolium salt, 3-(4,5-dimethylthiazol-2-yl)-2,5-diphenyltetrazolium bromide (MTT), to a blue formazan product. 25 Briefly, cells were seeded in 96-well plates under different treatments in DMEM culture medium with 10% FBS. Then, the cells were incubated with MTT (500 µg/ml) at 37°C for 4 h and lysed with dimethyl sulfoxide. Finally, the absorbance was measured at 570 nm using the microplate spectrophotometer (Molecular Devices, Sunnyvale, California, USA). To rule out the possible interference with this assay by Ag NPs, all measurements were adjusted by the corresponding background absorbance of the nanoparticles in a cell-free condition. The untreated cells were the 100% viable control.
Detection of lipid peroxidation
Levels of lipid peroxidation in A549 and HepG2 cells were measured using the cell MDA assay kits and 8-epi-PGF2α ELISA kits. The MDA assay is based on the reaction of MDA with thiobarbituric acid, at moderate temperature, which yields a stable chromophore with maximal absorbance at 532 nm wavelength. MDA concentration is expressed as nanomoles per milliliter. Levels of 8-epi-PGF2α in the culture medium were determined using a commercial enzyme immunoassay according to the manufacturer’s instructions. The concentration of 8-epi-PGF2α is expressed as nanogram per liter.
Determination of oxidative DNA damage
Levels of oxidative DNA damage in A549 and HepG2 cells were assayed by determination of 8-oxo-dG. Levels of 8-oxo-dG in the culture medium were determined using a commercial enzyme immunoassay according to the manufacturer’s instructions. The 8-oxo-dG concentration is expressed as nanogram per liter.
Detection of HSPA1A and HO-1 protein levels
Western blot analysis was carried out as described previously by Towbin et al. 26 with minor modifications. A total of 20 μg proteins were loaded in each well and separated by 10% sodium dodecyl sulfate/polyacrylamide gel electrophoresis. After running, the proteins were transferred onto nitrocellulose membranes. The membranes were saturated and blocked with 5% fat-free milk at 37°C for 1 h, before being incubated with mouse anti-HSPA1A (SPA 810, StressGen, Canada), rabbit anti-HO-1 antibodies (5853 S, Cell Signaling Technology, Danvers, Massachusetts, USA) or mouse anti-β-actin antibodies (A5441, Sigma). After extensive washing, the second antibody (goat anti-mouse horseradish peroxidase (HRP), BS12478, goat anti-rabbit HRP, BS13278, BioWorld, Irving, Texas, USA) was added. The specific antibody–antigen complexes were detected using the potent electrochemiluminescence kit (Multi Sciences, China). Immunoreactive bands on the membranes were quantified using the GeneTools software from SynGene (Bangalore, Karnataka, India).
Statistical analysis
Experiments were conducted in triplicate for each dose group. Statistical analysis was performed by one-way analysis of variance followed by the least significant difference test or Dunnett’s test. The bivariate correlations between levels of cellular oxidative damage and HSPA1A or HO-1 were evaluated using the Spearman rank test. In all tests, differences were considered significant at p < 0.05. All the data analysis was carried out using the statistical analysis software SPSS 12.0 for Windows (SPSS Inc., Chicago, Illinois, USA).
Results
Characterization of Ag NPs
The primary particles of Ag NPs detected by TEM were spherical and approximately 20–50 nm in diameter (Figure 1(a) to (c)). After sonication in culture medium supplemented with 10% FBS or deionized water, their hydrodynamic diameters, as determined by DLS, ranged from 8 nm to 43 nm. In this study, we prepared the particles by sonication in DMEM supplemented with 10% FBS, or deionized water for 20 min, and the hydrodynamic diameters of Ag NPs were 26.1 ± 10.4 and 18.4 ± 8.03 nm, respectively. Figure 1(d) represents the frequency of size distribution of Ag NPs in DMEM supplemented with 10% FBS and deionized water.
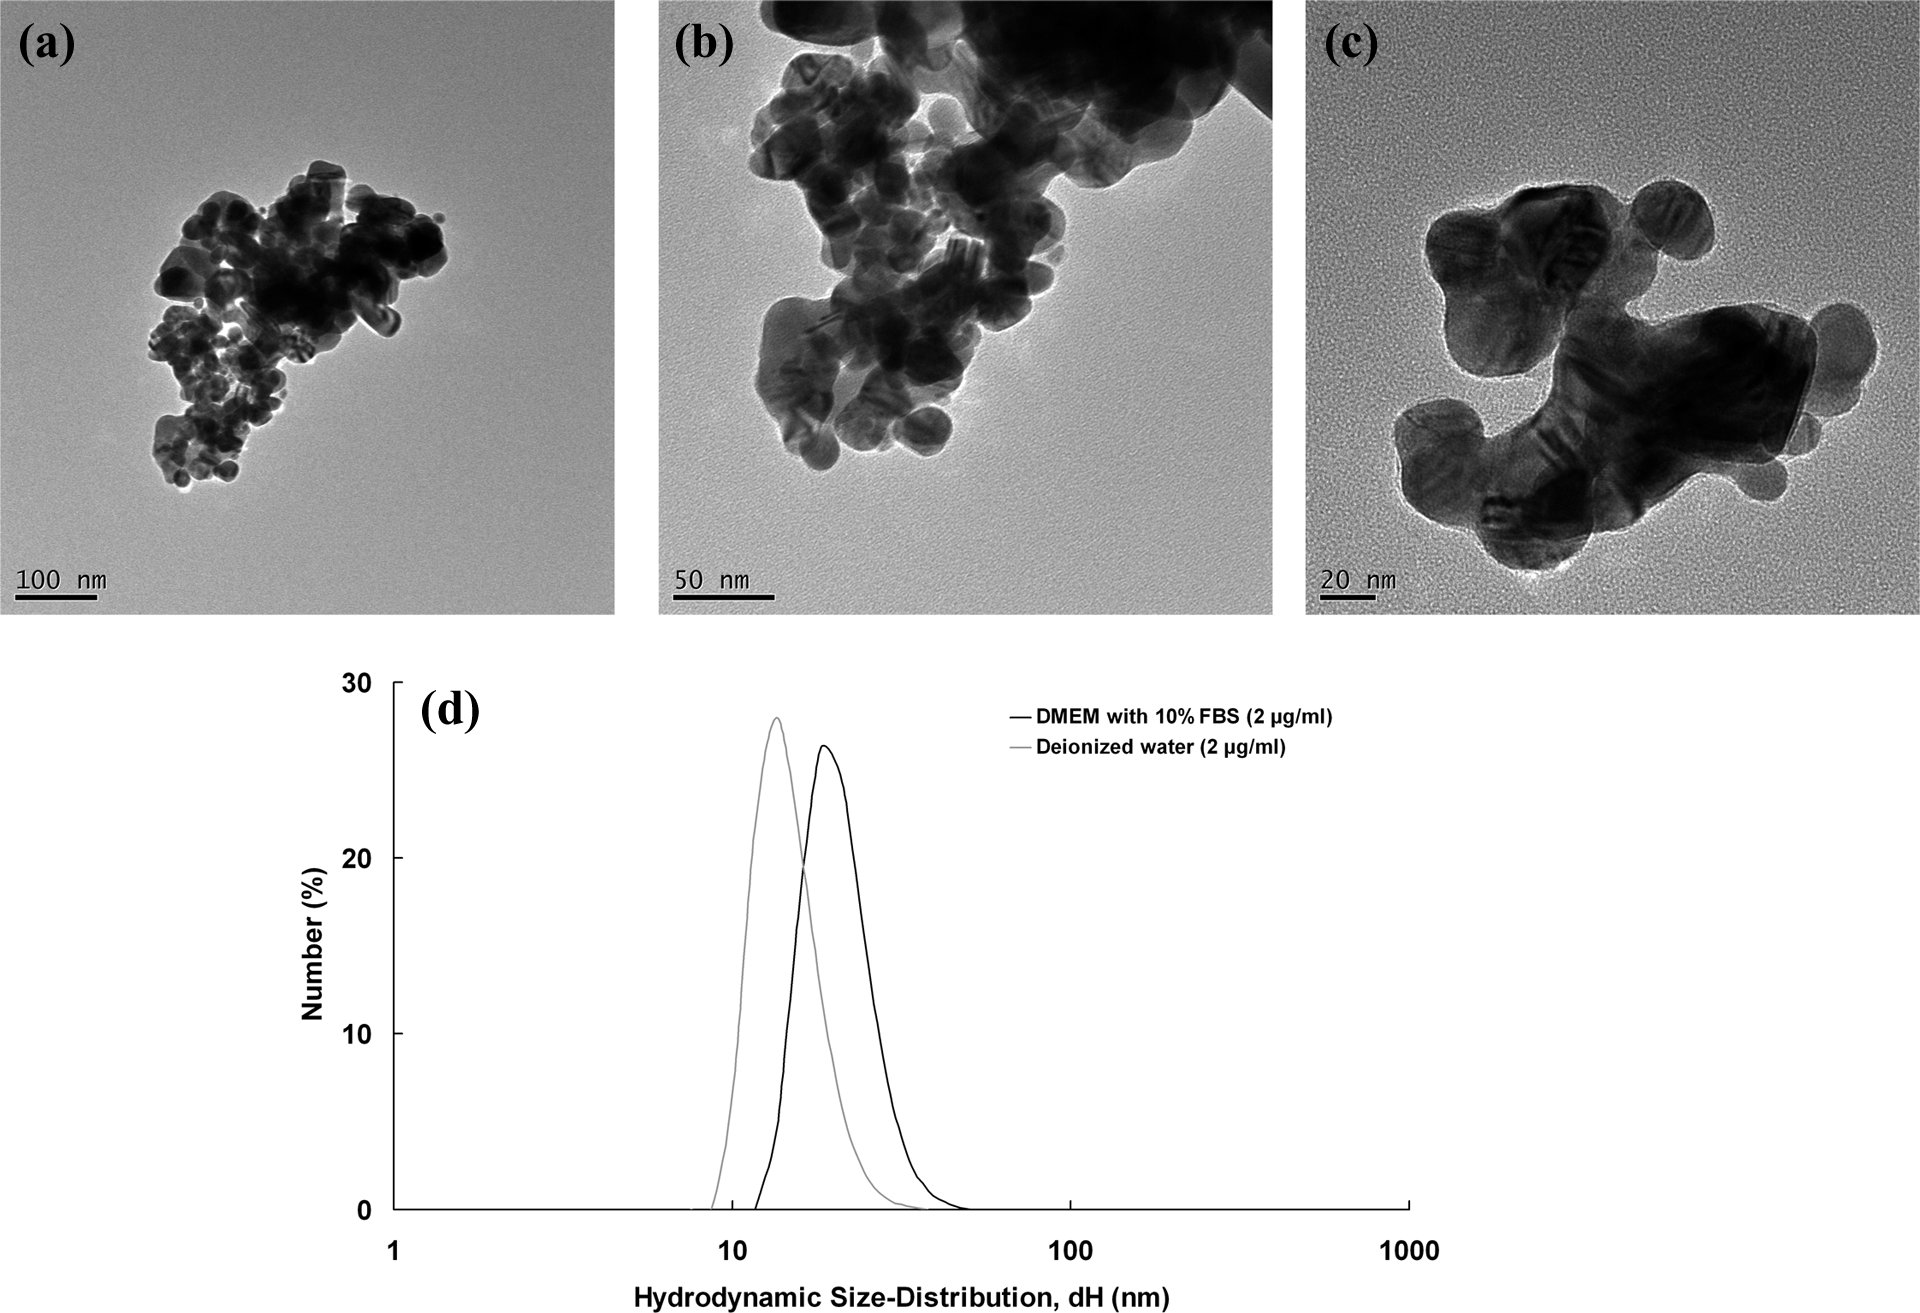
Characterization of Ag NPs; (a) to (c) represents the TEM characterization of Ag NPs. Particles were spotted onto 300 mesh holey carbon-coated copper grids and dried prior to TEM imaging. Imaging was conducted in high-resolution mode at 100 kV. (d) Represents frequency of size distribution of Ag NPs in DMEM supplemented with 10% FBS and deionized water, and the hydrodynamic diameters of Ag NPs were 26.1 ± 10.4 and 18.4 ± 8.03 nm, respectively. TEM; transmission electron microscopy; Ag NPs: silver nanoparticles; DMEM: Dulbecco’s modified eagle’s medium; FBS: fetal bovine serum.
Cytotoxic effects of Ag NPs on A549 and HepG2 cells
The MTT assay showed that, for A549 cells, the cell viability declined to 64% at 200 μg/ml of Ag NPs (p < 0.01), but with 100 μg/ml Ag NPs, significant decrease in cell viability was also observed (p < 0.05; Figure 2). Only at the highest concentration of Ag NPs tested (200 μg/ml), the HepG2 cell viability was significantly decreased to 88% of the control (p < 0.05; Figure 2).

Cell viability in A549 and HepG2 cells exposed to Ag NPs was determined by MTT assay. The cells were treated with increasing concentrations of Ag NPs (12.5, 25, 50, 100, and 200 μg/ml) for 24 h. The untreated cells were 100% viable control. The results are expressed as mean ± SD of three separate experiments for each data point. *p < 0.05; **p < 0.01: values are significantly different from the untreated controls. Ag NPs: silver nanoparticles; MTT: 3-(4,5-dimethylthiazol-2-yl)-2,5-diphenyltetrazolium bromide.
Lipid peroxidation induced by Ag NPs
As compared to the control, the MDA concentration in A549 cells showed a 4.1-fold increase at 200 μg/ml of Ag NPs, and a 3.4-fold increase in MDA concentration was also observed in HepG2 cells at the same Ag NPs dose (Figure 3(a)). As shown in Figure 3(b), 8-epi-PGF2α concentrations increased significantly in a dose-dependent manner in both A549 and HepG2 cells treated with different concentrations of Ag NPs (all p < 0.01).
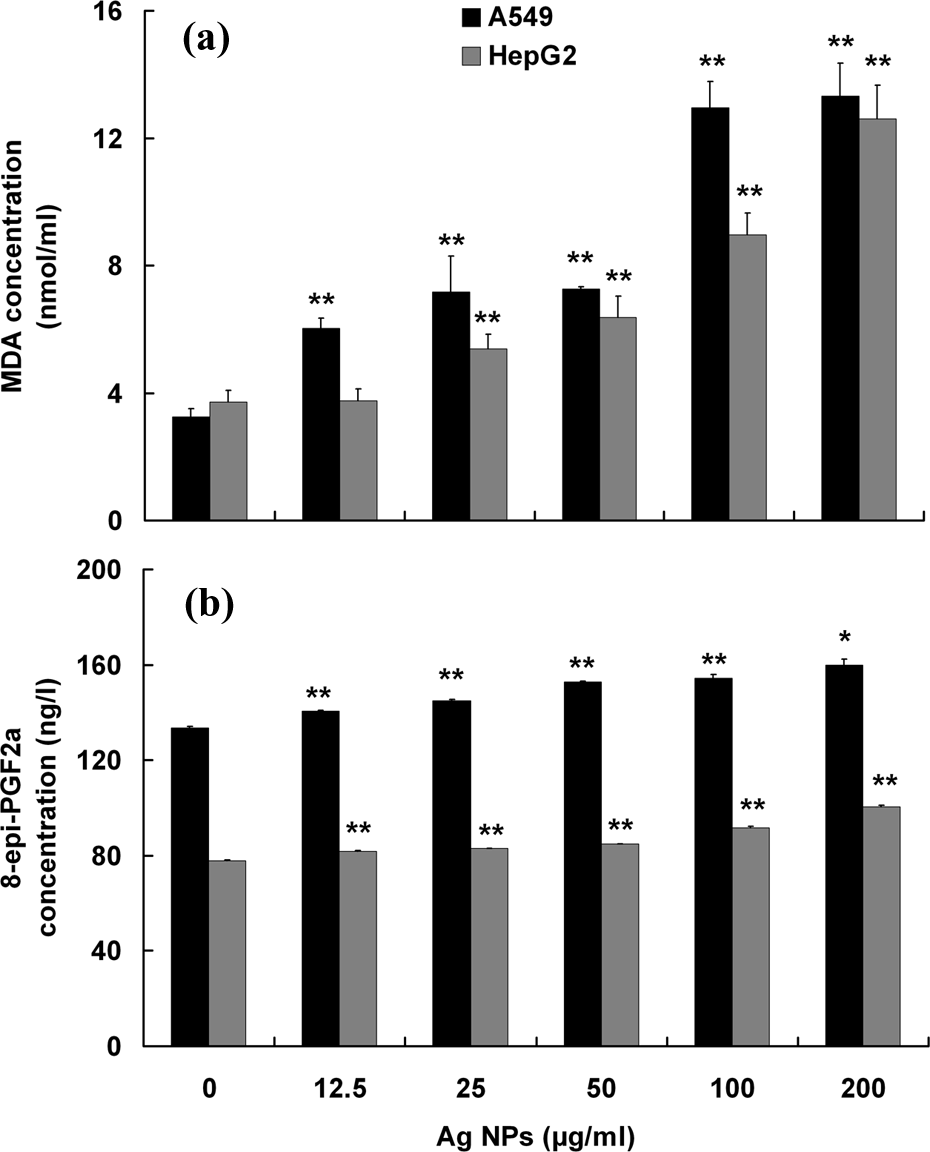
Levels of lipid peroxidation in A549 and HepG2 cells exposed to Ag NPs. The cells were treated with increasing concentrations of Ag NPs (12.5, 25, 50, 100, and 200 μg/ml) for 24 h. Levels of lipid peroxidation were expressed as MDA (a) and 8-epi-PGF2α concentration (b) which were determined by MDA assay and 8-epi-PGF2α ELISA kits, respectively. The results are expressed as mean ± SD of three separate experiments for each data point. *p < 0.05; **p < 0.01: values are significantly different from the untreated controls. Ag NPs: silver nanoparticles; MDA: malondialdehyde; ELISA: enzyme-linked immunosorbent assay.
Oxidative DNA damage induced by Ag NPs
At 200 μg/ml, Ag NPs induced a 3.9-fold increase of 8-oxo-dG level compared with the control in A549 cells (Figure 4). In HepG2 cells, levels of 8-oxo-dG also significantly increased as the concentrations of Ag NPs increased from 25 μg/ml to 200 μg/ml (Figure 4).
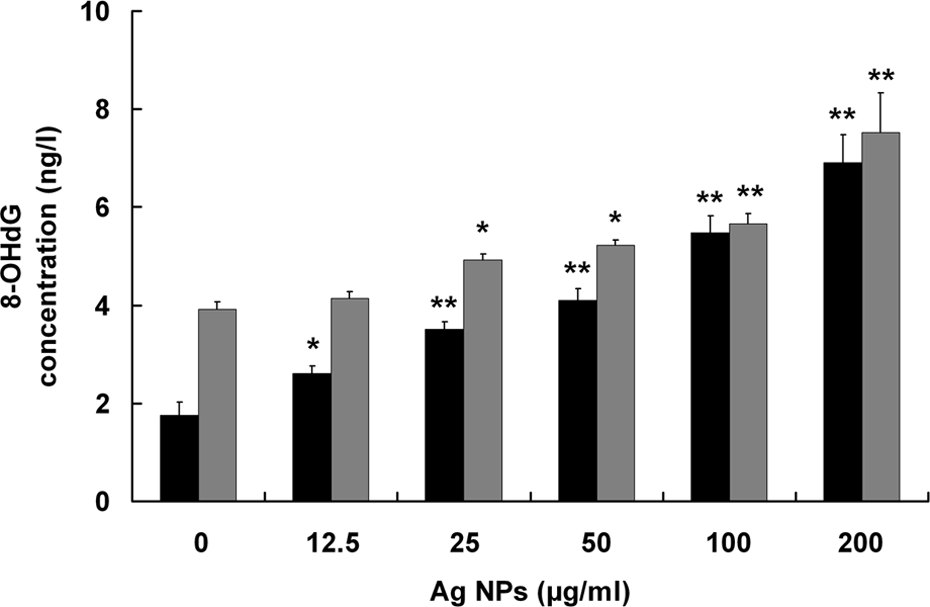
Levels of oxidative DNA damage in A549 and HepG2 cells exposed to Ag NPs determined by 8-oxo-dG ELISA kits. The cells were treated with increasing concentrations of Ag NPs (12.5, 25, 50, 100, and 200 μg/ml) for 24 h. Levels of oxidative DNA damage were expressed as 8-oxo-dG concentration. The results are expressed as mean ± SD of three separate experiments for each data point. *p < 0.05; **p < 0.01: values are significantly different from the untreated controls. Ag NPs: silver nanoparticles; ELISA: enzyme-linked immunosorbent assay; 8-oxo-dG: 8-hydroxy-2′-deoxyguanosine.
Upregulation of HSPA1A and HO-1 protein
The Ag NPs induced low but detectable increases in HSPA1A protein expression (Figure 5(a) and (e)) and a significant dose-dependent increase in HO-1 protein expression with a 2.2-fold of the control at the highest concentration tested in A549 cells (Figure 5(b) and (f)). In HepG2 cells, 100 μg/ml of Ag NPs induced a 2.6-fold increase in HSPA1A expression (Figure 5(c) and (g)), and a much higher (ninefold) expression of HO-1 protein (Figure 5(d) and (h)) as compared to control.

Levels of HSPA1A and HO-1 expression in A549 and HepG2 cells exposed to Ag NPs. The cells were treated with increasing concentrations of Ag NPs (12.5, 25, 50, 100, and 200 μg/ml) for 24 h. HSPA1A and HO-1 expression in A549 ((a) and (b)) and HepG2 ((c) and (d)) were detected by Western blot analysis using a chemiluminescence system. β-actin was used as the loading control. Images of the chemiluminescence are representative of three independent repeats. Levels of HSPA1A and HO-1 in A549 ((e) and (f)) and HepG2 ((g) and (h)) were determined by densitometric analysis. The results are expressed as mean ± SD of three separate experiments for each data point. *p < 0.05; **p < 0.01: values are significantly different from the untreated controls. Ag NPs: silver nanoparticles; HSP: heat shock protein; HO-1: heme oxygenase 1.
Correlations between levels of HSPA1A and HO-1 and cellular oxidative damage
Significant positive correlations between the HSPA1A and HO-1 expression and oxidative damage were observed as shown in Table 1. In Ag NPs-treated A549 cells, both the levels of HSPA1A and HO-1 were positively correlated with MDA (r = 0.926, 0.907, all p < 0.01), 8-epi-PGF2α (r = 0.941, 0.944, all p < 0.01), and 8-oxo-dG concentrations (r = 0.957, 0.966, all p < 0.01; Table 1). In HepG2 cells treated with Ag NPs, similar positive correlations were found between levels of HSPA1A and HO-1 and MDA (r = 0.725, 0.769, all p < 0.01), 8-epi-PGF2α (r = 0.761, 0.742, all p < 0.01), and 8-oxo-dG concentration (r = 0.771, 0.756, all p < 0.01; Table 1).
Correlations between levels of HSPA1A and HO-1 and cellular oxidative damage in A549 and HepG2 cells treated with Ag NPs.a

Ag NPs: silver nanoparticles; MDA: malondialdehyde; 8-oxo-dG: 8-hydroxy-2′-deoxyguanosine; HSP: heat shock protein; HO-1: heme oxygenase 1.
aThe bivariate correlations between levels of cellular oxidative damage and HSPA1A or HO-1 were evaluated using Spearman rank test.
Discussion
Oxidative stress induced by Ag NPs in mammalian cell lines has been reported in several previous studies. Ag NPs in diameter of 1–100 nm could induce significant intracellular ROS production in NIH3T3 and HCT116 cells. 27 When human liver cells were treated with Ag NPs (5–10 nm), oxidative damage indicated by ROS generation, lipid membrane peroxidation, and suppression of reduced glutathione were observed. 28 It is therefore suggested that the in vitro oxidative stress induced by Ag NPs is possibly mediated by ROS-dependent pathways. 8 ROS are chemical species that are produced as byproducts of cellular oxygen metabolism. The abnormal accumulation of ROS in cells could result in oxidative damage in forms of lipid peroxidation, protein oxidation, and oxidative DNA damage. 29
In the present study, Ag NPs-induced oxidative damage were observed in A549 and HepG2 cells as indicated by dose-dependent increases in MDA, 8-epi-PGF2α, and 8-oxo-dG levels associated with an increased cytotoxicity. MDA, one of the final products of polyunsaturated fatty acids peroxidation in cells, is commonly known as a marker of oxidative stress. Increased MDA levels by Ag NPs treatment have been reported in several previous studies. 30 At the dose of 200 μg/ml, Ag NPs treatment brought 4.1- and 3.4-fold increases in MDA levels over the control in A549 and HepG2 cells, respectively. 8-epi-PGF2α, a nonenzymatic peroxidation product of arachidonic acid, 31 is generally recognized as a sensitive and reliable biomarker of cell membrane lipid peroxidation. 32 In this study, Ag NPs induced a low but detectable dose-dependent increase in 8-epi-PGF2α concentration, which was consistent with previous studies. 28 8-oxo-dG, one of the major products of DNA oxidation and a marker of oxidative stress, also showed a strong dose-dependent induction up to 4× and 2× the control level at the highest Ag NPs dose in A549 and HepG2 cells, respectively. Compared with the HepG2 cells, the A549 cells exhibited a more severe oxidative damage after Ag NPs exposure, possibly due to their differences in metabolic capacity of Ag NPs. Changes in MDA, 8-epi-PGF2α, and 8-oxo-dG indicated an oxidative mechanism for Ag NPs toxicity, as suggested in previous studies. 8
HSPA1A, also known as HSP70, is one of the prominent proteins expressed following various environmental assaults including heat, heavy metals, or other air pollutants. 33,34 Because of its stress responsiveness, HSPA1A has been suggested to be a sensitive biomarker and an important component of cellular defense mechanisms in human cells after exposure to many environmental stressors. 18 HO-1 is an inducible enzyme that exerts its protective or adaptive effects under conditions of oxidative stresses by catalyzing the degradation of prooxidant heme into potent antioxidant CO and bilirubin. 22,23 The basal expression of HO-1 is low in most cells and tissues but can be highly inducible by a wide range of oxidative stresses such as hypoxia, cytokines, and heavy metals. 22,35 –37
In the present study, HSPA1A was found significantly inducible in two human cell lines by the Ag NPs stress. HO-1, another important HSP in cytoprotection against oxidative stress, was also significantly increased in a dose-dependent manner. These results, together with those from other studies confirmed the potential of Ag NPs in activating HSPs both in vivo and in vitro. 30,38,39 In addition, Ag NPs could induce a higher level of HSPA1A and HO-1 activation by Ag NPs occurred in HepG2 cells than that in A549 cells. A positive linear correlation was disclosed between levels of HSPA1A and HO-1 and oxidative damage in A549 and HepG2 cells, suggesting that both HSPA1A and HO-1 play an important role in cytoprotection against Ag NP-induced oxidative damage. Since Ag NPs treatment induced a higher level of HO-1 than that of HSPA1A in both A549 and HepG2 cells, the HO-1 activation could be a more potential biomarker of Ag NPs-induced oxidative stress in future studies.
In conclusion, our study showed that the Ag NPs could induce significantly oxidative damage in A549 and HepG2 cells indicated by increased levels in MDA, 8-epi-PGF2α, and 8-oxo-dG, which were positively correlated with levels of HSPA1A and HO-1 activation. In addition to products of oxidative stress such as MDA and 8-oxo-dG, HSPs can be used as potential biomarkers in nanotoxicity assessment, especially HO-1. However, further studies are needed to fully understand mechanisms underlying Ag NPs toxicity.
Footnotes
Authors’ Note
Authors LX and JW contributed equally to this work.
Conflict of interest
The authors declared no conflicts of interest.
Funding
This work was supported by the Science Foundation of China (81320003) and The Priority Academic Program Development of Jiangsu Higher Education Institutions (PAPD) to JT, and the Natural Science Foundation of the Jiangsu Higher Education Institutions of China (13KJB330008) and China Postdoctoral Science Foundation (2013M541728) to LX.