
Abstract
This study aims to assess the metabolomic profile and related histopathological outcomes of rat plasma after chronic low-dose exposure to dichlorvos (DDVP). A total of 120 male Wistar rats were treated with 0, 2.4, 7.2, and 21.6 mg/kg of body weight/day DDVP continuously for 24 weeks by drinking water. Rat plasma samples were collected at different time-points to measure the metabolomic profiles by ultra-performance liquid chromatography–mass spectrometry (UPLC-MS). Liver tissue analysis was performed to correlate histopathological outcome status to plasma metabolomics. Significant changes in some of the metabolites were found in all the treated groups compared with the control group. LysoPC (15:0/0:0), LysoPC (16:0/0:0), LysoPC (17:0/0:0), LysoPC (0:0/18:0), sphingosine, sphinganine, C16 sphinganine, C17 sphinganine, and arachidonic acid were decreased in the treated groups. LysoPE (16:0/0:0) was increased after dosing with DDVP. Histopathological test outcomes coincided with the plasma metabolomic-profile analysis results obtained by UPLC-MS. The livers were damaged following chronic exposure to DDVP. Abnormal changes in some lipids in the plasma, such as LysoPC (0:0/18:0), were closely related to liver dysfunction. Therefore, metabolomic analysis provides the unique advantages of unveiling the mechanisms of DDVP.
Introduction
Dichlorvos (DDVP) is a classic organophosphorous insecticide that is effectively used against mushroom flies, aphids, spider mites, caterpillars, thrips, and white flies pestilential to fruits and vegetable crops grown in greenhouses or outdoors. 1 DDVP is widely used in agriculture and public health programs, 2 especially in China. The uncontrolled use of this insecticide in agriculture and public health operations has increased the danger of ecological imbalance and poisoning is common. Thus, several nontargeted organisms have become victims. 3 This phenomenon has led to the widespread exposure of humans to DDVP, which may occur via air, water, or food. The primary route of DDVP exposure for nonoccupational groups is through residues in food and water characterised by a long-term, low-dose oral intake. Therefore, more research on the adverse effects of this type of exposure on health needs to be conducted.
DDVP has been used for 40 years, and the various effects of the insecticide on humans and experimental animals have been studied in recent decades. DDVP has been reported to exert its primary pharmacological and toxicological effects through the inhibition of acetylcholinesterase, an enzyme required for the transmission of impulses across the cholinergic synapse. 4,5 Other toxicity aspects of DDVP have also been studied extensively. Some articles reported that DDVP affects neutrophil function as well as macrophage and antibody production and generates immunotoxicity. 6 –8 In animal reproductive toxicity studies, DDVP can decrease sperm motility and sperm aneuploidy. 9 –11 Some articles reported that DDVP can affect aminotransferase activity in rat tissue 12 by bringing its toxicity through the depletion of antioxidant systems 13 and by impairing mitochondrial energy metabolism. 14 Furthermore, some studies showed that DDVP is a route-dependent carcinogen. 15
Although the toxicity of DDVP has been well studied, considerable uncertainties remain on whether low-level, long-term DDVP exposure has adverse effects on animals and humans in terms of metabolism. This situation may occur from the lack of adequate experimental conditions, such as funds, equipment, or sensitive and stable detection methods. Therefore, a new approach for studying the toxicity effects of low-level, long-term DDVP exposure is necessary.
Metabolomics is defined as ‘the quantitative measurement of the dynamic multi-parametric metabolic response of living systems to pathophysiological stimuli or genetic modification’. 16 The field has rapidly expanded in recent years. Metabolomics has the potential to impact a number of areas, including the identification of target organ toxicity and the evaluation of chemical toxicities. 17 –24 Metabolic profiling strategies, such as high-throughput spectral analysis by nuclear magnetic resonance spectroscopy or mass spectrometry (MS), enable a more comprehensive metabolic overview of complex organisms, making the simultaneous interpretation of biological systems possible. 16 The most advantageous property of time-of-flight MS is its capability of recording the intensities of any detected ion in a given area of interest at a microscopic scale. 25 To date, this method has not been successfully applied with any of the extract-based techniques routinely used in metabolic studies. In the recent years, liquid chromatography, particularly when coupled with MS, has been used as a very promising method for comprehensive metabolite profiling. 26 In addition, the development of ultra-performance liquid chromatography (UPLC) has made it possible to achieve higher resolutions, higher sensitivities, and rapid separations. 27
The no observable adverse effect level (NOAEL) denotes the level of exposure of an organism, found by experiment or observation, at which no biologically or statistically significant (e.g. alteration of morphology, functional capacity, growth, development, or life span) increase in the frequency or severity of any adverse effects is observed in the exposed animal compared with its appropriate control. In our previous study, metabolic profiles in rat urine were investigated using UPLC-MS. The results showed that the antioxidant system, kidney function, sex hormone metabolism, and glucose and fatty acid metabolisms were affected by DDVP. 28 The current study aims to analyse the metabolic profile of rat plasma exposed to DDVP at NOAEL level using the same method as that in the previous study. The systemic toxic processes induced by DDVP were also investigated.
Materials and methods
Chemicals and reagents
DDVP (95% purity) was obtained from Hebei New Century Chemical Co., Ltd (Hengshui, China). HPLC-grade methanol and acetonitrile were purchased from Dikma Science and Technology Co., Ltd (Canada). Distilled water was filtered using a Milli-Q system (Millipore, Billerica, Massachusetts, USA). Leucine encephalin was purchased from Sigma-Aldrich (St Louis, Missouri, USA).
Animal treatments
The experiments were performed on male Wistar rats weighing 180–220 g. A total of 120 rats were obtained from Vital River Laboratory Animal Technology Co., Ltd (Beijing, China). All animal experimentation was approved by the Institute of Zoology Animal and Medical Ethics Committee and was in accordance with the current Chinese legislation. The rats were housed and acclimatised to new surroundings for a week under a controlled temperature ranging between 20 and 24°C at a relative humidity of 50–60%, with a 12-h light–dark cycle. The rats were provided with standard AIN-93M diets.
After acclimatisation, the rats were randomly assigned to four groups (n = 30, each group was further randomly divided into six subgroups): the low-dose group, with oral treatment at 2.4 mg/kg·body weight (bw)/day (NOAEL); the middle-dose group, with oral treatment at 7.2 mg/kg·bw/day (three times NOAEL); the high-dose group, with oral treatment at 21.6 mg/kg·bw/day (nine times NOAEL); and the control group, with oral treatment of approximately the same volumes of drinking water. NOAEL was obtained after a 2-year study of toxicity and carcinogenicity and was acquired from the 1993 Toxicity Assessment of Dichlorvos Residues in Food, the Chemical Safety Information from Intergovernmental Organizations (INCHEM), and the World Health Organization/Food and Agriculture Organization Joint Meeting on Pesticide Residues (JMPR). Rats were continuously exposed to DDVP via drinking water given ad libitum for 24 weeks. DDVP was diluted in drinking water according to the respective doses of the treatment groups. A constant dosage was maintained by adjusting the DDVP concentration in the water twice a week for the first 8 weeks, and then once a week after 8 weeks until the end of the experiment. Daily water consumption of rats was fixed at 27 ± 3 mL on the first 4 weeks, 32 ± 2 mL between 5 and 8 weeks, and 40 ± 2 mL from 9 to 24 weeks.
Sample collection
Each subgroup (n = 5) was randomly selected from each dose group at 4, 8, 12, 16, 20, and 24 weeks after treatment, and anesthetised with pentobarbital via intraperitoneal injection. Blood samples were obtained from the aorta abdominalis before the rats were killed. Each blood sample was divided into two parts: the first portion was drawn and centrifuged for biochemical analysis. 28 The other portion was collected in 5 mL anticoagulant tubes. Tubes were gently shaken to mix the anticoagulant with the blood. The plasma was obtained through the centrifugation at 3000 r/min for 15 min. The plasma samples obtained were transferred into Eppendorf tubes and stored at −80°C for analysis.
Histopathology
The liver of each animal was excised for histopathological analysis immediately after blood collection. Liver samples were fixed in 10% formalin, processed into 4 μm paraffin sections, and stained with haematoxylin and eosin for histopathological assessment.
Sample preparation
Plasma samples were prepared for UPLC-MS analysis by methanol protein precipitation. Methanol (450 µL) was added to plasma (150 µL) and vortexed for 2 min followed by centrifuged at 12,000 r/min for 10 min, and the obtained supernatant was then transferred to a clean tube. The supernatant was dried using a Bath Nitrogen Blow Instrument (TTL-DCI, Beijing, China), reconstituted in 600 µL acetonitrile and water mixture (2:1, v/v), vortexed for 2 min, and then centrifuged at 12,000g for 10 min. The obtained supernatant was set aside until use for the UPLC–MS analysis.
Chromatography
Chromatographic separation was performed on a UPLC® BEH C18 column (100 × 2.1 mm2, i.d. 1.7 μm, Waters Corporation, Milford, Massachusetts, USA) using a Waters ACQUITY UPLC System (Waters Corporation). A 2-μL aliquot of the sample was injected into the column, which was maintained at 35°C. The UPLC mobile phase consisted of 0.1% formic acid in water (solvent A) and acetonitrile (solvent B). The gradient duration was 18 min at a constant flow rate of 0.35 mL/min. The metabolites were eluted using a linear gradient of 2% solvent B for 0.5 min, 2–20% solvent B for 0.5–1.5 min, 20–70% solvent B for 1.5–6 min, 70–98% solvent B for 6–10 min, 98% solvent B for 10–12 min, 98–2% solvent B for 12–14 min, and 2–98% solvent B for 14–16 min. A needle wash cycle was performed after every sample injection to remove sample remnants and to prepare the equipment for the next injection. In addition, the eluent was directly transferred to the MS in a split mode.
Mass spectrometry
MS analysis was conducted using a Waters Micromass Q-TOF (Quatropde Time-of-Flight) micro Mass Spectrometer (Manchester, United Kingdom) with electrospray ionisation (ESI) in positive and negative modes and a full-scan mode from m/z 50–1000 for 0–18 min. Nitrogen served as both the desolvation gas (650 L/h) and cone gas (50 L/h). The desolvation and source temperatures were set at 300 and 100°C, respectively. The capillary voltage was set to 3.0 kV in the positive ion mode and 2.8 V in the negative ion mode, and the cone voltage was set to 35 V. A lock spray was used to ensure the accuracy and reproducibility of all analyses. A lock mass of leucine encephalin was used via a lock spray interface at a flow rate of 10 μL/min for monitoring in the positive ([M + H]+ = 556.2771) and negative ion modes ([M − H]− = 554.2615). The lock spray frequency was set at 0.48 s, and the lock mass data were averaged over 10 scans for correction.
Data analysis
Statistical analysis was performed by one-way analysis of variance using SPSS version 13.01 S (Beijing Stats Data Mining Co., Ltd, China). A p < 0.05 was considered statistically significant.
Raw UPLC/MS data were analysed using Micromass MarkerLynx Application Version 4.1 (Waters Corporation), which allowed data deconvolution, alignment, and reduction to create a table of mass and retention time pairs with the associated intensities for all the peaks detected. The parameters were as follows: mass window, 0.05 Da; RT window, 0.2 min; mass tolerance, 10 mDa; high and low mass, 1000 and 50, respectively; and initial and final retention times, 0.5 and 14 min, respectively. The data matrix containing peak numbers (retention time–m/z pairs), sample names, and ion intensities were introduced into the EZ Info software for multivariate statistical analysis.
Low-molecular weight metabolites were detected as chromatographic peaks in the total ion chromatographic chromatograms after the analyses. The ionic spectra of potential biomarkers were matched with the structural data of metabolites acquired from the Human Metabolome Database (HMDB) or Chem Spider using the Mass Fragment software (Waters Corporation) for biomarker identification, which was conducted by comparing the retention time and MS spectra with credible chemical standards. Furthermore, the mass spectra of the biomarkers were interpreted using relevant biochemical databases, such as LIPID MAPS database.
Results
Body weight and histopathology
The body weights of rats in all the treated groups during the treatment did not show any significant changes (Figure 1).

Body weights of rats exposed to DDVP (n = 5 per group). During the treatment, the body weights of rats in all the treated groups did not show any significant changes. DDVP: dichlorvos.
The hepatic lobules of the rats in the control and low-dose groups were complete and clear. The hepatic cords were neat, and the hepatocytes were normal. Fatty degeneration and vacuolar degeneration in the liver cytoplasm were present in the middle-dose group after 12 weeks of dosing. Fatty degeneration, vacuolar degeneration in liver cytoplasm, and liver cell necrosis were present in the high-dose group after 12 weeks of dosing (Figure 2). No significant histopathological changes were found in liver tissues of rats from the low-dose group.

Histopathology of liver sections collected from adult Wistar rats treated with DDVP for 12 weeks. Representative photomicrographs of H&E-stained formalin-fixed liver sections from control group or DDVP-treated animals. The rats were given DDVP at a dosage of 0 mg/kg/day (a), 2.4 mg/kg/day (b), 7.2 mg/kg/day (c), and 21.6 mg/kg/day (d) (H&E, ×200). DDVP: dichlorvos; H&E: haematoxilin–eosin.
Metabolic profiles of plasma
The complexity of the plasma sample makes the separation very difficult. Consequently, samples from both the control and treated animals were analysed using UPLC-MS in both positive and negative ionisation modes to increase the resolution and sensitivity. The total ion chromatographic chromatograms did not reveal clear differences between the profiles of the control and treated animals. More subtle changes were observed using a pattern recognition approach, such as partial least squares discriminant analysis (PLS-DA). The PLS-DA scores are given in Figure 3(a) to (f). The plots for the middle- and high-dose groups clearly deviated from that of the control group at week 4, and the plots for the low-dose group completely separated after 12 weeks of treatment. The plots for the middle- and high-dose groups, however, did not completely deviate at week 12, but a clear separation between the treated groups and the control group was observed at week 24.
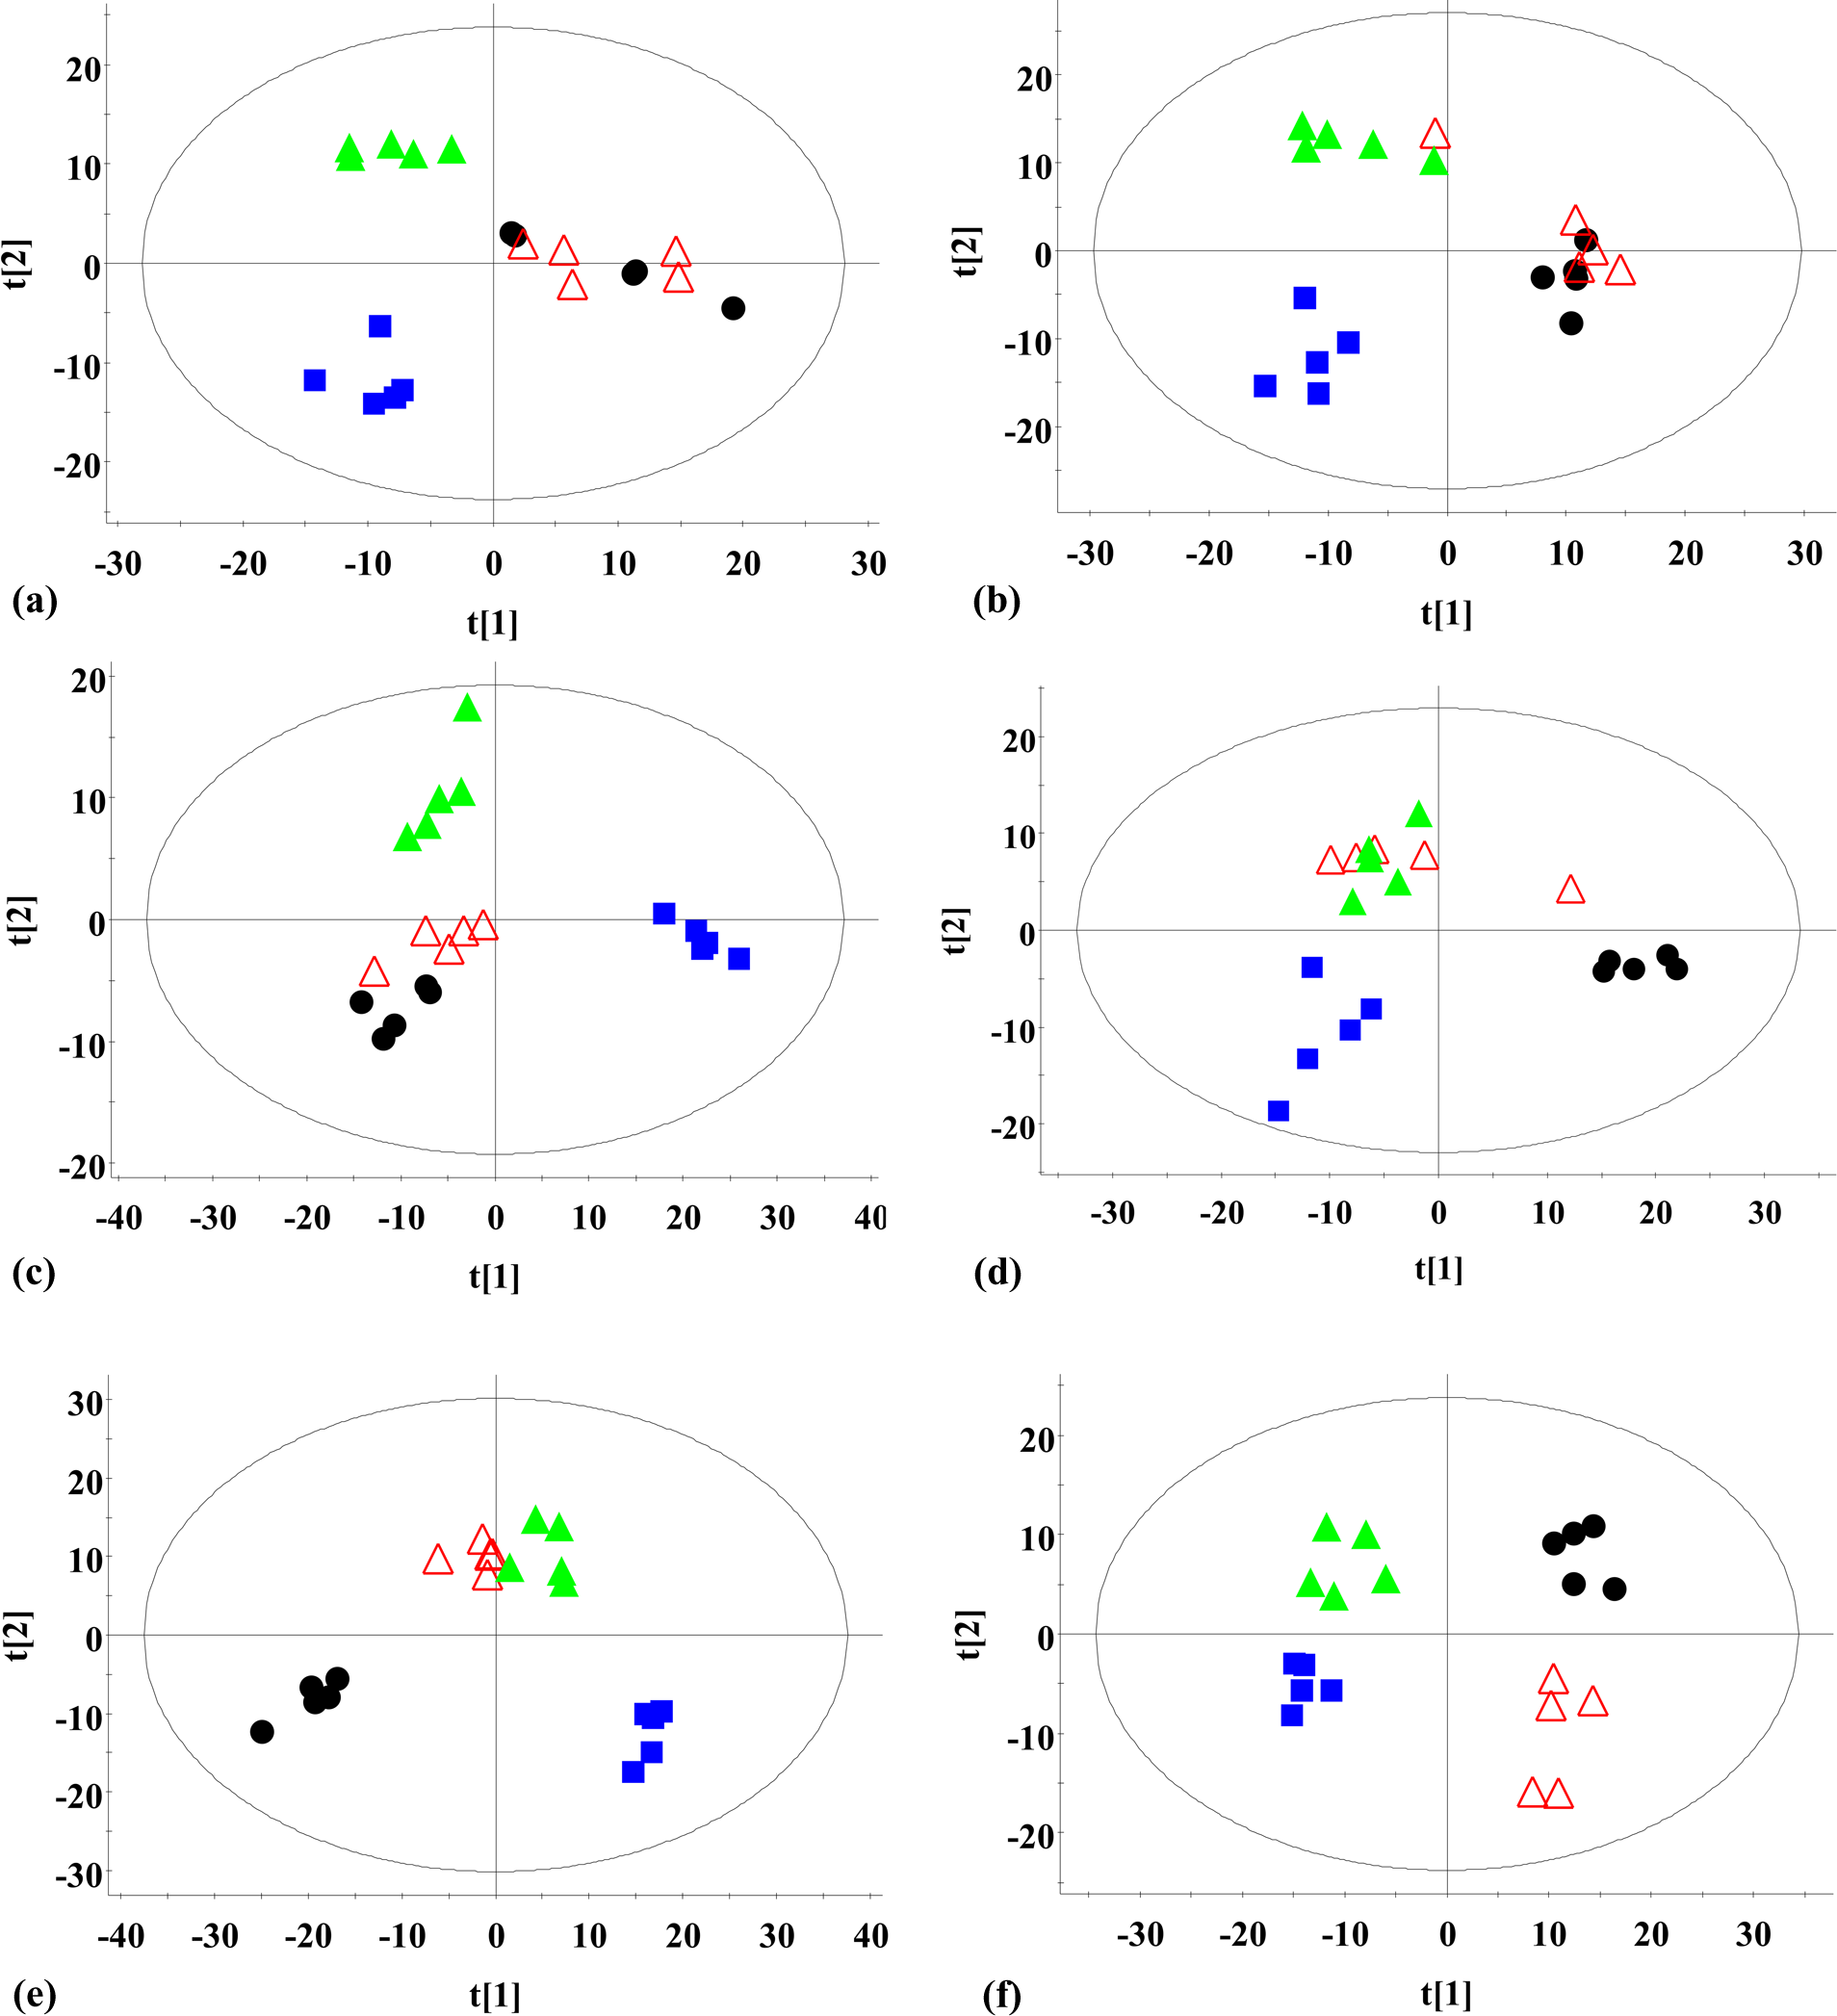
PLS-DA score plots ((a) to (f)) based on the UPLC-MS data of plasma from rats-treated with DDVP for different treatment times. (a) Rats treated with DDVP for 4 weeks; (b) rats treated with DDVP for 8 weeks; (c) rats treated with DDVP for 12 weeks. (d) rats treated with DDVP for 16 weeks; (e) rats treated with DDVP for 20 weeks; (f) rats treated with DDVP for 24 weeks. n = 5 per group. Filled circle: control group (0 mg/kg); open triangle: low-dose (2.4 mg/kg) group; filled triangle: middle-dose (7.2 mg/kg) group; filled square: high-dose (21.6 mg/kg) group; DDVP: dichlorvos; PLS-DA: partial least squares discriminant analysis; UPLC-MS: ultra-performance liquid chromatography–mass spectrometry.
All analysis ions were arranged in descending order according to the variable important projection values. Variables with values above 1.0 and those that were dominant in the loading plots were first selected. Based on the results, some ions between the treated and the control groups showed significant differences. These ions strongly influenced the patterns of different treatment groups in the score plot. They may be biomarker candidates reflecting metabolic differences. The biomarkers were tentatively identified based on accurate mass measurements via ESI-TOF-MS and comparison of the theoretical to the observed isotopic patterns, metabolite database, or to authentic standards for biomarker identification. Thus, the 10 metabolites (three from the negative mode and seven from the positive mode) were previously identified based on the aforementioned methods (Table 1). Significant changes in some of the metabolites were found in the treated groups compared with the control group. LysoPC (15:0/0:0), LysoPC (16:0/0:0), LysoPC (17:0/0:0), LysoPC (0:0/18:0), sphingosine, sphinganine, C16 sphinganine, C17 sphinganine, and arachidonic acid (AA) were decreased in the treated groups. LysoPE (16:0/0:0) was increased after dosing with DDVP. The specific changes in the metabolites at different time-points after DDVP treatment are presented in Table 2.
Potential biomarkers of toxicity induced by dichlorvos.

ESI: electrospray ionisation; MS: mass spectrometry; ID: identification.
aMetabolite identification method is indicated.
bIons were identified in comparison with the metabolites of the LIPID MAPS database.
Change in the plasma metabolites from rats treated with dichlorvos compared with control for different time-points and doses.

ESI: electrospray ionisation; ↓: significantly decreased when compared with control group at p < 0.05; ↓↓: significantly decreased compared with control group at p < 0.01 (one-way analysis of variance); ↑: significantly increased when compared with control group at p < 0.05; ↑↑: significantly increased when compared with control group at p < 0.01 (one-way analysis of variance).
Discussion
Global profiling is recognised to provide reliable information on biological responses to xenobiotics through the analysis of endogenous metabolites. 29 In our study, an UPLC-based metabolomic analysis was performed to detect the changes in rat plasma samples treated with DDVP. The clustering of the treated groups and the control group were separated clearly via PLS-DA (Figure 3(a) to (f)). Thus, the metabolic profiles changed following the exposure to different DDVP doses at different time-points. Moreover, the PLS-DA plots for the treated groups gradually deviated from the control group with increasing DDVP dosage and treatment time.
The metabolites that significantly contributed to this discrimination were identified through MS analysis, including AA, lysophospholipids, and sphingolipids. AA was decreased significantly at all six time-points in the high-dose group and was reduced significantly at 12 weeks in the middle-dose group. AA, a derived eicosanoid belonging to a complex family of lipid mediators, regulates a wide variety of physiological responses and pathological processes. AA was metabolised into prostaglandins E1 (PGE1) and E2 (PGE2), respectively. PGE1 or PGE2 injections in the rat liver reportedly prevents toxicity induced by carbon tetrachloride, whereas treatment with AA or PGE2 clearly prevented the genetic expression of S14, a lipogenesis-related nuclear protein, and fatty acid synthase in rat hepatocytes. 30 AA reduction may lead to lipogenesis in rat hepatocytes and cause lipid metabolism disorders in the liver. Thus, a decrease in AA is detrimental to liver health. The decrease in AA in our study may be an indicator of liver dysfunction.
The plasma levels in some membrane lipid bilayers, including lysophosphatidyl ethanolamines, lysophosphatidylcholines (LPCs), and sphingomyelins, were significantly changed. LysoPE (16:0/0:0), one kind of lysophosphatidyl ethanolamine, increased significantly at 16 weeks after the administration of 2.4 and 7.2 mg/kg DDVP and at 12 weeks after the administration of 21.6 mg/kg DDVP. Lysophosphatidyl ethanolamine is important in membrane structure and energy reserves. LysoPE (16:0/0:0) was increased after the massive destruction of membranes, as indicated by cell death observed during the histological examination of the livers. 31 Thus, an increase in LysoPE (16:0/0:0) following the treatment with DDVP suggests that DDVP affects liver cells.
LPC is the major component of oxidised low-density lipoproteins and plays a role in the pathophysiology of atherosclerosis. Circulating levels of LPC in patients with sepsis have been shown to be reduced and to be inversely correlated with patient outcome. 32 This protective effect is attributed to the ability of LPC to modulate inflammatory response. LPC increases bacterial clearance and reduces neutrophil deactivation and tumour necrosis facto-α and interleukin-1b levels. Gonzalez et al. 31 found that some serum metabolites can signal the degree of cell death that occurred during acute liver injury using UPLC-MS/MS-based metabolomics. The highest correlations (ρ > 0.91, p < 0.001) were observed for long-chain fatty acids containing lipids, such as LysoPC (0:0/18:0), these modified metabolites constitute a very sensitive method of establishing the degree of liver cell death. LysoPC (15:0/0:0), LysoPC (16:0/0:0), LysoPC (17:0/0:0), and LysoPC (0:0/18:0) were decreased in the DDVP-treated groups, indicating that DDVP affects the health of organs, especially the liver.
Sphingolipids are ubiquitous membrane constituents of all eukaryotic cells. Their metabolites have important physiological functions, including the regulation of cell growth and survival. Sphingosine, sphinganine, C16 sphinganine, and C17 sphinganine all have sphingoid bases and belong to the sphingolipid metabolite family. Sphingosine can be phosphorylated at the primary hydroxyl by Sph kinases (SphKl or SphK2), forming sphingosine-1-phosphate (S1P). Sphinganine 1-phosphate is phosphorylated and degraded by sphinganine in as shown in Figure 4. 33 S1P and sphinganine 1-phosphate is important for the reparability of impaired cells. S1P, in particular, is well-known for its antiapoptotic and endothelial cell-protective properties to counteract against ischemia reperfusion injury and inflammation. Sphinganine 1-phosphate markedly inhibited liver necrosis and apoptosis at 24 h after liver hepatic ischemia and reperfusion. The mechanism of the protective effect was that sphinganine 1-phosphate preserved the F-actin cytoskeleton, improved vascular integrity, and reduced neutrophil infiltration of the liver. Thus, sphinganine 1-phosphate may be considered a promising pharmacological strategy for diagnosing and preserving liver function. 34 In this study, the concentrations of sphingosine, sphinganine, C16 sphinganine, and C17 sphinganine were markedly reduced after dosing with DDVP. According to the sphingolipid biosynthetic pathway (Figure 4), the decreases in sphingosine, sphinganine, C16 sphinganine, and C17 sphinganine may indicate reductions in S1P and sphinganine 1-phosphate. The decreases in sphingosine, sphinganine, C16 sphinganine, and C17 sphinganine exacerbated hepatic injury.
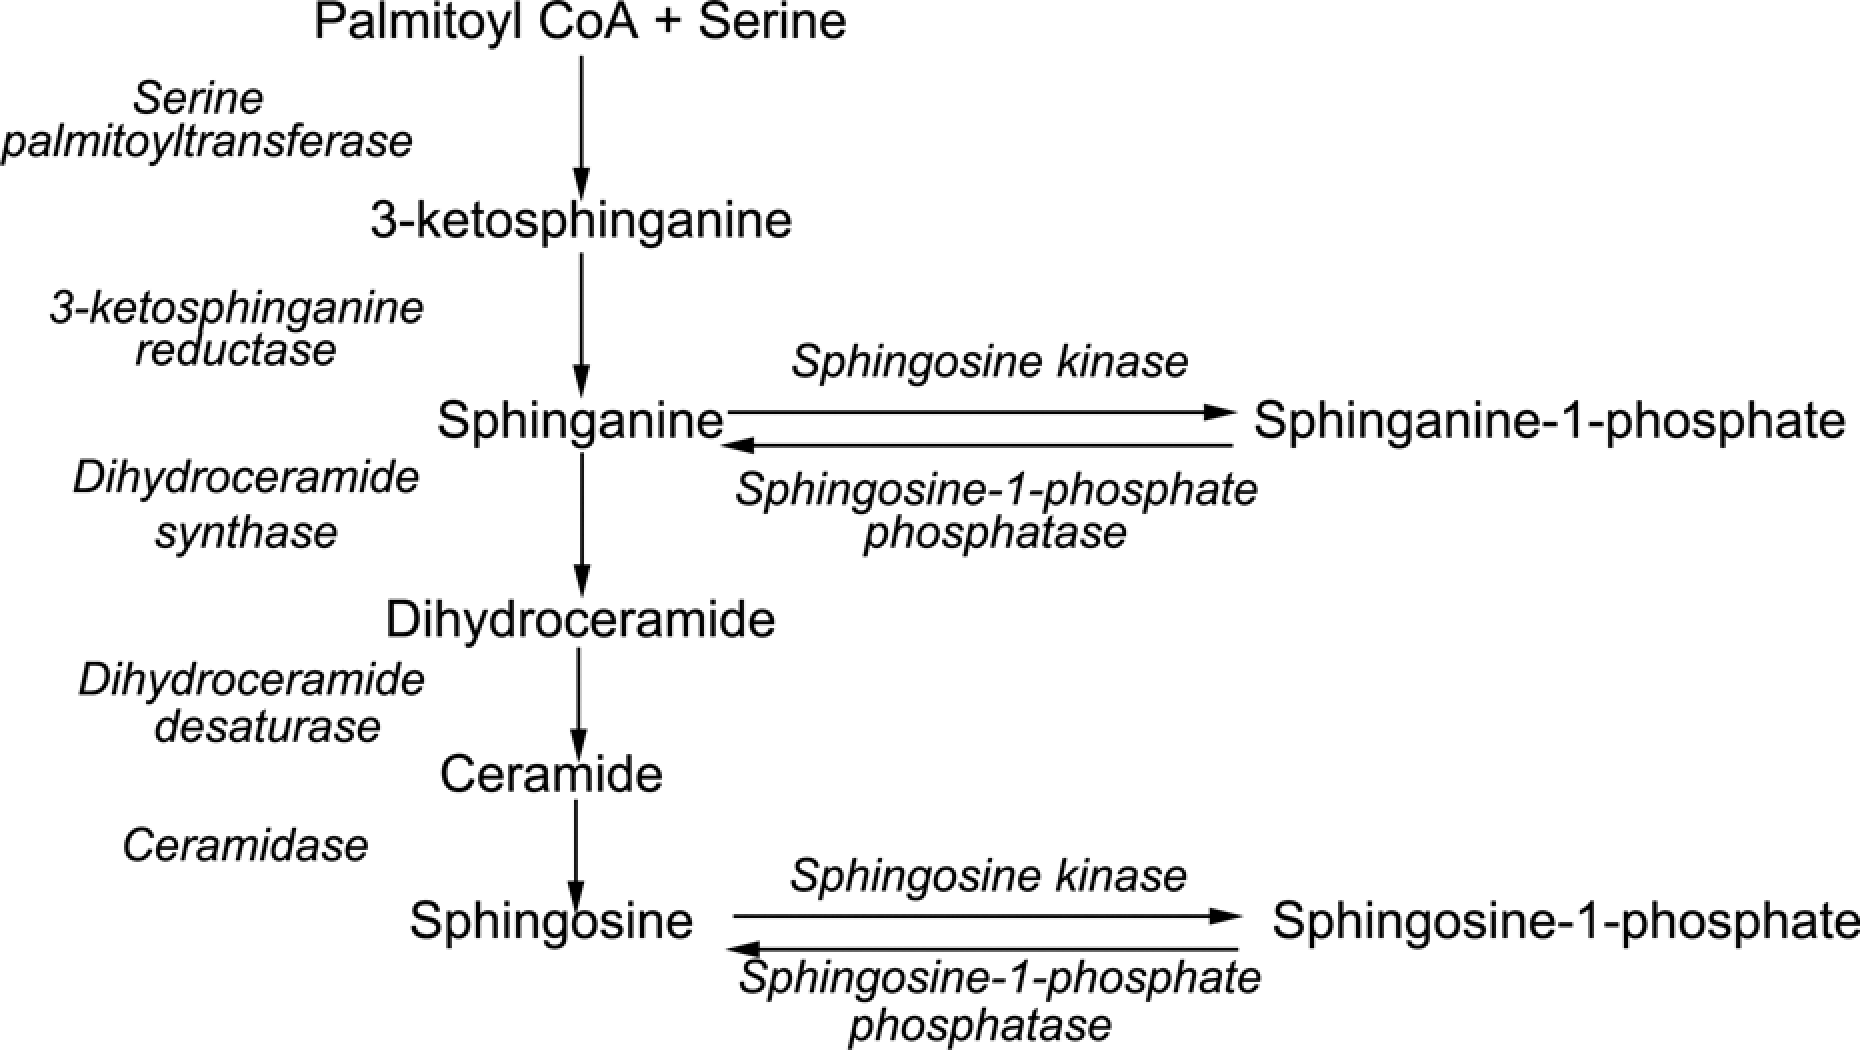
The metabolism of sphingolipids. Adapted from Lahiri and Futerman. 33
Moreover, LPC is a major source of lysophosphatidic acid (LPA). Thus, a decline in LPC will directly affect LPA content. AA, S1P, and LPA, collectively referred to as lipid mediators, play pivotal roles in the maintenance of homeostasis in living systems. Lipid mediators are exported extracellularly and bind to their cognate G protein-coupled receptors to transmit signals to target cells. The dysregulation of lipid mediators have been linked to various diseases, such as inflammation and ischemic metabolic syndrome. 35 In our article, the changes in AA, S1P, and LPA levels indicate the dysregulation of the said lipid mediators. The abnormal levels of lipid mediators disrupt homeostasis in living systems and affect normal organ function.
The results of the metabolic analysis showed that DDVP clearly affects liver function. The findings are consistent with the results of the clinical chemical analysis in the previous study. Compared with the control group, aspartate aminotransferase and alanine aminotransferase were increased significantly in the middle- and high-dose groups. 28 The increase in transaminase activity in the liver indicated liver damage after the treatment of pesticides. At the same time, fatty degeneration, vacuolar degeneration in liver cytoplasm, and liver cell necrosis occurred with middle-dose and high-dose DDVP levels. No significant histopathological changes were found in the liver tissues in the low-dose group. Thus, the liver was damaged by DDVP in the middle- and high-dose groups. No significant changes in rat liver were detected by histopathology and clinical biochemistry in the low-dose group. However, some metabolites, such as LysoPE (16:0/0:0), LysoPC (17:0/0:0), sphingosine, sphinganine, C16 sphinganine, and C17 sphinganine, were changed significantly after 16 weeks of dosing in the low-dose group. Table 2 shows that the changes in the metabolites were related to dosage level. However, the relationship between the changes in the concentration of metabolites and the abnormal function of organs was not clear. Therefore, further studies are needed to clarify this aspect.
In conclusion, our results highlighted the power of UPLC–MS/MS-based metabolomics: abnormal changes of some lipids in the plasma were closely related to organ dysfunction, especially the liver. Metabolomics, as a systemic toxicological approach, was able to provide comprehensive information on the dynamic process of DDVP-induced toxicity. Metabolic profiling can aid the mechanistic elucidation of toxicological and pathologic changes and can be a means of identifying potential biochemical markers of toxicity. The analysis of metabolic profiles will make exceptional contributions to the assessment of individual effects of DDVP on human health following low-dose exposure to pesticides.
Footnotes
Authors’ Note
The author Jindan Yang and Hong Wang contributed equally to this work.
Conflict of interest
The authors declare that there is no conflict of interest.
Funding
This study was financially supported by the National Natural Science Foundation of China (81172672).