
Abstract
Aristolochic acids (AAs) are a family of structurally related nitrophenanthrene carboxylic acids that are present in medicinal herbs such as Aristolochia species. The organic anion transporters (OATs) of the solute carrier (SLC22) gene family located in the renal proximal tubules play a key role in the excretion of a variety of exogenous and endogenous compounds. However, it is unclear how AAs permeate into renal epithelial cells. In this regard, we investigated the role of rat OAT1 ([rOAT1] SLC22A6) in the cellular uptake of AAI in vitro and in vivo. A concentration- and time-dependent intracellular accumulation of AAI was observed in rOAT1-transfected human embryonic kidney 293 (HEK293) cells, which was 2- to 6-fold higher than the control cells. There was a significantly increased rate of cellular apoptosis in rOAT1-transfected HEK293 cells than control cells after AAI treatment. Para-aminohippuric acid (PAH) significantly reduced the intracellular accumulation of AAI in rOAT1-transfected HEK293 cells. Administration of AAI for 35 days in rats caused significantly reduced expression of OAT1 in basolateral membrane and declined renal clearance of PAH as well as renal proximal tubule injuries. These findings indicate that AAI is taken up by OAT1, which then exert its intracellular toxic effects on renal proximal tubule cells, which in turn damage functional OAT1 and may further disturb the transport of its substrates.
Introduction
The organic anion transporters (OATs) of the solute carrier (SLC22) gene family located in the renal proximal tubules play a key role in the excretion of a variety of exogenous and endogenous compounds.1–3 These transporters mediate the successive steps of basolateral uptake into the epithelial cells and subsequent apical efflux that are needed for tubular secretion. 4 A small number of OATs have been recently cloned in humans (OAT1/SLC22A6, OAT2/SLC22A7, OAT3/SLC22A8, OAT4/SLC22A11 and OAT5/SLC22A10), rats (OAT1-5), and mice (OAT1-5).1,5,6 All these OATs exhibit distinct but overlapping substrate specificity.7–9 Among the OATs, OAT1 is the primary contributor to the classical renal organic anion secretary process. 6 In the kidneys, OAT1 expression is restricted to proximal tubular cells. OAT1 interacts with more than 100 compounds, and its substrates include endogenous substances, such as dicarboxylates, cyclic nucleotides, prostaglandins, and urate as well as exogenous ones, such as drugs and environmental compounds. 10 The well-known ‘classic’ renal organic anion transport system, particularly that for the basolateral uptake, has been extensively characterized using para-aminohippurate (PAH) since PAH is a typical low-molecular-weight organic anion and a prototypical substrate for both human and rodent OAT1.11,12 A number of toxicants, including mercurial, ochratoxin A, and drugs such as cidofovir,13,14 are taken up by OAT1. These agents probably then exert their toxic effects intracellularly during transit through proximal tubule cells, resulting in acute, subacute, or chronic renal injury.
Aristolochic acids (AAs) are a family of structurally related nitrophenanthrene carboxylic acids that are primarily from herbal medicines such as Aristolochia species—A. fangchi, A. clematits, and A. manshuriensis. 15 The predominant AAs are AAI (8-methoxy-6-nitro-phenanthro-(3,4-d)-1,3-dioxolo-5-carboxylic acid) and AAII (6-nitro-phenanthro-(3,4-d)-1,3-dioxolo-5-carboxylic acid). As reported first in Belgium in 1991, the consumption of herbs containing AAs has been associated with severe nephropathy, which was characterized by tubulointerstitial nephritis and rapidly progresses to fibrosis, leading to end-stage renal failure in several months. 16 The progression of aristolochic acid nephropathy (AAN) is characterized by variable intensity of lymphocyte infiltration, prominent tubular atrophy, and tubulointerstitial fibrosis with microscopically intact glomeruli.16–18 A large cohort of these patients with AAN have developed urothelial cancer.16,19 The renal toxicity of AAI is dependent on the dosage and the duration of administration. 20 Human AAN is reproducible in rodents in which AA intoxication results in acute tubular necrosis or chronic interstitial fibrosis, leading to renal failure.
Like PAH, AAs are low-molecular-weight organic anions. Within the kidneys, the epithelial cells that line the renal proximal tubule have been shown to be the primary cellular targets where AAs gain entry, accumulate, and induce pathologic effects in vivo and in vitro. 21 However, the mechanism by which AA is taken up into tubular epithelial cell and AA’s effect on OATs in vivo remains rarely investigated. Recently, Bakhiya et al. detected higher levels of AAI-DNA adducts in hOAT1-expressing cells than in control cells, which indirectly confirmed OATs mediating the uptake of AA into proximal tubule cells in vitro. 22 In this study, we offered further direct evidence for the role of OAT1 in the disposition of AAI and the toxicological consequences in vitro and in vivo.
Methods and materials
Chemicals and reagents
AAI (purity >99.9%, Molecular weight (Mr) = 341.27), PAH, phenylmethanesulphonylfluoride (PMSF), polyethylene glycol 400 (PEG400), Annexin V–fluorescein isothiocyanate (FITC) Apoptosis Detection Kit and Percoll containing colloidal silica particles of 15–30 nm for density gradient centrifugation were purchased from Sigma Aldrich (St Louis, MO, USA). Dulbecco’s modified Eagle’s medium (DMEM), fetal bovine serum, and 0.25% trypsin were purchased from Gibco (Langley, OK). TRIzol and reverse transcriptase were from Invitrogen (Carlsbad, CA, USA); polymerase chain reaction (PCR) buffer, Taq polymerase and deoxyribonucleotide triphosphates (dNTPs) were purchased from Takara Bio Inc. (Shiga, Japan). Anti-OAT1 was purchased from Alpha Diagnostic International (San Antonio, TX, USA).
Expression and function of OAT1 in transfected human embryonic kidney 293 (HEK293) cells
Cell culture. HEK293 cells were purchased from American Type Culture Collection (Manassas, VA, USA). HEK293 cells were grown in a humidified atmosphere consisting of 95% O2 and 5% CO2 at 37°C in DMEM supplemented with 1 mmol/L sodium pyruvate, 10% fetal bovine serum, and 1% penicillin–streptomycin.
Polymerase chain reaction assay and transfection assay. PCR primers were designed and synthesized based on the nucleotide sequence of rat OAT1 (rOAT1). The sense strand contains an Hind III site, 5′-AATAAGCTTATGGCCTTCAATGACCTCCTG-3′; the antisense strand contains a BamH I site, 5′-AATGGATCCTCAAAGTCCATTCTTCTCTTGTGT-3′. Total RNA was prepared from rat kidney tissues using TRIzol reagent. One microgram of poly RNA was reverse -transcribed. The synthesized cDNA was used for subsequent PCR with a set of primers according to the following profile: 94°C for 30 s, 57°C for 30 s, and 72°C for 90 s, for 31 cycles. The resultant PCR products were separated by electrophoresis on 1.2% agarose gels, and purified. The purified PCR products were cut with Hind III and BamH I, ligated into pBluescript SK(+) for sequencing, and transformed into competent high Escherichia coli DH5α. Both strands of the subcloned cDNA were sequenced with DNA sequencer and the cDNA clones with base sequences were 100% identical with rOAT1 (Genbank: NM_017224 Version 2; GI:148540166). rOAT1 cDNA was subcloned into pcDNA 3.1 for in vitro transcription. Transfection of cDNA was performed as described previously, 23 with some minor modifications. Briefly, HEK293 cells were seeded on 60-mm plates the day before transfection. The cells were transfected with plasmid cDNA using lipofectamine 2000. Protein extracts from empty-vector transfected and rOAT1-transfected cells were subjected to Western blot analysis to confirm the expression of rOAT1.
Uptake of PAH and AAI in vector- and rOAT1-transfected cells. At 48 h after transfection, the uptake of PAH and AAI were examined. The composition of the incubation medium was as follow: 145 mM NaCl, 3 mM KCl, unit:mM 1 CaCl2, unit:mM 0.5 MgCl2, 5 mM
Determination of PAH and AAI. PAH was determined by a validated capillary electrophoresis (CE) method as described previously. 25 The CE consisted of Beckman Pace instrument equipped with a fused-silica capillary (length: 37 cm) using Beckman System Gold software. The temperature was maintained at 21°C and the voltage at 25 kV. Injection was induced by positive pressure. The mobile phase was 50 mmol/L borate buffer (pH 10.2) and the analyte was determined by ultraviolet detection at 280 nm.
AAI was determined by HPLC with an Agilent HP-1100 with a HP-1100 pump and DAD detector (Santa Clara, CA, USA). 26 The analyte was eluted with a Hypersil ODS C18 column (4.6 × 250 mm, 5 μm; Thermo Fisher Scientific Inc., Waltham, MA, USA) by mobile phase of 1% acetic acid:methanol (30:70, volume/volume [v/v]) at 0.8 ml/min and detected at 315 nm. The CE and HPLC methods had acceptable accuracy (85−115% of true values) and precision (intra- and inter-assay coefficient variations <15%). Assay specificity was indicated by the absence of interfering chromatographic peaks in PBS buffer or cellular homogenates.
Flow cytometric analysis. Cellular necrosis and apoptosis were detected by flow cytometric analysis. The transfected and control cells were treated with AAI for 24h before detection. Totally 2.5–3 × 10⁶ cells from each sample were stained with propidium iodide (PI) and Annexin V-FITC. Cellular debris characterized by a low forward and side light scatter was excluded from the analysis. Several controls included were as follows: (a) unstained cells; (b) cells stained with PI alone; (c) cells stained with Annexin V-FITC alone; and (d) cells stained with both Annexin V-FITC and PI. Data acquisition and analysis were performed using the CellQuest program (Becton Dickinson). The sample was analyzed on a flow cytometer using an excitation wavelength at 488 nm with an argon laser.
Expression and function of OAT1 in the kidney of AAI-treated rats
Experimental animals. A total of 32 healthy male Wistar rats, 8 weeks old, were obtained from the Animal Center of Sun Yat-sen University (Guangzhou, China). Animals were allowed free access to an SPF laboratory diet and distilled water and were housed in an environment of constant temperature and humidity with regular light–dark cycles (12:12 h) during the experiments. The animals were cared for in accordance with the principles and guidelines for the care and use of laboratory animals. After a 7-day acclimatization, weight-matched (approximately 150 g) rats were assigned to 2 groups and treated daily by subcutaneous injections for 10–35 days as follows: AAI dissolved in PEG400 to a final concentration of 10 mg/ml before subcutaneous injection at a dose of 10 mg/kg/d body weight according to a modified method described by Debelle et al., 27 or the vehicle only, consisting of a 50/50 mixture of PEG400 and deionized water (control group, n = 8). Body weights were recorded every 5 days for adjustment of drug dosages. Animals were killed on day 10 and 35 by craniocervical dislocation. Blood was collected by cardiac puncture and used to analyze serum creatinine levels. Serum creatinine was detected by COBAS INTEGRA® 400 plus analyzer (Roche, Switzerland). Kidneys were then removed for histology, Western blot analysis, and immunofluorescence.
Renal histological analysis. For light microscopic analysis, the kidneys were fixed and embedded in paraffin. Sections (thickness: 2 μm) were treated by periodic acid-Schiff (PAS) staining. The PAS-stained tissue sections were used to evaluate acute tubulointerstitial injury using Acute tubular necrosis (ATN) score, which quantifies the percentage of tubules that has cell necrosis, loss of brush border, cast formation, or tubule dilatation on the following scale: 0 = none; 1 = <10%; 2 = 11–25%; 3 = 26–45%; 4 = 46–75%; and 5 = >76%. 28
Determination of renal PAH clearance. This study was performed as described previously.11,29 The animals were anesthetized with 10% chloral hydrate. The femoral vein and carotid artery were cannulated and a bladder catheter (3 mm inner diameter) was inserted through a suprapubic incision. A priming dose of PAH (30 mg/kg body weight) in 1 ml of saline was infused through the venous catheter, then a solution containing PAH (6 g/L) in saline was administered by a constant infusion pump at a rate of 1 ml/h/100 g body weight. After equilibrating for 45 min, urine was collected every 20 min and the volume of urine was measured by gravimetry. Blood from the femoral artery was obtained at the midpoint of each clearance period. The PAH concentrations in plasma and urine were determined by the method of capillary electrophoresis. For each animal, the fractional excretion of PAH was calculated according to conventional formulae, as follows: PAH clearance = ([PAH]u × Vu)/([PAH]p × T), where PAHu is the PAH concentration in urine, PAHp is the plasma PAH concentration, Vu is the urine volume, and T is the time of measurement. 11
Cell lysis, tissue lysis, SDS-PAGE, and Western blotting. Cells were lysed on ice for 15 min in 1× cell lysis buffer. For rat renal tissue, the frozen kidney cortex (100 mg) was pulverized in liquid nitrogen and resuspended in 400 μl of cellular lysis buffer. The homogenates were sonicated thrice for 15 s. Aliquots of the supernatants were stored at −80°C. Cell or tissue lysates were centrifuged for 15 min at 12,000 rpm at 4°C. Protein concentration was measured using the Bradford assay. Equal amounts of cell extracts were boiled for 5 min in the presence of 1% 2-mercaptoethanol and 2% sodium dodecyl sulfate (SDS). Samples were electrophoresed on 7% SDS-poly-acrylamide gels, and then transferred to nitrocellulose (NC) membrane. Membranes were blocked with 5% (weight/volume [w/v]) milk proteins/Tris-buffered saline and incubated overnight at 4°C with the primary antibody: rabbit anti-OAT1 (2 μg/ml). Bound antibody was detected with appropriate secondary antibodies and enhanced chemiluminescently. Same blots were probed with anti-β-actin to monitor protein loading and transferring. A densitometric quantification of Western blot signal intensity of membranes was performed.
Basolateral membrane preparations. The preparations of basolateral membranes from AAN (n = 8) and control (n = 8) rats were done by a modification of the method described by Jensen and Berndt. 30 Approximately 4 g of kidney cortex was placed in a Dounce homogenizer containing 50 ml of 250 mmol/L sucrose, 5 mmol/L Tris-HEPES, pH 7.40, and 0.1 mg/ml PMSF. After four gentle strokes with the loose fitting pestle, the suspension was homogenized further with a motor-driven Teflon pestle (600 rpm/5 strokes) and spun down for 15 min at 1200g. The supernatant was aspirated and spun for 15 min at 22,000g. The fluffy beige upper layer of the resulting pellet (crude plasma membrane) was resuspended in about 1 ml of supernatant and added to 19 ml of buffered sucrose. The membrane suspension was homogenized gently through a 16-gauge gavage needle followed by the addition of 3.7 ml of 100% Percoll. The Percoll membrane mixture was spun at 39,250g for 30 min. The top clear layer was discarded and the dark band was removed. This layer was composed primarily of basolateral membranes as established by marker enzyme analysis. Basolateral membranes were placed in KCl buffer (85 mmol/L KCl, 83 mmol/L sucrose, and 2 mmol/L HEPES-Tris, pH 7.40) at a ratio of 8 ml/g original cortex wet weight. Then, basolateral membranes were pelleted at 30,000g for 30 min and washed 3 times with the KCl buffer indicated. Finally, basolateral membranes were resuspended in 300 μl of 250 mmol/L mannitol, 10 mmol/L HEPES-Tris, pH 7.40, and 0.1 mg/ml PMSF. Protein quantification of samples was performed using the Bradford assay. Western blot assays were performed as described above.
Immunofluorescence detection. Kidneys from AAN and control groups were quickly removed and immersed in periodate–lysine–paraformaldehyde solution at 4°C overnight. The tissue was embedded in paraffin. After deparaffining, high-pressure antigen retrieval and blocking serum for 40 min, the sections were rinsed with PBS and incubated with polyclonal antibodies against rOAT1 (diluted 1:200) overnight at 4°C. The sections were rinsed with PBS and incubated with Alexa-488-conjugated appropriate secondary antibody for 40 min at room temperature. Sections were mounted using the aqueous mounting medium. Signal was detected under LSM 510 confocal immunofluorescence (Carl Zeiss, Inc., Jena, Germany), images were obtained with LSM image browser.
Statistical analysis
Values are expressed as mean ± SE. Statistical analysis was conducted using the GraphPad Prism software. Statistical differences in multiple groups were determined by multiple comparisons with analysis of variance followed by Tukey’s post hoc test. Statistical differences between two groups were determined by two-tailed unpaired Student’s t test; p value <0.05 was considered statistically significant.
Results
Expression and function of OAT1 protein in transfected HEK293 cells
Expression of OAT1 protein in transfected HEK293 cells. Figure 1A showed the expression of rOAT1 in blank vector and rOAT1-transfected HEK293 cells. In the control cells, rOAT was not detected, but there was a remarkable 77-kDa band in the rOAT1-transfected HEK293 cells, indicating the overexpression of rOAT1. The function of rOAT1 in the transfected HEK293 cells was investigated using PAH as a probe. Figure 1B shows a time-dependent PAH uptake over 60 min by rOAT1-expressing HEK293 cells. After incubation with PAH at 5 μM for 15, 30, 45, or 60 min, the intracellular accumulation of PAH was 2- to 6-fold higher in rOAT1-expressing HEK293 cells than the control cells (p < 0.05).
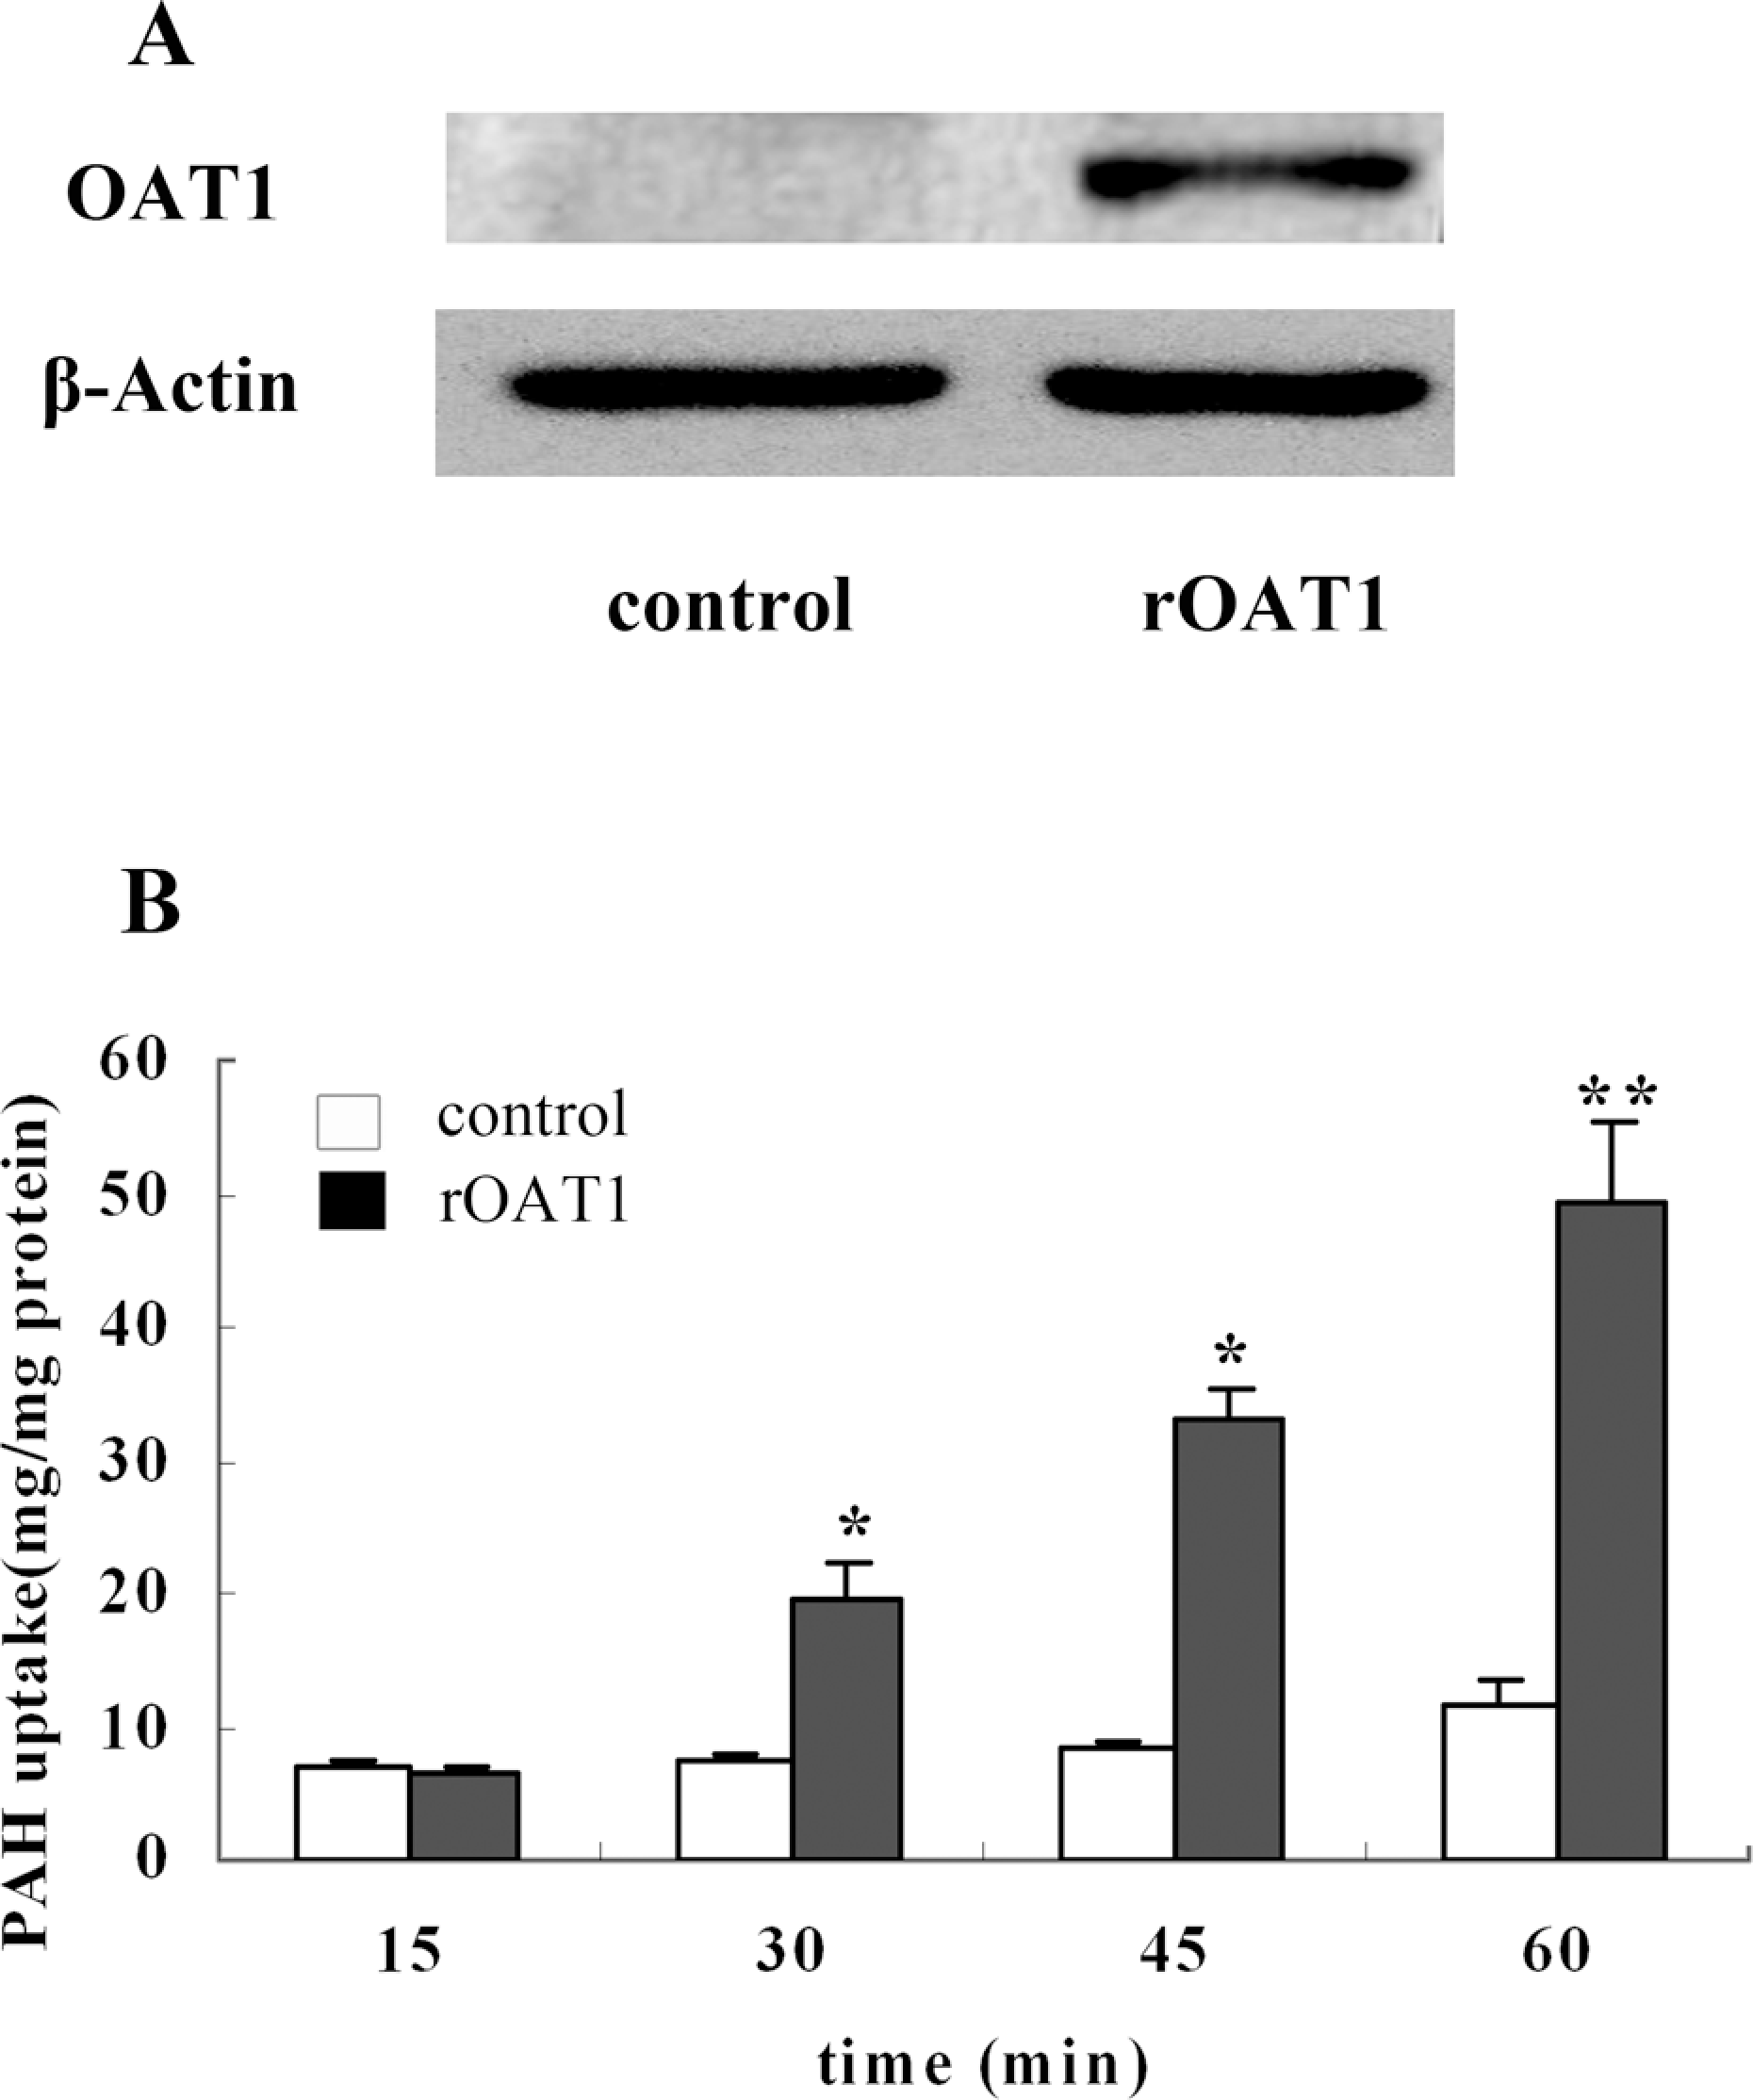
The expression and function of organic anion transporter 1 (OAT1) in human embryonic kidney 293 (HEK293) cells transfected with empty vectors and rOAT1 cDNA. (A) Western analysis of OAT1 and β-actin. (B) For PAH uptake assay, intracellular accumulation of PAH in vector (□) and rOAT cDNA(▪) transfected group was determined by a validated capillary electrophoresis (CE) method. Each point represents the mean ± SE of three determinations. *p < 0.05, compared with the empty pcDNA 3.1 vector group.
Uptake of AAI by rOAT1-expressing HEK 293 cells
As shown in Figure 2A and B, a concentration- and time-dependent intracellular accumulation of AAI was observed in rOAT1-transfected HEK293 cells. After incubation with AAI at 40, 80, 120, or 160 μg/ml for 45 min, the intracellular concentration of AAI in rOAT1-transfected HEK293 cells increased significantly compared to that of the corresponding control cells (Figure 2A; p < 0.05). When incubated with AAI at 40 μg/ml for 30, 60, 90, or 120 min, the uptake of AAI was significantly higher in rOAT1-transfected HEK 293 cells than in corresponding control cells (Figure 2B; p < 0.05). After pre-incubation of 5mM PAH for 35 min, the uptake of AAI in rOAT1-transfected HEK293 cells was significantly inhibited (Figure 2C; p < 0.05) Apoptosis and necrosis of rOAT1-transfected and control HEK293 cells treated with AA. As shown in Figure 3A, when using PI or Annexin V-FITC labels independently, PI and Annexin V-positive cells (apoptotic and necrotic cells) were located in the upper right quadrant, Annexin V-positive cells (apoptotic cells) in the lower right quadrant, and live cells labeled with neither of these compounds in the lower left quadrant. In empty vector- or rOAT1-transfected HEK293 cells, the apoptosis rate was 13.7 ± 10.0% and 19.1 ± 9.1%, respectively. The apoptosis rate was significantly higher in rOAT1-transfected HEK293 cells than in control cells when treated with AAI at 40–160 μg/ml (as shown in Figure 3B; 40 μg/ml AAI: 33.7% vs. 15.85%; 80 μg/ml AAI: 47.6% vs. 18.6%; 120 μg/ml AAI: 56.9% vs. 22.3%; and 160 μg/ml AAI: 68.6% vs. 31.0%; p < 0.05). In both types of cells, the apoptosis increased with increasing concentration of AAI.
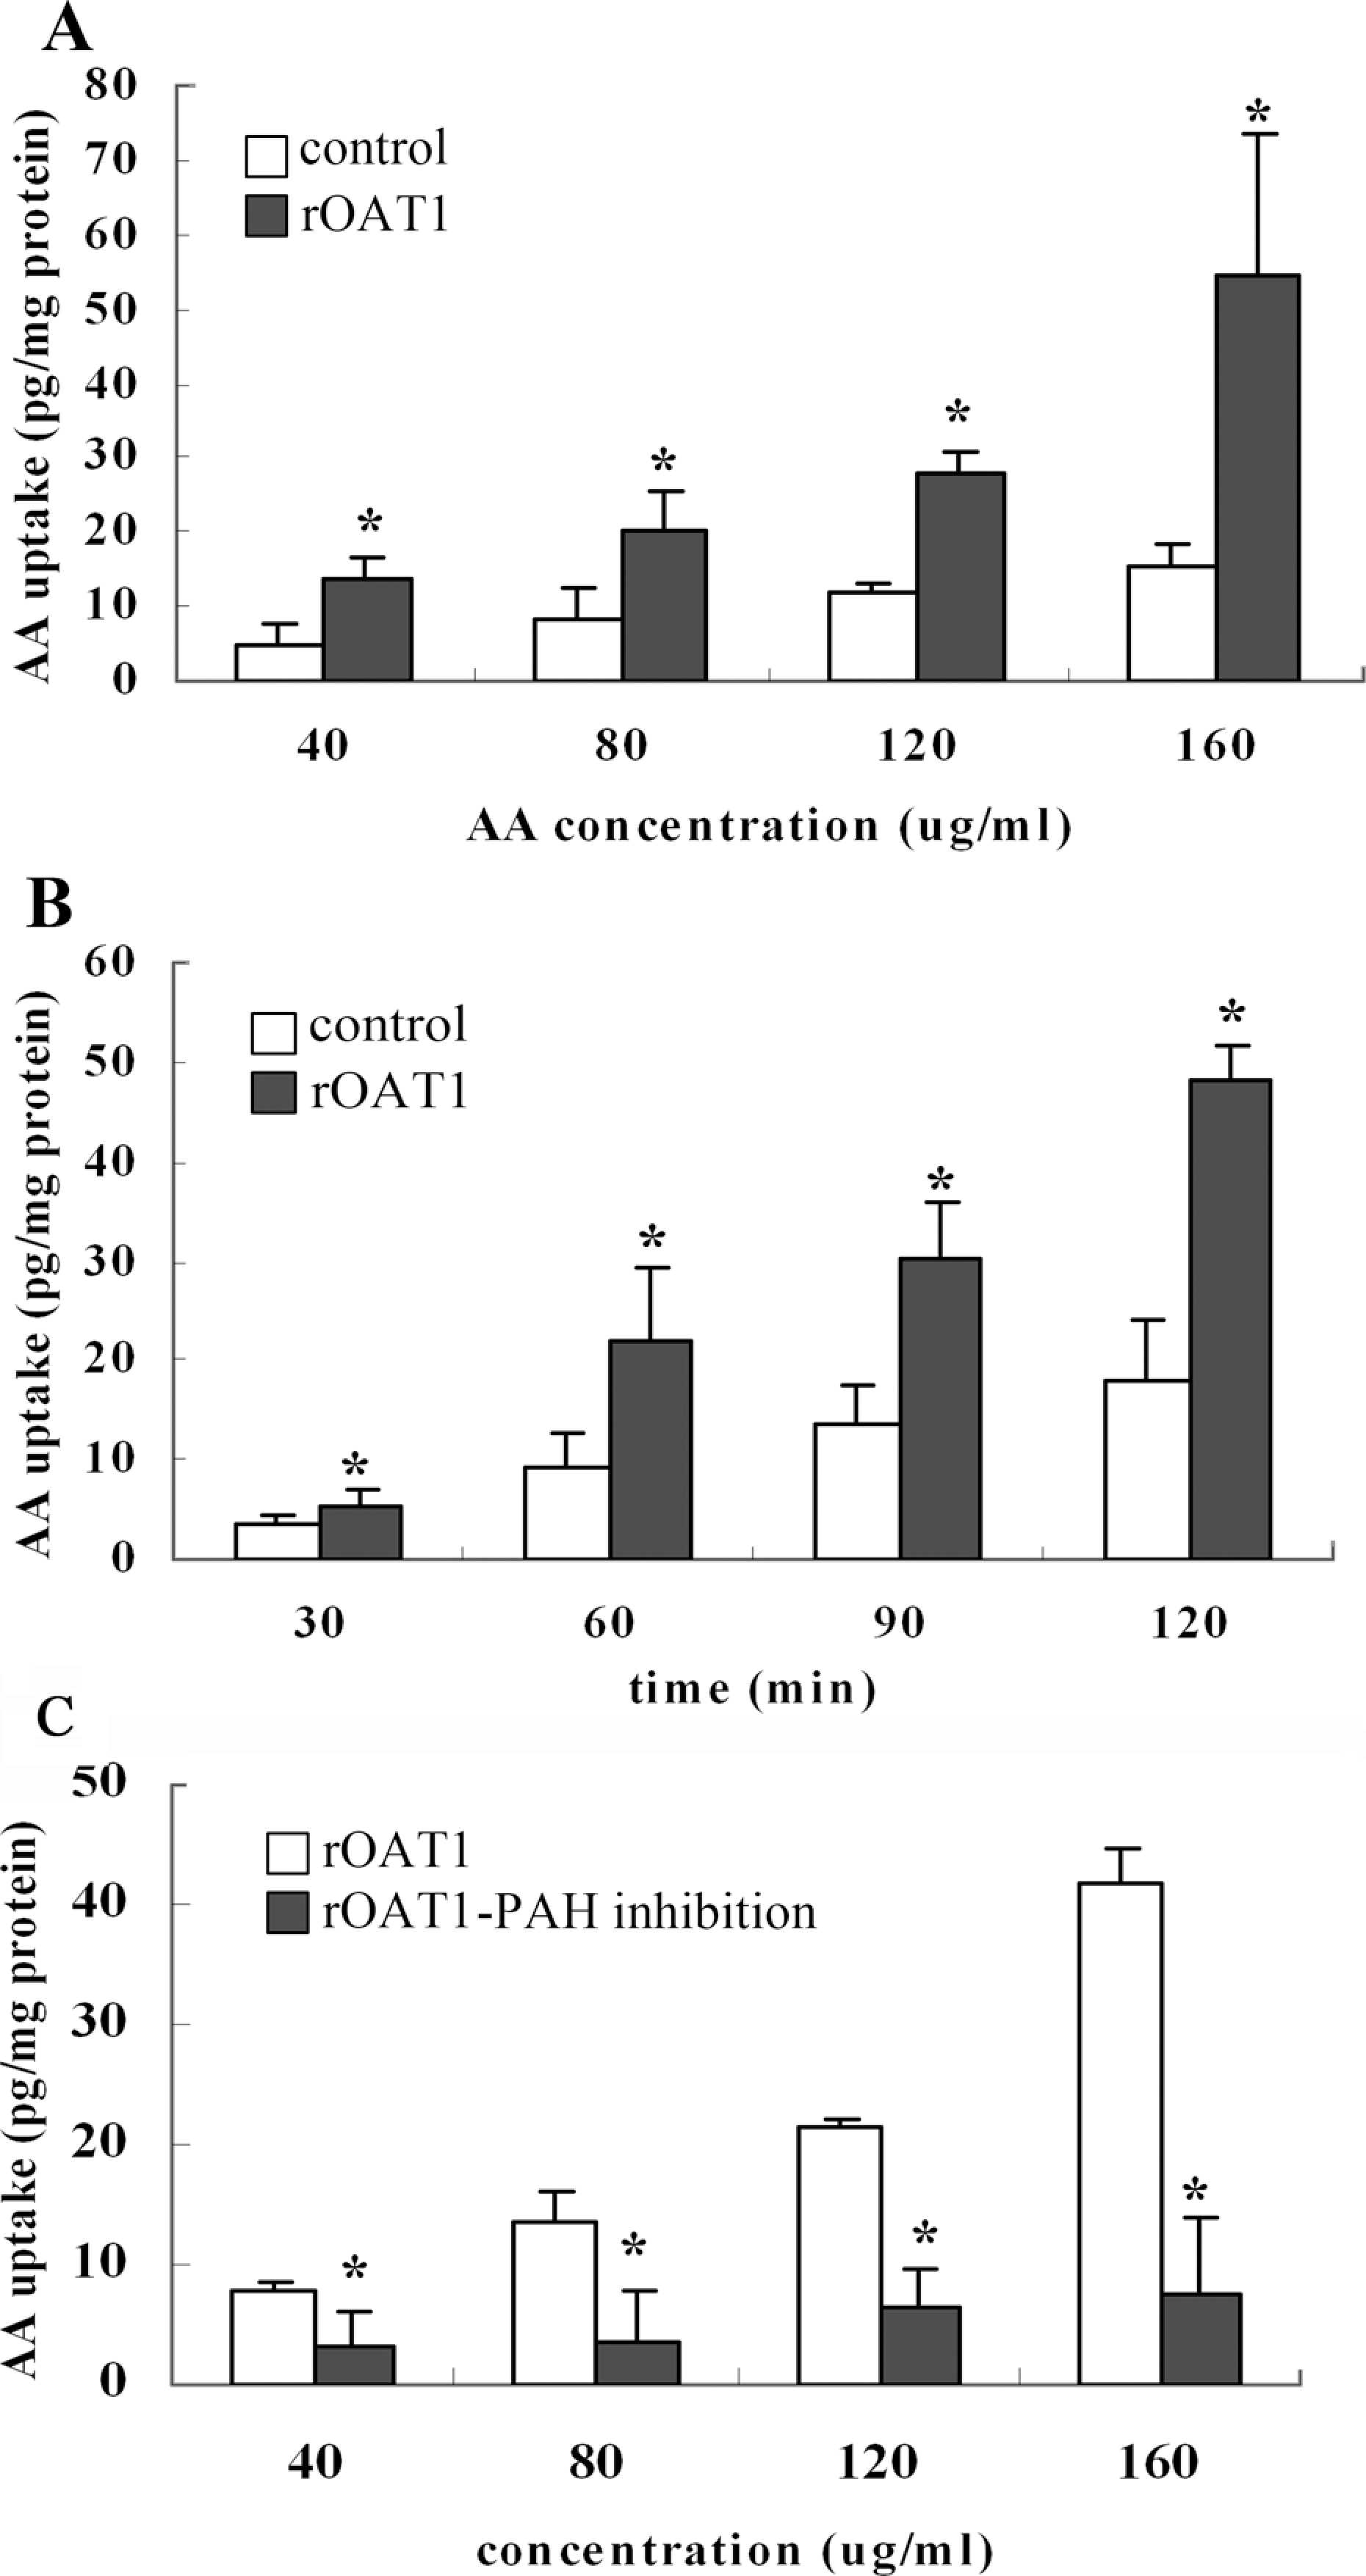
Uptake of aristolochic acid I (AAI) by rat organic anion transporter 1 (rOAT1)-expressing human embryonic kidney 293 (HEK293) cells. (A) Concentration dependence (incubated for 45 min) and (B) time course of AAI accumulation in HEK293 cells transfected with empty pcDNA 3.1 vector (□) or rOAT1 (▪) cDNA. The cells were incubated with aristolochic acid I at 37°C for 120 min. Each point represents the mean ± SE of three determinations. *p < 0.05 compared with the empty pcDNA 3.1 vector group. (C) Effect of p-aminohippurate (PAH) on the intracellular accumulation of AAI in HEK293 cells transfected with rOAT1. The cells transfected with rOAT1 cDNA were incubated with various concentrations of AA in the absence (□) or presence (▪) of 5 mM PAH. Each point represents the mean ± SE of three determinations. *p < 0.05, compared with the presence of 5 mM PAH. 209 × 307 mm.

Apoptosis and necrosis of rat organic anion transporter 1 (rOAT1)-transfected and control human embryonic kidney 293 (HEK293) cells after treatment with aristolochic acids I (AAI): representative flow cytometric analysis of HEK293 cells transfected with rOAT1 or blank vectors. Cells were stained with propidium iodide (PI) and Annexin V–fluorescein isothiocyanate (FITC). The cells in the lower right quadrant represent apoptotic cells and those in upper right quadrant are apoptotic/necrotic cells. (B) Graphs represent quantitation of analysis of Annexin V + HEK293 cells by flow cytometry. *p < 0.05 compared with control cells.
Expression and function of OAT1 in the kidney of AAI-treated rats
Renal functional and histologic change in AAI-treated rats. As shown in Figure 4, the serum creatinine in AAI-treated rats on day 10 was not significantly different compared to that of control rats. However, on day 35, increased serum creatinine presented in AAI-treated rats (p < 0.05). Histologic finding of rat renal tissue samples was shown in Figure 5A. In AAI-treated rats, slight lesions were observed on 10th day after AAI exposure, indicated by a little scattered neutrophils and mononuclear cells infiltration in interstitial site and focal interstitial edema in deep cortex. Little tubule brush borders loss and necrotic cells in proximal renal tubuli were found. On day 35, PAS-stained sections revealed necrosis and exfoliation of proximal tubular epithelial cells (Figure 5A, arrows indicate necrotic cells), detached brush borders and fraction tubular atrophy. Glomerular lesions were absent in AAI-treated rats. As shown in Figure 5B, the ATN scores of PAS-stained sections of AAI-treated rats on day 35 were significantly higher than in the control group (p < 0.05).

Serum creatinine in rats treated with aristolochic acids I (AAI) and in control rats. Serum creatinine concentrations in control rats and AAI-treated rats on days 10 and 35. Each column represents the mean ± SE from 6 rats of each group. *p < 0.05 compared with the control group on the same day.

Photomicrographs of renal cortex. (A) Periodic acid-schiff (PAS) staining of rat kidney sections (magnification, ×400). On days 10 and 35, no abnormalities were observed for control rats. In aristolochic acids I (AAI)-treated rats, scattered neutrophils and mononuclear cells infiltration presented in interstitial site. Necrosis and exfoliation of proximal tubular epithelial cells (A, arrows indicate necrotic cells), detached brush borders and fraction tubular atrophy were observed. (B) These lesions areas were estimated quantitatively, as described in Materials and methods section. Data are represented as mean ± SE. *p < 0.05, **p < 0.01, compared with the control group on the same day.
Altered expression and function of OAT1 in AAI-treated rat kidneys. As demonstrated in Figure 6A, confocal immunofluorescence studies showed a punctuate labeling for OAT1 was widely distributed throughout the cytoplasm of the kidney from AA-treated rats on day 10, while rats in the control group showed abundant OAT1 labeling in basolateral domains. Immunoblot assay further showed that there was a mild increase in OAT1 expression of kidney cortex homogenates, but there was no significant difference between control and AAI group for basolateral membrane fractions (Figure 6B and D). Since PAH is a typical low-molecular-weight organic anion and a prototypical substrate for both human and rodent OAT1, PAH fractional excretion rate (namely renal clearance rate of PAH) is mainly to estimate the function of OAT1. As shown in Figure 7, a diminution was detected in AAI-treated rats on day 10 (3.32 ± 0.89 vs. 2.71 ± 0.93 ml/min; p < 0.05). On day 35, the reduced OAT1 expression in kidney cortex homogenates and basolateral membranes from AA-treated rats was observed, which was indicated by Western blot assays, especially for basolateral membranes (Figure 6D and E, compared with control group, p < 0.05). For function detection of OAT1, compared with control rats, two-third declination in PAH fractional excretion rate was detected in AAI-treated rats on day 35 (3.58 ± 1.18 vs. 1.21 ± 0.24, p < 0.05).

Expression alteration of organic anion transporter 1 (OAT1) in aristolochic acids I (AAI)-treated rats on days 10 and 35. (A) Representative immunofluorescence evaluation of OAT1 in rat kidney (×600). Compared to control group, with abundant OAT1 labeled in basolateral domains, punctuate labeling for OAT1 was widespread distributed throughout the cytoplasm in kidney from AA-treated rats. (B) Expression level of renal cortex homogenate OAT1 in rats subjected to vehiculum (control group) and AAI (AAI group). (C) Densitometric quantification of OAT1 protein of rat cortex homogenate. (D) Expression level of rat renal cortex basolateral membrane OAT1 in rats treated with AAI. An aliquot of protein sample (70 μg) from the rat kidney basolateral membrane was separated by SDS-PAGE and blotted onto nitrocellulose membranes. (E) Densitometric quantification of rat renal basolateral membranes. Each column represents the mean ± SE from 6 rats of each group. *p < 0.05 and **p < 0.01 compared with the control group on same day.
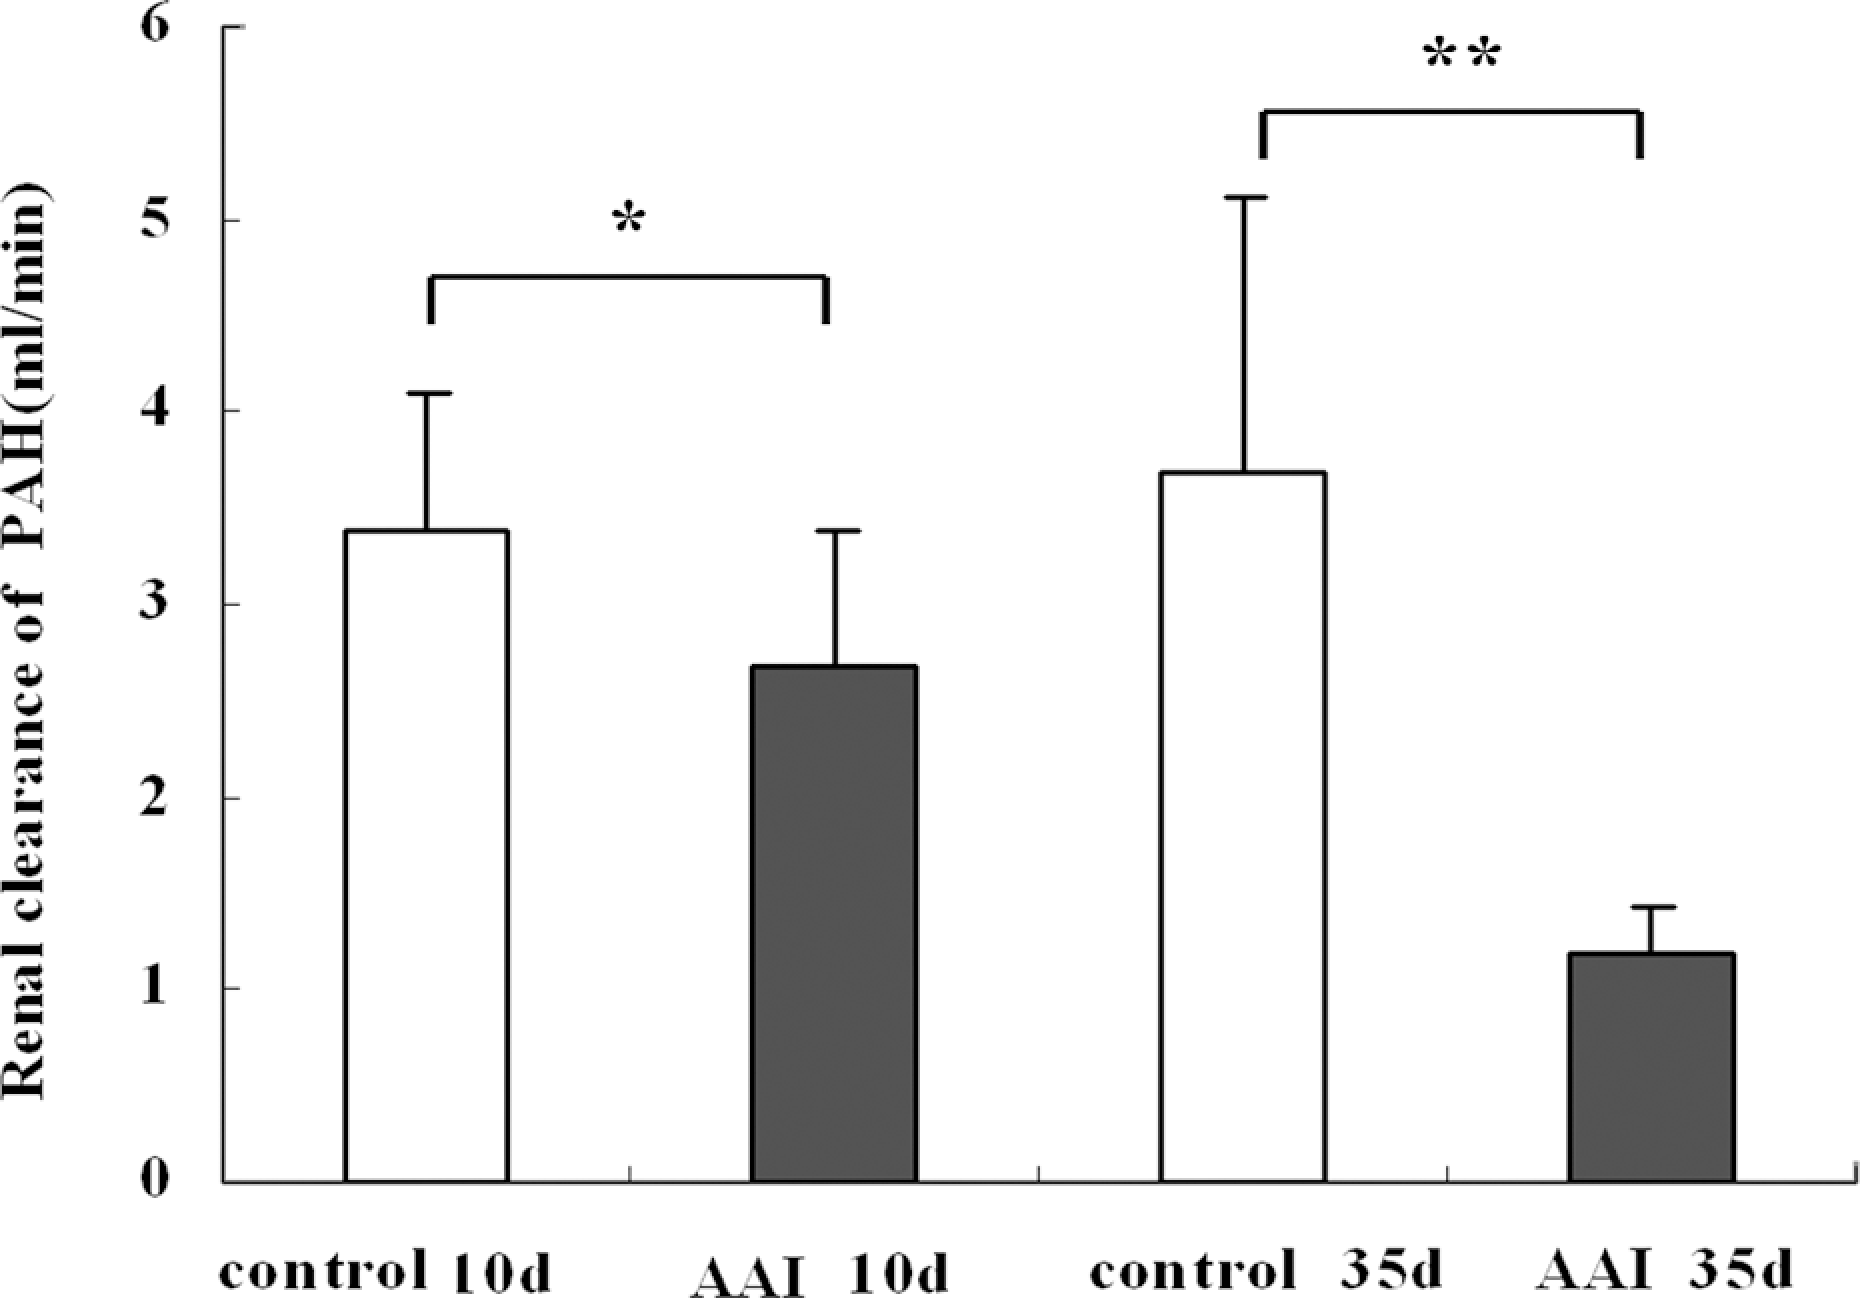
Renal clearance of para-aminohippuric acid (PAH) in rats treated with aristolochic acids I (AAI) and in control rats, renal clearance of PAH in AA-treated rats and control rats. Each column represents the mean ± SE from 6 rats of each group. *p < 0.05 and **p < 0.01 compared with the control group on same day.
Discussion
OAT1 is the primary contributor to the classical renal organic anion secretary process. 6 In the kidneys, OAT1 expression is restricted to proximal tubular cells. To examine the role of OAT1 in the transport of AAI, HEK293 cells were transfected with rOAT1 cDNA or empty vectors. HEK293 cells were chosen in this study as they express negligible OAT1-3 and thus the functional interference from the background expression of OATS is minimal. The results showed that there was overexpression of rOAT1 after transfection with rOAT1 cDNA and a concentration- and time-dependent intracellular accumulation of AAI in rOAT1-transfected HEK293 cells. Co-incubation of PAH, a known rat and human OAT1 substrate and inhibitor, significantly reduced rOAT1-mediated accumulation of AAI. This finding was supported by Burckhardt et al. 31 who reported that Aaon fluorescein uptake in OAT1-expressing COS7 cells was inhibited by more than 50% in the presence of 1 μM AA. Recently, Bakhiya et al. found that intracellular AAs-DNA adducts accumulated in HEK293 cells expressing human(h)OATs, by (32)P-postlabeling methods. AA administration leads to proximal tubular structural and functional impairments in rats and human beings. 32 Accumulated data showed that AA can induce apoptosis in renal tubular epithelial cells in vitro and in vivo. 33 ,34 Intracellular accumulation of AAs is critical for inducing subsequent renal cellular damage. The apoptosis rate was significantly higher in rOAT1-transfected HEK293 cells than in control cells when treated with AAI at 40–160 μg/ml. The significantly increased cellular apoptosis suggested the AAI uptake by OAT1 exerts its intracellular toxic effects during transiting through proximal tubule cells. All these results directly and indirectly confirmed that OAT1 can mediate the uptake of AA into proximal tubule cells.
In our in vivo study, we found that there was abundant OAT1 labeling in basolateral domains in normal rats. In AA-treated rats, slight lesions were observed on day 10 after AAI exposure. There is absence of tubule brush borders effacement and necrotic cells in proximal renal tubuli. The abundance of OAT1 protein did not alter significantly in the homogenates and in the basolateral membranes at the early stage (day 10), but confocal images demonstrated that there was redistribution of OAT1 in renal proximal tubular cells. The redistribution of OAT1 protein expression may suggest the presence of pathologic states. The redistribution of OAT1 may be due to an inhibition of the recruitment of preformed transporter into the membranes or an internalization of membrane transporters. Kwon et al. reported a similar altered distribution of OAT1 after ischemia/reperfusion of rat kidney using confocal microscopy. 35 Although the abundance of OAT1 protein did not alter, a diminution of renal clearance rate of PAH was detected in AAI-treated rats on day 10. In our previous study, we demonstrated that OAT1 protein expression elevated and its function was declined at the early stage of ischemia reperfusion injury. 36 Tanigawara et al. also revealed that in a single-pass flow of rat perfused kidney treated with uranyl nitrate (UN), the uptake of PAH across the basolateral membranes decreased gradually, but the transport membranes remained unchanged. 37 Another explanation for the diminished renal clearance of PAH in normal renal function stage may be that AAs treatment resulted in an obvious inhibition of PAH uptake in renal basolateral membranes, indicating AAs competition with PAH for OAT1. Similar alterations in OATs expression and function were reported in rat kidney exposed to mercuric chloride. 13 These results demonstrated that the expression and activity of OAT1 may be unbalanced in various pathologic conditions.
However, on day 35 in AAI-treated rats, declined renal function indicated by elevated serum creatinine and serious morphological changes including necrosis, exfoliation of proximal tubular epithelial cells, detached brush borders and fraction tubular atrophy were found. The expression of OAT1 protein both in homogenates and basolateral membranes decreased, especially for the latter. As the substrates of OAT1, two-third declination in PAH fractional excretion rate was detected compared with control rats. It was suggested that AAI damaged renal tubules including functional OAT1, which may further disturb the transport of its substrates. Morisaki et al. reported that the downregulation of rOAT1 and rOAT3 caused by cisplatin could accelerate another OAs-uremic toxins, such as IS accumulation in both serum and kidney, thereby augmenting renal tubular injury and leading to a further reduction in the level of these transporters. 38
In conclusion, AAI is taken up by OAT1 and exert its toxic effects intracellularly in proximal tubule cells, which in turn damaged functional OAT1 and may further disturb the transport of its substrates. The finding that OAT1 plays a role in the cellular uptake of AAI may have important clinical and toxicological implications. Further studies are warranted to investigate the role of other OATs in the disposition of AAs and the toxicological consequences.
Footnotes
Youjia Zeng and Rui Zhang contributed equally to this work.
Funding
This work is supported by the Chinese National Natural Science Research Grant (grant number 30873432 and 81073138) to Prof. Xiao Yang.
Declaration of Conflicting Interest
The authors declared that they have no conflict of interest.