
Abstract
The purpose of this study was to characterize the toxicity potential of melamine (MEL), cyanuric acid (CYA), and a combination of MEL and CYA in broilers. A total of 720 commercial 1-day-old COBB 500 male broilers were randomly allotted into 6 groups with 6 replicates each and 20 broilers in each replicate. The dietary treatments were as follows: group I was the control group, group II included 10 mg/kg MEL and 3.3 mg/kg CYA, group III included 30 mg/kg MEL and 10 mg/kg CYA, group IV included 100 mg/kg MEL and 33.3 mg/kg CYA, group V included 100 mg/kg MEL, and group VI included 33.3 mg/kg CYA. The trial lasted for 42 days. CYA alone and the combination of MEL and CYA had adverse effects on the performance, but MEL alone had no effects on the performance. On day 21, the uric acid (UA) content of group IV was increased in serum (p < 0.05); on day 42, the serum aspartate aminotransferase (AST) activity and the level of tumor necrosis factor (TNF)-α and interleukin (IL)-8 increased in group IV (p < 0.05); 100 mg/kg MEL alone increased the level of TNF-α and the rate of renal apoptosis (p < 0.05); and 33.3 mg/kg CYA alone increased the level of IL-8 and the rate of renal apoptosis (p < 0.05). The livers contained MEL concentrations of 17–125 μg/kg wet weight and CYA concentrations of 28–73 μg/kg, and the muscle contained MEL concentrations of 14–105 μg/kg wet weight. It was indicated that MEL alone, CYA alone, and a combination of MEL and CYA inhibit the growth and damage the kidney and liver.
Introduction
Melamine (2,4,6-triamino-S-triazine [MEL]) is widely used in plastics, such as dinnerware. MEL is also used in fertilizers and is a metabolite of the pesticide cyromazine in plants and animals. However, it is added into feeds and foods because of its high nitrogen content (approximate 66.6%). In March 2007, some dogs and cats had become ill, even died, because of ingesting the contaminated MEL pet food in United States, and in 2008, thousands of babies had serious illness because of MEL contamination in infant formula in China. 1,2 The toxicity of MEL has been extensively evaluated. Pathologic studied in rat and dogs indicate that high doses of MEL have diuretic properties but do not produce renal toxicity. 3 Cyanuric acid (CYA) is structurally related to MEL and usually used as a stabilizer in outdoor swimming pools. CYA was also evaluated for acute, subchronic, and chronic toxicity in rat, mice, and dogs, 4,5 inducing a series of similar effects with MEL and no indications of renal toxicity.
Individually MEL and CYA are relatively nontoxic. 6 However, MEL and CYA in combination can form insoluble crystals that obstruct and damage renal tubules and are presumed to cause renal failure. 7 In recalled pet food (cats and dogs), both MEL and CYA were identified. This may be the reason for acute renal failure in cats and dogs.
No data could be found for the potential toxicity of MEL and CYA in combination in livestock and poultry. Few studies were carried out to explore the toxicity of MEL and CYA alone or in combination at lower dose. The purpose of this study was to assess the toxicity of MEL and CYA alone and in combination when fed to broilers and describe any clinical pathologic changes or histologic lesions, thereby providing crucial information for evaluating the significance of the contaminants in the poultry feed.
Materials and methods
Melamine and cyanuric acid
MEL and CYA were both purchased from Sinopharm Chemical Reagent Co., Ltd, Beijing, China. The purity was ≥99.5% and ≥98%, respectively. All other chemicals and solvents used in the analyses were of reagent grade.
Animals and diets
The study was approved by the Sichuan Agricultural University Animal Welfare Committee. The experiment was conducted using a total of 720 commercial 1-day-old Cobb 500 male broilers. Birds were randomly allotted by body weight (BW) to 6 groups with 6 replicates each and 20 broilers in each replicate. Broilers were housed in electrically heated, thermostatically controlled cages (100 × 200 cm) with fiberglass feeders and a 24-h constant light schedule. The birds were allowed ad libitum access to the experimental diets and tap water. The basal corn–soybean meal diets (Table 1) were formulated to meet or exceed the requirements (NRC, 1994) for starter and grower broilers.
Composition of the basal diets for broilers (%)
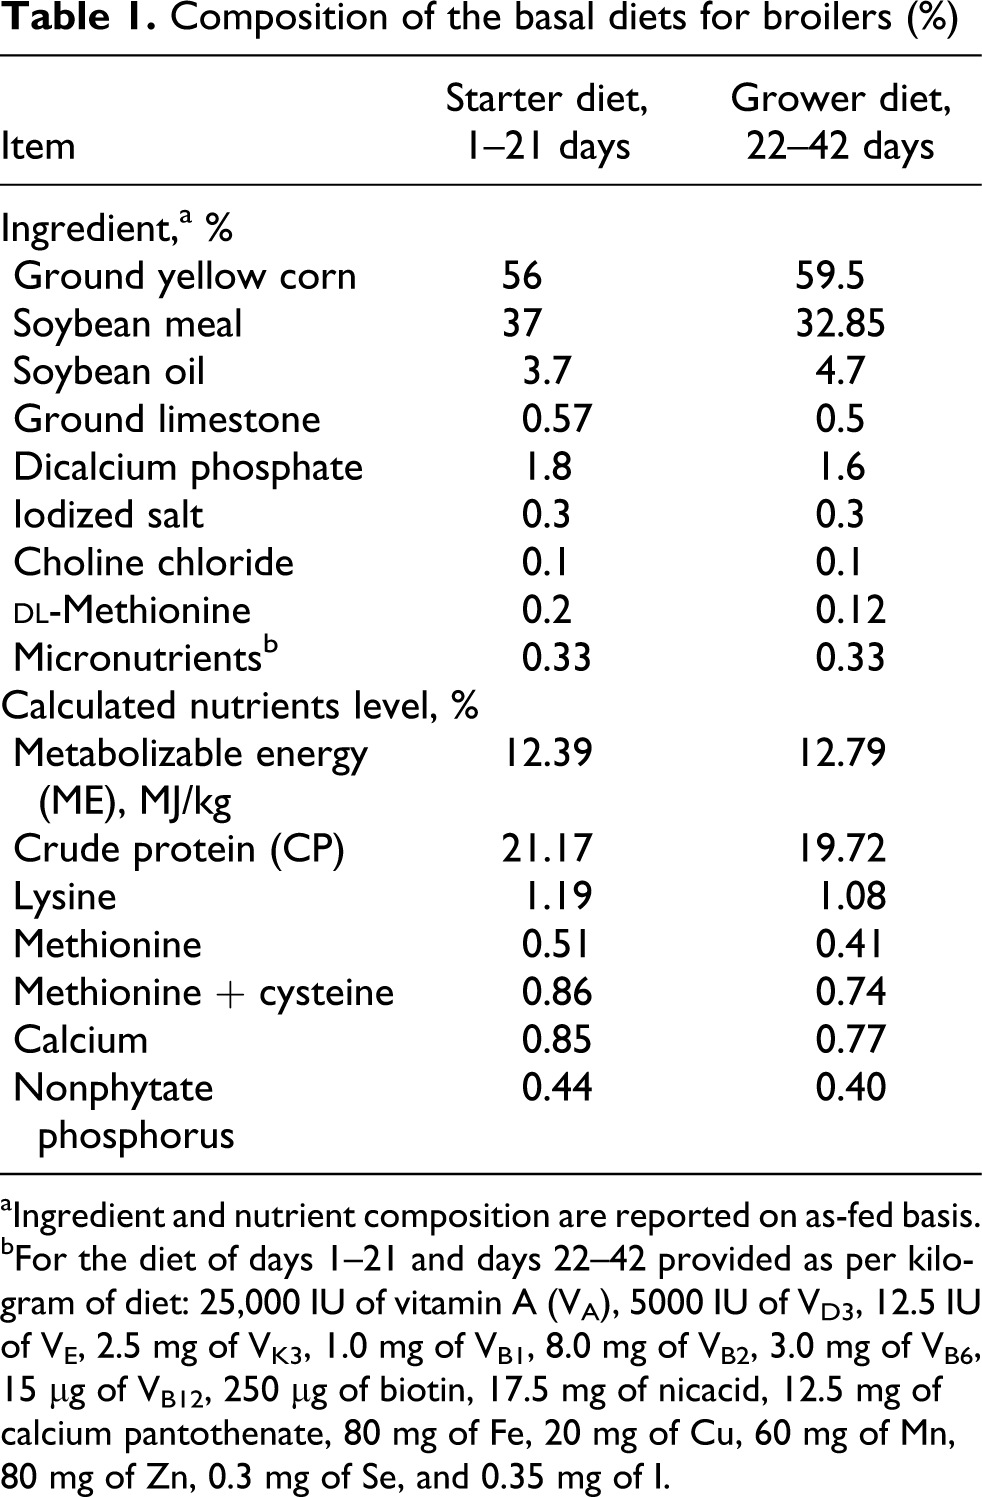
aIngredient and nutrient composition are reported on as-fed basis.
bFor the diet of days 1–21 and days 22–42 provided as per kilogram of diet: 25,000 IU of vitamin A (VA), 5000 IU of VD3, 12.5 IU of VE, 2.5 mg of VK3, 1.0 mg of VB1, 8.0 mg of VB2, 3.0 mg of VB6, 15 μg of VB12, 250 μg of biotin, 17.5 mg of nicacid, 12.5 mg of calcium pantothenate, 80 mg of Fe, 20 mg of Cu, 60 mg of Mn, 80 mg of Zn, 0.3 mg of Se, and 0.35 mg of I.
Experimental design
MEL and CYA were added to the basal diets. The first group (I) was the control group, the second group (II) was given the basal diet supplemented with MEL and CYA at levels of 10 and 3.3 mg/kg diet, respectively; the third group (III) was given the basal diet supplemented with MEL and CYA at levels of 30 and 10 mg/kg diet, respectively; the fourth group (IV) was given the basal diet supplemented with MEL and CYA at levels of 100 and 33.3 mg/kg diet, respectively; the fifth group (V) was given the basal diet supplemented with MEL 100 mg/kg; and the sixth group (VI) was given the basal diet supplemented with CYA 33.3 mg/kg. Basal diets, basal diets supplemented with MEL 100 mg/kg, and basal diets supplemented with CYA 33.3 mg/kg were formulated first and then other treatment diets were mixed. The trial lasted for 42 days. Feed intakes (FIs) were recorded daily. On days 22 and 43, BWs were recorded after a 12-h feed withdrawal, and feed/gain ratio was calculated.
Sampling and processing procedure
Two broilers per replicate were selected (within mean ± 2SD) to collect blood, and then the birds were euthanized. Samples of kidney tissues were obtained for histologic examination. The above study protocol was approved by the Department of Animal Husbandry, Ministry of Agriculture of the People’s Republic of China.
Pathologic examination and the apoptosis (AR) of kidneys
Tissues from the center of right liver and the top of right kidneys were collected and fixed in 10% buffered formalin. Liver was sampled because toxicosis was suspected. 8 Sections from fixed, paraffin-embedded tissues were stained with hematoxylin and eosin for histopathologic examination. All biopsies were examined by four investigators independently and in a blinded fashion. For each specimen, five histologic features were evaluated. The individual features of liver that were evaluated included (1) cell tumefaction; (2) fatty degeneration; (3) cell granular degeneration; (4) cell hemorrhage; and (5) vacuolus degeneration. The individual features of kidney that were evaluated included (1) dilated renal tubules; (2) small blood vessel expansion; (3) acute, interstitial, mononuclear cell infiltration; (4) interstitial hemorrhage; and (5) epithelial cell expansion. For each feature, the investigator indicated the degree of involvement with normal or no involvement, no serious pathological changes, and obvious or serious pathological changes.
On days 21 and 42, top sections of the left kidney were dissected and immediately minced with surgical scissors for the determination of the apoptosis rate (AR) of kidneys. The sections were smashed to cell suspension and filtered through a 300-mesh nylon mesh, washed twice with cold PBS, and then the cells were resuspended in 1× binding buffer (Cat. No. 51-66121E) at a concentration of 1 × 10 6 cells/ml. Transfer 100 μl of the solution to a 5 ml culture tube and then add 5 μl of annexin V-fluorescein isothiocyanate ([FITC] Cat. No. 51-65874X) and 5 μl of propidium iodide ([PI] Cat. No. 51-66211 E). Gently vortex the cells and incubate for 15 min at room temperature ([RT] 25°C) in the dark. Add 400 μl of 1× binding buffer to each tube. After that the AR were analyzed by flow cytometry (BD FACSCalibur, USA). All these work have to be completed within 6 h. 9
Blood analysis
Blood samples (10 ml) were collected via wing vein. At the time of collection, the blood samples were collected in nonheparinized tube, which were centrifuged (3000g) for 10 min to obtain serum. Serum samples were analyzed for serum total protein, albumin, globulin, sodium (Na), potassium (K), uric acid (UA), creatinine (CRE) levels, and alanine transaminase (ALT), aspartate aminotransferase (AST) activities using an automatic biochemical analyzer (TMS-1024i, USA). Serum interleukin (IL)-6, IL-8, and tumor necrosis factor (TNF)-α were determined using ELISA kits (BIO-RAD680, USA).
Residues in tissues
On day 42, muscles from right chest (about 50 g) and the left livers were collected for determining residues of MEL and CYA.
In this study, MEL and CYA were analyzed by the method of liquid chromatography–mass spectrometry (LC-MS)/MS. The samples were prepared for LC-MS/MS analysis according to the method by Lu et al. 10 LC was performed on a Varian 1200L separation module (Varian Company, USA). The mass spectrometer coupled with the high-performance liquid chromatography (HPLC) system was a triple quadrupole Quattro Ultima MS from Varian (Varian Company). A pneumatically assisted Z-spray electrospray ionization (ESI) ion source in the positive ionization mode was used throughout the experiments.
LC-MS/MS method calibration curves for MEL and CYA typically gave R 2 values of 0.9999. The recoveries from fortified samples for MEL were 87.8–107.9% over the concentration range of 0.1–5.0 mg/kg, and the recoveries of CYA were 87.3–106.1%. For each fortification level, relative standard deviation (RSD) values of MEL or CYA ranged from 0.6 to 4.3%. The limit of quantitation (LOQ) for MEL and CYA in samples, defined as concentration that produced an S/N ratio of 10, was 10 ng/g in tissues. The LOD for MEL and CYA, defined as the concentration that produced an S/N ratio of 3, was 2 ng/g in tissues.
Statistics analysis
All data were subjected to one-way analysis of variance (ANOVA) using SPSS 11.5 software. Duncan’s multiple-range test was used to compare the significance of differences among group means. The level of significance was chosen at p < 0.05. Date was expressed as mean ± SD.
Results
The determined MEL and CYA levels in the finisher experimental diets are summarized in Table 2.
Values of CYA and MEL in the experimental diets
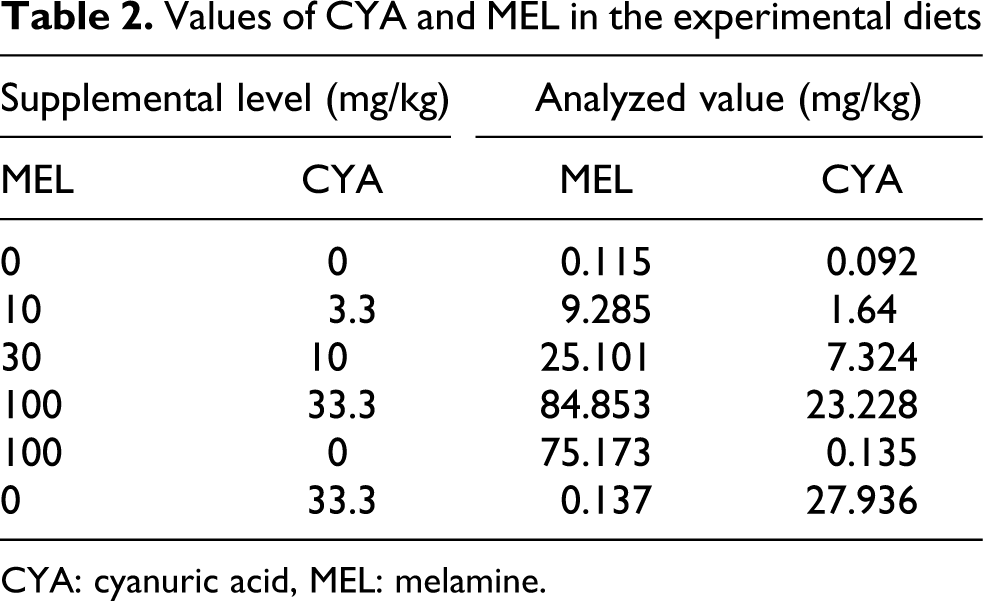
CYA: cyanuric acid, MEL: melamine.
Growth performance
There were no visible signs of ill health or changes in the behavior of broilers during the 42 days of experimental period. The effects of MEL and CYA on performance of broilers were presented in Table 3 . During the phase days 1–21, when combined with MEL and CYA, the FIs were not significantly affected by treatments (p > 0.05), the average daily gain (ADG) of group II (MEL and CYA, 10 and 3.3 mg/kg), and the ratio of feed to gain (F/G) of group III (MEL and CYA, 30 and 10 mg/kg) were significantly reduced. The FI and ADG of CYA alone were significantly decreased, and the F/G was significantly increased. During the phase days 22–42 and days 1–42, no effects of treatments were observed on FI, ADG, and F/G.
Effect of MEL and CYA on growth performance of broilersa

CYA: cyanuric acid, MEL: melamine.
a
Blood profile
On day 21, the serum K concentration was significantly greater in broilers fed with 10 mg/kg MEL and 3.3 mg/kg CYA diets than other groups (Table 4 ), the UA concentration was significantly greater in broilers fed with 100 mg/kg MEL and 33.3 mg/kg CYA diets than other groups (p < 0.05). On day 42, the serum Na concentration were significantly increased (p < 0.05).
Effects of MEL and CYA on serum biochemistry indexes of broilers

ALB: albumin, ALT: alanine transaminase, AST: aspartate aminotransferase, CRE: creatinine, CYA: cyanuric acid, GLO: globulin, K: potassium, MEL: melamine, Na: sodium, TP: total protein, UA: uric acid.
a Different lowercase letters (a, b, and c) in the same row mean significant difference between the treatments (p < 0.05), and same lowercase letter in the same row means no significant difference between treatments (p > 0.05).
On day 21, the level IL-8 of 30 mg/kg MEL and 10 mg/kg CYA group was significantly increased in serum (p < 0.05; Table 5 ). On day 42, in the MEL alone group the level of TNF-α was significantly increased (p < 0.05); in the CYA alone group the level of IL-8 was significantly increased (p < 0.05); and in the 100 mg/kg MEL and 33.3 mg/kg CYA group the levels of TNF-α and IL-8 were significantly increased in serum (p < 0.05).
Effects of MEL and CYA on serum IL-6, IL-8, and TNF-α levels of broilers

CYA: cyanuric acid, IL: interleukin, MEL: melamine, TNF: tumor necrosis factor.
aDifferent lowercase letters (a, b, and c) in the same row mean significant difference between the treatments (p < 0.05), and same lowercase letter in the same row means no significant difference between treatments (p > 0.05).
Pathologic examination
Histological lesions of broiler dosed with the combination of MEL and CYA were limited to the livers (Figure 1 ). No pathological changes were observed in the liver of broilers administered with MEL and CYA (10 and 3.3 mg/kg diet, respectively; Figure 1B). Histopathology revealed swelling of some hepatic cells and granular degeneration in broilers that received MEL and CYA (Figure 1C, D). Lesions within the liver were similar but with some variation in severity. In general, lesions correlated with dosage, with the highest dosage producing the most severe lesions. The hepatic cells swelled (Figure 1E, F) when MEL and CYA acid alone.

Photomicrographs of histologic preparations (hematoxylin and eosin [H&E] stain, original magnification, ×400) of livers from broiler that received melamine (MEL), cyanuric acid (CYA), or MEL and CYA for 42 days. (A) Portion of liver from the control group. (B) Portion of liver from broiler that received MEL and CYA(10 and 3.3 mg/kg diet, respectively) for 42 days, no obvious lesions were found. (C) Portion of liver from broiler that received MEL and CYA (30 and 10 mg/kg diet, respectively) for 42 days, the sinusoid of liver with mild congestion, and this appearance was similar to that of the liver from B. (D) Portion of liver from broiler that received MEL and CYA (100 and 33.3 mg/kg diet, respectively) for 42 days, the hepatic cells swelling around the central vein (←), part of hepatic cells showed granular degeneration. (E) Portion of liver from broilers that received MEL (100 mg/kg) for 42 days, some of the hepatic cells swelled (←). (F) Portion of liver from broiler that received CYA (33.3 mg/kg) for 42 days, the hepatic cells around the central vein appeared swollen (←) and some hepatic cells were deformed.
Histological lesions of kidney were similar to that in the liver, which correlated with dosage, with the highest dosage producing the most severe lesions in the group that received a combination of MEL and CYA (Figure 2C, D). The kidney lesions of the group feeding MEL and CYA alone were similar to that of group IV (Figure 2E, F). Crystals were not found in the kidneys of any broilers.

Photomicrographs of histologic preparations (hematoxylin and eosin [H&E] stain, original magnification, ×400) of sections of kidneys from broilers that received melamine (MEL), cyanuric acid (CYA), or MEL and CYA for 42 days. (A) Portion of kidney from the control group. (B) Portion of kidney from broilers that received MEL and CYA (10 and 3.3 mg/kg diet, respectively) for 42 days. Moderately pigmented renal glomeruli in cortical area are evident and this appearance was similar to that of kidneys from the control group. (C) Portion of kidney from broilers that received MEL and CYA (30 and 10 mg/kg diet, respectively) for 42 days. Part of the renal epithelial eosinophilic cytoplasm (→), tubular cell necrosis. (D) Portion of kidney from broilers that received MEL and CYA (100 and 33.3 mg/kg diet, respectively) for 42 days. Some of the renal glomeruli showed swelling and deforming (←). (E) Portion of kidney from broilers that received melamine (100 mg/kg diet) for 42 days. The renal epithelial cells appeared swelling, more ballooning degeneration of cells (←). (F) Portion of kidney from broilers that received cyanuric acid (33.3 mg/kg diet) for 42 days. Part of renal epithelial cells appeared swelling and pyknotic nuclei (←).
No difference was observed on the rate of renal cell apoptosis after feeding a combination of MEL and CYA (Table 6 ). On day 42, the rate of renal cell apoptosis in the MEL alone group was significantly increased (p < 0.05); and on days 21 and 42 the rate of renal cell apoptosis in the CYA alone group was significantly increased (p < 0.05).
Effects of MEL and CYA on the rate of renal cell apoptosis in broilers (%)

CYA: cyanuric acid, MEL: melamine.
Residue of MEL and CYA in the tissues of broilers
Residues of MEL and CYA in liver and muscle are shown in Table 7 , when the broilers were fed with MEL, CYA, and MEL and CYA diets for 42 consecutive days. Residues of MEL in liver and muscle of broiler increased following the increased MEL concentration in feed. MEL concentrations were 125 μg/kg wet weight and 111 μg/kg in liver and 105 μg/kg wet weight and 94 μg/kg in muscle, when the broilers were administered MEL alone (100 mg/kg diet) and MEL and CYA (100 and 33.3 mg/kg diet), respectively. There was no significant difference in MEL concentrations in liver and muscle between groups I, II, III, and VI (p > 0.05). CYA residue was highest (73 μg/kg) in liver, when the broilers received CYA alone (33.3 mg/kg diet). However, the residues of CYA were not detected in the muscle of broilers.
MEL and CYA residues in tissues of broilers exposed the diets containing MEL, CYA, and MEL and CYA for 42 consecutive daysa

CYA: cyanuric acid, MEL: melamine, ND: not detectable. a The unit of MEL and CYA in tissue is μg/g.
b Different lowercase letters (b, c, and d) in the same column mean significant difference between the treatments (p < 0.05), and same lowercase letter in the same column means no significant difference between treatments (p > 0.05).
Discussion
In this experiment, when adding MEL alone, no effects were observed. These results are in agreement with a study conducted by Yan et al. who reported that BWs and FI were not affected when fed the diet containing MEL alone in ducks. 11 Lu et al. reported the similar results in broilers. 12 But when MEL was administered daily at 10 g/animal, 2 sheep developed anorexia and died at approximately 16 and 31 days, respectively. 13 The difference between the finding in poultry and sheep may have been due to the level of MEL exposure. The exposure level in the broilers and ducks was lower.
There were few reports of studies examining the effects of CYA alone and the combination of MEL and CYA in livestock and fowl. In one study, cats receiving CYA alone, 2000 mg/kg, developed clinical signs of vomiting and anorexia within 24 h of exposure. 6 This study demonstrates that adding CYA alone, during the phase days 1–21, FI and ADG were significantly decreased and F/G was significantly increased. In the group fed with MEL and CYA combination, FI, ADG, and F/G had no significant effects on day 21 (p > 0.05), exclusive of ADG of group II and F/G of group III. But the phase days 22–42 and days 1–42, no effects in treatments were observed on FI, ADG, and F/G. In pigs after feeding diets containing MEL and CYA, the food consumption and weight gain were decreased, and the mortality rates increased. 14 We could speculate that CYA alone and the combination of MEL and CYA had adverse effects on performance, which was relating to the added dosage, duration of exposure, and animal species.
The toxicity of MEL and CYA have been reported to be low in some animal species. In one study, large doses of MEL given to dogs, rabbits, and rats reportedly had no significant clinical effects. 3 The acute toxicity of MEL in rodents is reported with oral lethal dose 50 (LD50) of 3100 mg/kg (male rats) and 3 900 mg/kg (male mice). 15 In dogs, dietary monosodium cyanurate given for 6 months at a concentration of 0.8% in diet did not result in ill effect or renal lesion. 4 In this study, no significant effects of serum chemistry parameters and pathologic section of kidney were observed in diets containing MEL alone and CYA alone. These results were in agreement with a study conducted by Puschner et al. who reported that MEL or CYA alone, even at high doses of 181 mg/kg MEL and 243 mg/kg CYA, did not have any effect on serum chemistry parameters and renal function in cats. 6 Reimschuessel et al. reported that no changes in renal functions were observed in cats and fish treated with either MEL or CYA alone at doses of 181 or 400 mg/kg of BW. 16 In our study, in the same time, histopathological assessment of liver revealed that MEL or CYA alone induced swelling or deformation in the liver cells. However, we did not know the mechanism of liver damage.
In recent studies, cats and rats feeding diet containing a mixture of MEL and CYA showed significantly elevated blood urea nitrogen (BUN) and CRE and clinical signs indicated acute renal failure and the presence of renal crystals. 6,17,18 In our study, the serum UA level of group IV was significantly higher than the control group.
Histopathological assessment also revealed the swelling of renal epithelial cells. These results showed the kidney was slightly damaged. But this study did not show renal crystals in the kidneys, it is possible that species differences in renal physiology might have contributed to variable crystal precipitation. At the same time, the dose of MEL and CYA was lower than other studies.
After repeated dietary administration of high-dose MEL to rats and mice, the main toxic effects are calculi formation, inflammatory reactions, and hyperplasia in the urinary bladder. 19,20 Puschner et al. also presumed that inflammation reactions and cell death had resulted in renal damage. 6 In our study, on day 42, the IL-8, TNF-α level, and the rate of renal cell apoptosis in MEL alone group (exclude IL-8 level), CYA alone group, and the group IV were higher than the control group. To the authors’ knowledge, there are no reports of inflammatory factors and cell apoptosis studies examining MEL, CYA, and the combined effects of MEL and CYA in livestock and fowl. In the present study, these results confirmed the inflammatory reaction and renal cell apoptosis in broilers.
The carryover of MEL from animal feed to animal-derived products is an important subject for risk assessment purpose. Bermudez et al. indicated broilers were fed diets containing 0, 0.5, 1.0, 1.5, 2.0, 2.5, and 3.0% of MEL from 1 to 21 days of age. For the 3.0% dose group, MEL concentrations in pectoral muscle and liver were found to be 600 and 700 mg/kg, respectively. 21 In the study of Lu et al., lambs were fed diets containing 2–100 mg/kg MEL for 60 days. The maximum MEL concentrations in lamb tissues were 22–374 μg/kg in muscle and 21–412 μg/kg in liver. 10 In the present study, MEL residues in liver and muscle of broiler increased following the increase in MEL concentration in feed. The maximum MEL concentrations were 125 μg/kg wet weight and 111 μg/kg in liver, and 105 μg/kg wet weight and 94 μg/kg in muscle, when the broilers were administered MEL alone (100 mg/kg diet) and MEL and CYA (100 and 33.3 mg/kg diet), respectively. None of the MEL concentrations exceeded the maximum permitted residue level (2.5 mg/kg in food) set by the US Food and Drug Administration. 22 To the authors’ knowledge, there are few reports of residue studies of CYA in any animal species. This study demonstrated that the liver of the broilers receiving MEL alone, CYA alone, and the combination of MEL and CYA with CYA of 28–73 μg/kg. Puschner et al. indicated that cats were fed diet containing MEL and CYA and the kidney of the cats contained MEL and CYA. 6 The CYA concentrations increased from 44 to 62 μg/kg in gluteal muscle and from 59 to 120 μg/kg in liver, when the lambs were fed diet containing 100 mg MEL and 100 mg CYA per kg diet. 10 So, we suspected that a higher dose of CYA in the diet resulted in a higher concentration in tissue.
In summary, we evaluated the toxicity of MEL and CYA alone or in combination (a 3:1 mass ratio) at lower dose and the deposition of MEL and CYA in broilers. The results indicated that MEL alone, CYA alone, and a combination of MEL and CYA inhibit the growth and damage the kidney and liver. A higher dose of MEL and CYA in the diet resulted in more serious lesions. The livers contained MEL concentrations of 17–125 μg/kg wet weight and CYA concentrations of 28–73 μg/kg wet weight, and the muscles contained MEL concentrations of 14–105 μg/kg wet weight. Our study may provide some information for further work on the human health risk assessment of MEL and CYA toxicology.
This study was supported by the Special Fund for Establishment of Maximum Residue Limit of MEL in feed (Ministry of Agriculture, PR China) and the specific research supporting program for academic sustentation research team in Sichuan Agricultural University.