
Abstract
One of the often employed flow structures in vertical pumping stations is the siphon outlet pipe. It has a complicated geometric structure and internal flow field, which directly affects how effectively, safely, and steadily pumping stations operate. The entire flow conduit of the vertical axial flow pump device was adopted as the study object in order to elucidate the mechanism of the internal biased flow of the siphon outlet pipe caused by the axial flow pump under different flow conditions, and the three-dimensional unsteady flow field of the vertical axial flow pump device was numerically solved using the numerical simulation technique. Physical model tests were used to confirm the results of the numerical simulation. The findings demonstrate that there is a horizontal bias in the flow of the inlet surface and outlet surface of the elbow pipe of the siphon outlet pipe, and that when the flow rate rises, the degree of the horizontal bias in the flow gradually diminishes, and the ratio of biased flow gradually decreases. The flow in hump segment presents up-and-down flow, and when the flow rate increases, the ratios of biased flow first rises before falling. The major causes of the production of biased flow in the outlet pipe are residual velocity circulation at the guide vane's outlet, wall constraint at the elbow pipe, and flow inertia; Under various flow conditions, the morphologies of the vortex structures in the outlet pipe vary; the characteristics of the energy conversion of each part of the pump device are disclosed, with the inlet pipe having the lowest proportion of energy conversion. Under the optimal flow condition, the elbow-inlet pipe's proportion of energy conversion is only around 1.04%, and the proportions of the guide vane, 60° elbow pipe, and siphon outlet pipe's energy conversion are significant and fluctuate with time. The proportion of energy conversion in the elbow-inlet pipe and siphon outlet pipe steadily increases as flow rate rises, but the proportion in the guide vane and 60° elbow pipe drops initially before increasing.
Introduction
Axial flow pumps are extremely important in agricultural irrigation, urban water supply, flood control, and drainage. Vertical axial flow pump stations have the qualities of low head and high flow rate, and the axial flow pump device has the benefits of compact structure, simple installation as well as maintenance, and suitable shaft bearing force. The first phase of the East Route of the South-to-North Water Diversion Project in China saw the construction of 21 pumping stations, including 12 vertical axial flow pumping stations, accounting for 57.14%, such as Hong ze Station, Siyang Station and Zaohe No.2 Station in Jiangsu Province, China. Outlet pipe is an important component of the pump device, which has the structure type of siphon, straight pipe and low hump, etc. Among them, the siphon outlet pipe is extensively utilized in large and medium-sized pumping stations where the water level of the outlet pool does not fluctuate greatly due to its easy and dependable flow cut-off mechanism, such as Liu Laojian Station, Suining No.2 Station, and Denglou Station in China’s first phase of the East Roast of the South-to-North Water Diversion Project. Despite being widely used and having many benefits, the siphon outlet pipe's structure is complex, and the flow rate is not distributed evenly inside of it. Once the design is unreasonable, it is easy to cause problems such as the disordered internal flow pattern and vibrant unit in the conduit, resulting in the pump station cannot operate efficiently, safely and stably. Studying the flow mechanism and energy characteristics of the siphon outlet pipe in light of the conditions of entire pipe of the pump device is crucially significant from a pratical standpoint.
Domestic and international academics’ research on the axial flow pump device focuses primarily on optimizing the three-dimensional geometry of the axial flow pump device's over-flow structure, the flow field and pressure pulsation characteristics in the axial flow pump device, and the flow characteristics of the axial flow pump device in the unsteady zone. Wang et al. 1 investigated the internal instantaneous flow pattern of the inclined 15° axial flow pump device using a model test and numerical simulation, analyzing the features of the pump device’s internal flow under different flow conditions and the reasons of biased flow in the outlet pipe. Wang et al. 2 utilized numerical simulation technology to investigate the reason of biased flow in the S-shaped pipe of the inclined axial flow pump device, and they discovered a kind of “unraveling” flow structure in the S-shaped pipe, exposing the mechanism of internal biased flow in the S-shaped pipe. Zhou et al. 3 employed PIV(Particle Image Velocimetry) technology to obtain the flow field in the pipe in order to investigate the unstable flow field inside the axial flow pump under low flow conditions. The double-inltet design is then implemented to successfully increase the head performance under the low flow conditions, enhancing the internal flow pattern of the pump device. The internal flow structure of an axial flow pump device was investigated by Meng et al. 4 employing unsteady numerical simulation technology. Entropy generation theory was then utilized to study the effect on energy reduction, and a physical link was established between unstable flow and the features of energy loss brought on by uneven inflow. Kurokawa has developed a “j-groove” device that controls the angular momentum of the water flow to suppress various unstable flow phenomena in the pipe, allowing the pump to operate steadily within its flow range and effectively avoiding damage to the pump device. 5 The hydraulic performance of axial flow pumps may be significantly enhanced under low flow circumstances by applying a novel “groove flow control” approach, as demonstrated by Mu et al. 6 who implemented the technique to an axial flow pump device and explored the mechanism and effect of the technique under stall conditions through numerical simulations. Additionally, by increasing the axial velocity component, the unwanted flow patterns near the impeller’s inlet are suppressed and the internal flow field of the pipe is improved. The entire pipe of an axial flow pump device of the siphon outlet pipe was numerically simulated by Zhou et al. 7 using SST k-ω and Zwart cavitation models. When the flow passed through the guide vane and under the influence of centrifugal force, the vacuum collapsed, allowing the flow to attain a significant average vortex angle, thus avoiding large deliquescence and backflow in the outlet conduit and making the head rise. In order to numerically model the opening process of the vertical axial flow pumping station. Zhang et al. 8 employed ANSYS CFX to investigate the instantaneous features of the axial flow pumping station during the start-up and exhaust period. Sedlář et al. 9 used PIV technology to verify the numerical model, and analyzed the changes and interactions of the mainstream through the VOF (Volume of Fluid) and the proposed research methodology increased the praticability and reliability of the numerical tools which were applied for the design of the pump. The daily operating stability of a pump device is strongly impacted by pressure pulsation, and the major approach used by researchers nowadays is a combination of model test and numerical simulation. Yang et al.10,11 examined the variation law of internal flow pulsation and hydraulic noise of the axial flow pump device as the pump operating condition using a combination of model test and numerical simulation, and assessed the evolution law of the vortex structure and pulsation change in the conduit when the axial flow pump device is utilized as a turbine. The features of pressure pulsation at the pump sump were analyzed by Song et al. 12 utilizing the method of combining exploratory method and theoretical foundations anchored on the theoretical of vortex dynamics. It was demonstrated that the pressure palsation caused by floor-attached vortex is a periodic function that varies with time. Xie et al. 13 investigated the change of pressure pulsation of prototype and model pump devices using fluid dynamics simulations and model test, and the researchers concluded that the locations of the main frequency and sub-frequency are nearly identical, and when the flow rate diminishes, both the mixing and blade frequency harmonics in the inlet horns and impeller initially reduce and subsequently rise. The general internal flow structure and pressure pulsation features of axial flow pump devices under design and stall conditions were compared and based primarily on the N-S equation and the SST turbulence model by Kan et al. 14 while investigating the rotating stall flow pattern of axial flow pumps at low flow conditions. The pressure pulsation of various pump devices, including centrifugal pumps and LNG (Liquefied Natural Gas)submersible pumps, was also explored by several other academics using cutting-edge technologies like Welch and Grid slip, and improved the theory of pressure pulsation, which has contributed to solving the problem of reducing pressure pulsation and the vibration of the device caused by it, and further ensured the safety of pratical engineering.15–17
Regarding the hydraulic performance of the pump devices, the pipe’s hydraulic performance has a direct impact on its overall hydraulic efficiency and operational stability. The flow will enter the elbow pipe in a spiral pattern due to the impeller’s rotational effort and the guide vane’s ability to recover kinetic energy. When the flow enters the outlet pipe, the flow field is no longer uniformly dispersed owing to the residual circulation’s impact and the elbow pipe’s steering. It is simple to create flow seperation and vortices with the influence of inertia in the outlet pipe, which generates adverse hydraulic phenomena like vibration and excessive noise when the pump device is in use. The entire pipe of the vertical axial flow pump device is adopted as the study object in this paper, and the energy conversion law of each flow component under various flow conditions is explored. Additionally, the influence of mechanism of the axial flow pump on the features of biased flow and the modification of the spiral vortex structure in the siphon outlet pipe is studied.
Calculation models and methods
Geometric model
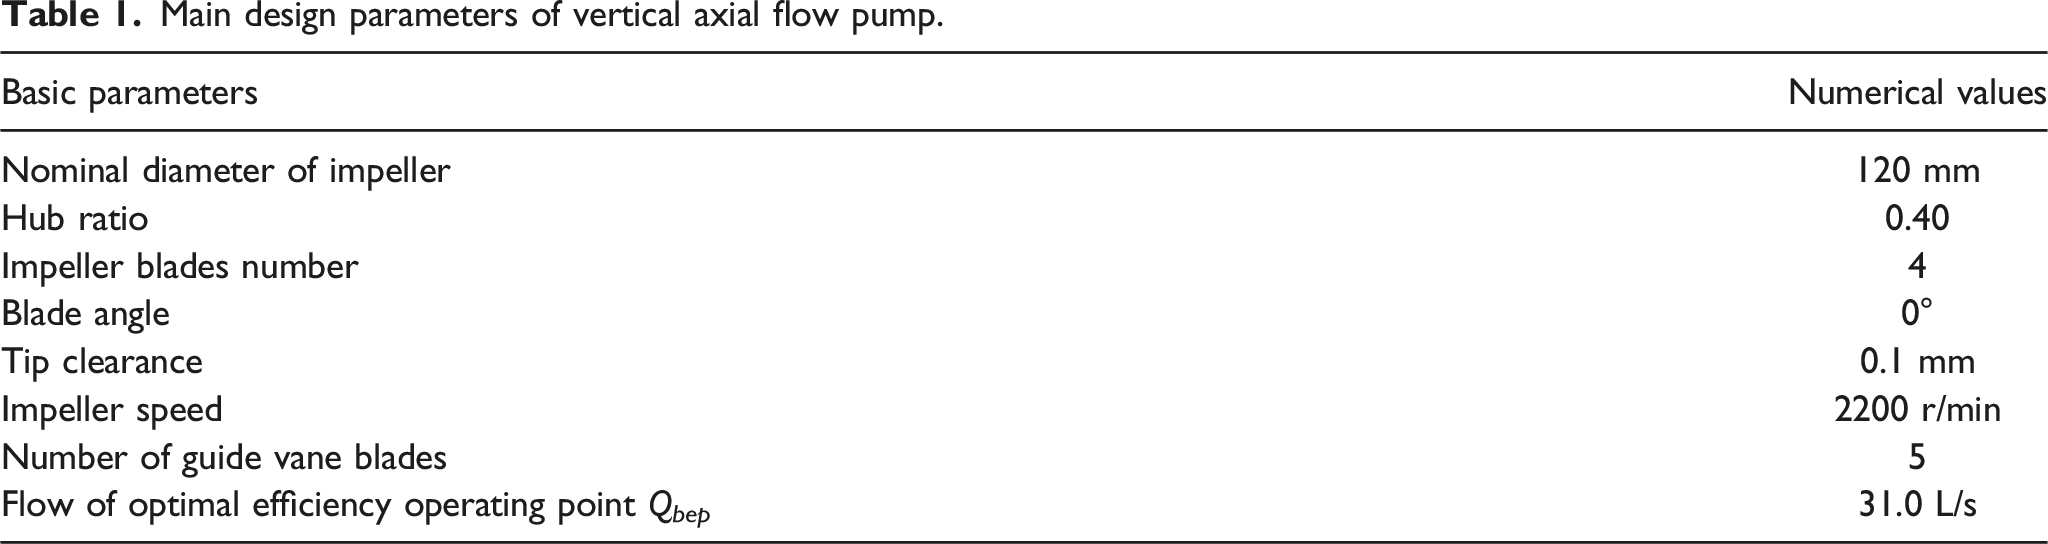
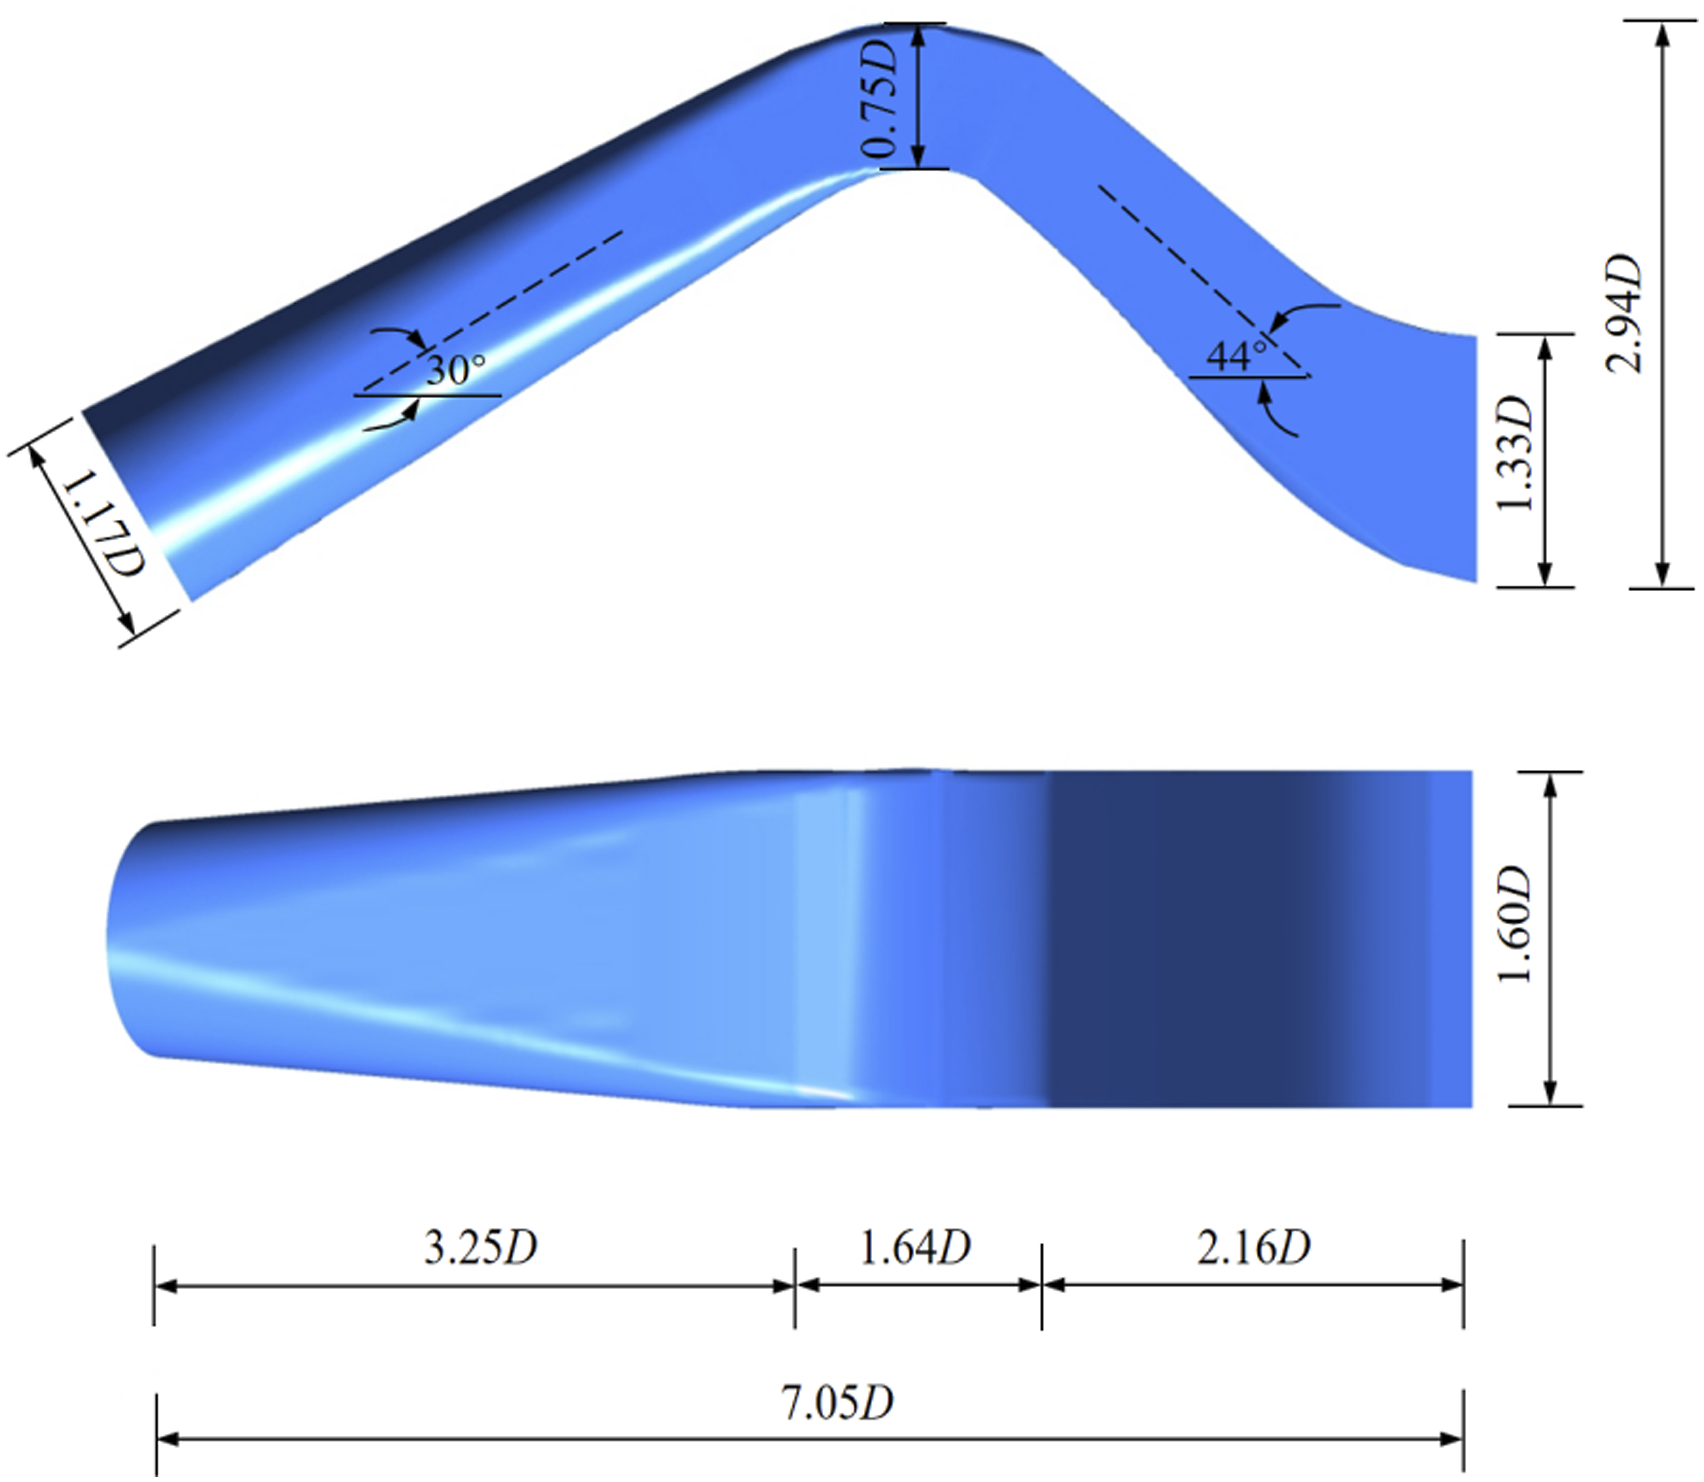
The vertical axial flow pump device, as the study object, is made up of five parts: elbow-shaped inlet pipe, impeller, guiding vane, 60° elbow pipe, and siphon outlet pipe. Three-dimensional models of the elbow-shaped pipe, the 60° elbow pipe, and the siphon outlet pipe were formed employing Siemens UG NX, while the impeller circulation domain and guide vane circulation domain were formed employing ANSYS TurboGrid. Figure 1 depicts the vertical axial flow pump device’s three-dimensional model. Table 1 displays the primary design parameters of the pump device. In the axial flow pump device, the ‘hub ratio’ is a significant geometric parameter, and the ‘hub ratio’ of the axial flow pump impeller refers to the ratio of the hub diameter to the impeller diameter, which is 0.4. The primary geometric dimensions of each component of the siphon outlet pipe are dimensionlessly transformed depending upon the nominal diameter D of the impeller. The ascending segment has an inclination angle of 30°, while the descending segment has an angle of 40°. Siphon outlet pipe dimensions are 2.94D in height and 7.05D in horizontal projection length. The pipe's accurate shape is given in Figure 2 and has an inlet surface diameter of 1.17D, an outlet surface height of 1.33D, an outlet surface width of 1.60D, and a hump segment height of 0.75D. Three-dimensional model of vertical axial flow pump device. Main design parameters of vertical axial flow pump. Size of siphon outlet pipe (D is the nominal diameter of impeller).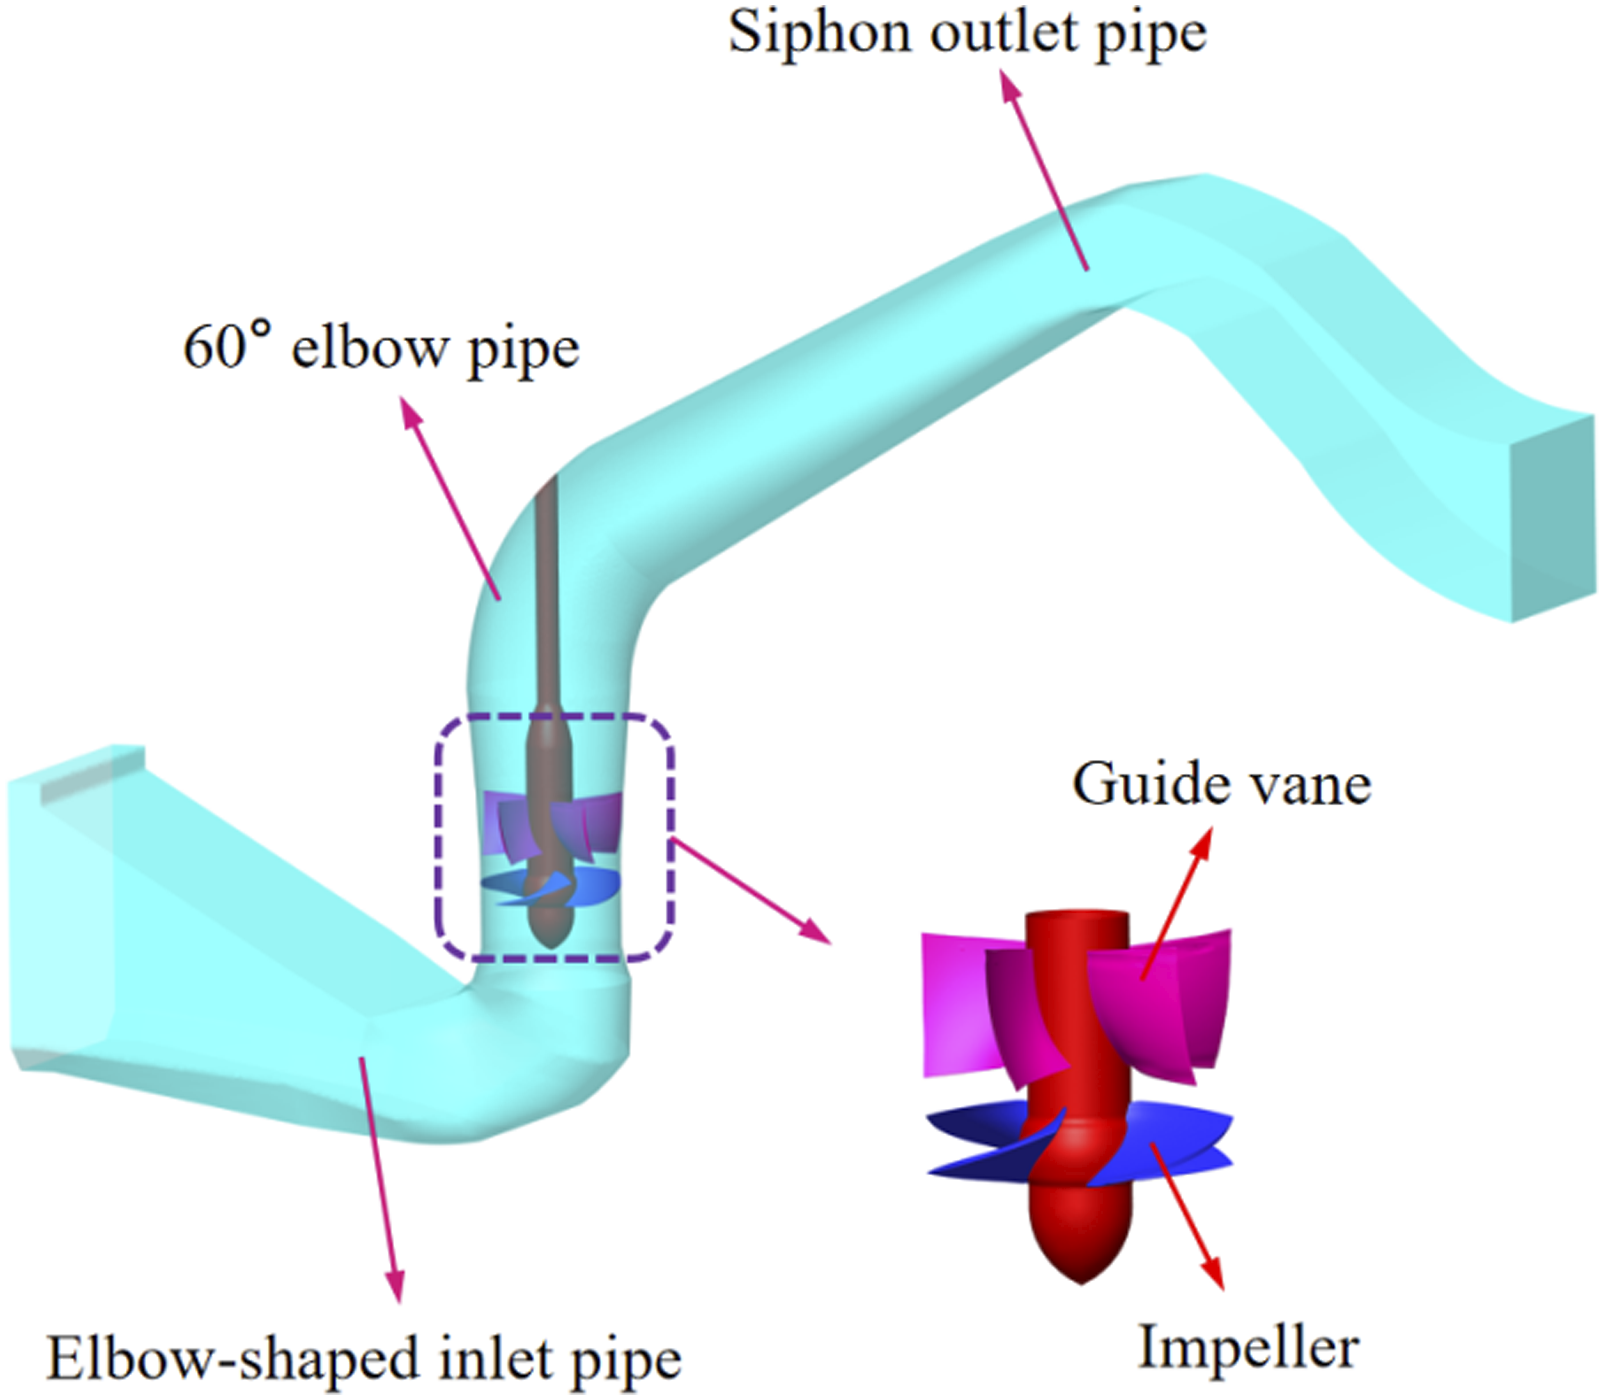
Approach of numerical calculations and boundary conditions
The viscosity coefficient is more affected by small-scale motion when using the RNG k-ε turbulence model, handling the issues of high strain rate and streamline bending better by taking into account the fluid's rotation in the translational flow. When simulating the internal flow field of an axial flow pump and pump device numerically, the turbulence model has wide applications.18–20 As a result, the complicated three-dimensional turbulent flow in the pipe is simulated in this research adopting the Reynolds average method and the RNG k-ε turbulence model. In the process of numerical simulation, the direction of water flow is from the inlet surface of the elbow-shaped inlet pipe to the outlet surface of the siphon outlet pipe. A segment of inlet extension is placed before the elbow-shaped inlet pipe to guarantee that the flow is thoroughly developed while flowing into it and that the inlet flow field is more realistic. Total pressure with a size of 1 atm setting on the inlet surface of the inlet extension segment, serves as the inlet boundary condition. The outlet boundary condition ultilizing mass flow is positioned on the outlet surface of the outlet extension segment, and an outlet extension segment is installed at the outlet of the siphon outlet pipe. The water flow in the vicinity of the wall is typically at the phase of transition from turbulent to laminar flow when it comes to the calculation of three-dimensional turbulent flow inside the pump device. Therefore, the wall function approach is applied to calculate, and the solid boundary is selected to non-slip boundary condition, ignoring any impact of wall roughness. The convergence accuracy of each physical quantity is set to 1.0 × 10⁻⁵. The GGI (General grid interface) technology is used to set the internal interface at the connection of each flow component. The interface connecting the impeller and the elbow-shaped inlet pipe, as well as the interface connecting the impeller and the guide vane, are defined as dynamic and static interfaces in the numerical calculation of a three-dimensional steady flow field, and the Stage mode is determined. The remaining components’ interface is set as None mode and is configured to be static and static; Transient rotor-stage mode is the definition of the rotor-stator interface in the numerical calculation of the three-dimensional unsteady flow field. These interfaces are used for the transmission and calculation of flow data between two flow structures. In the actual operation of the pump device, there is no interface between two flow structures, and the water flow is continuous. Every 3° rotation, which means 120 times over a cycle, the impeller is calculated.21,22 To confirm the precision and dependability of the sample data, a total of 20 impeller rotation cycles, that is, 2400 steps, were calculated. Each step is 2.2727 × 10⁻⁴, and the total time is 0.54545455 s.
Analysis of grid number independence and convergence
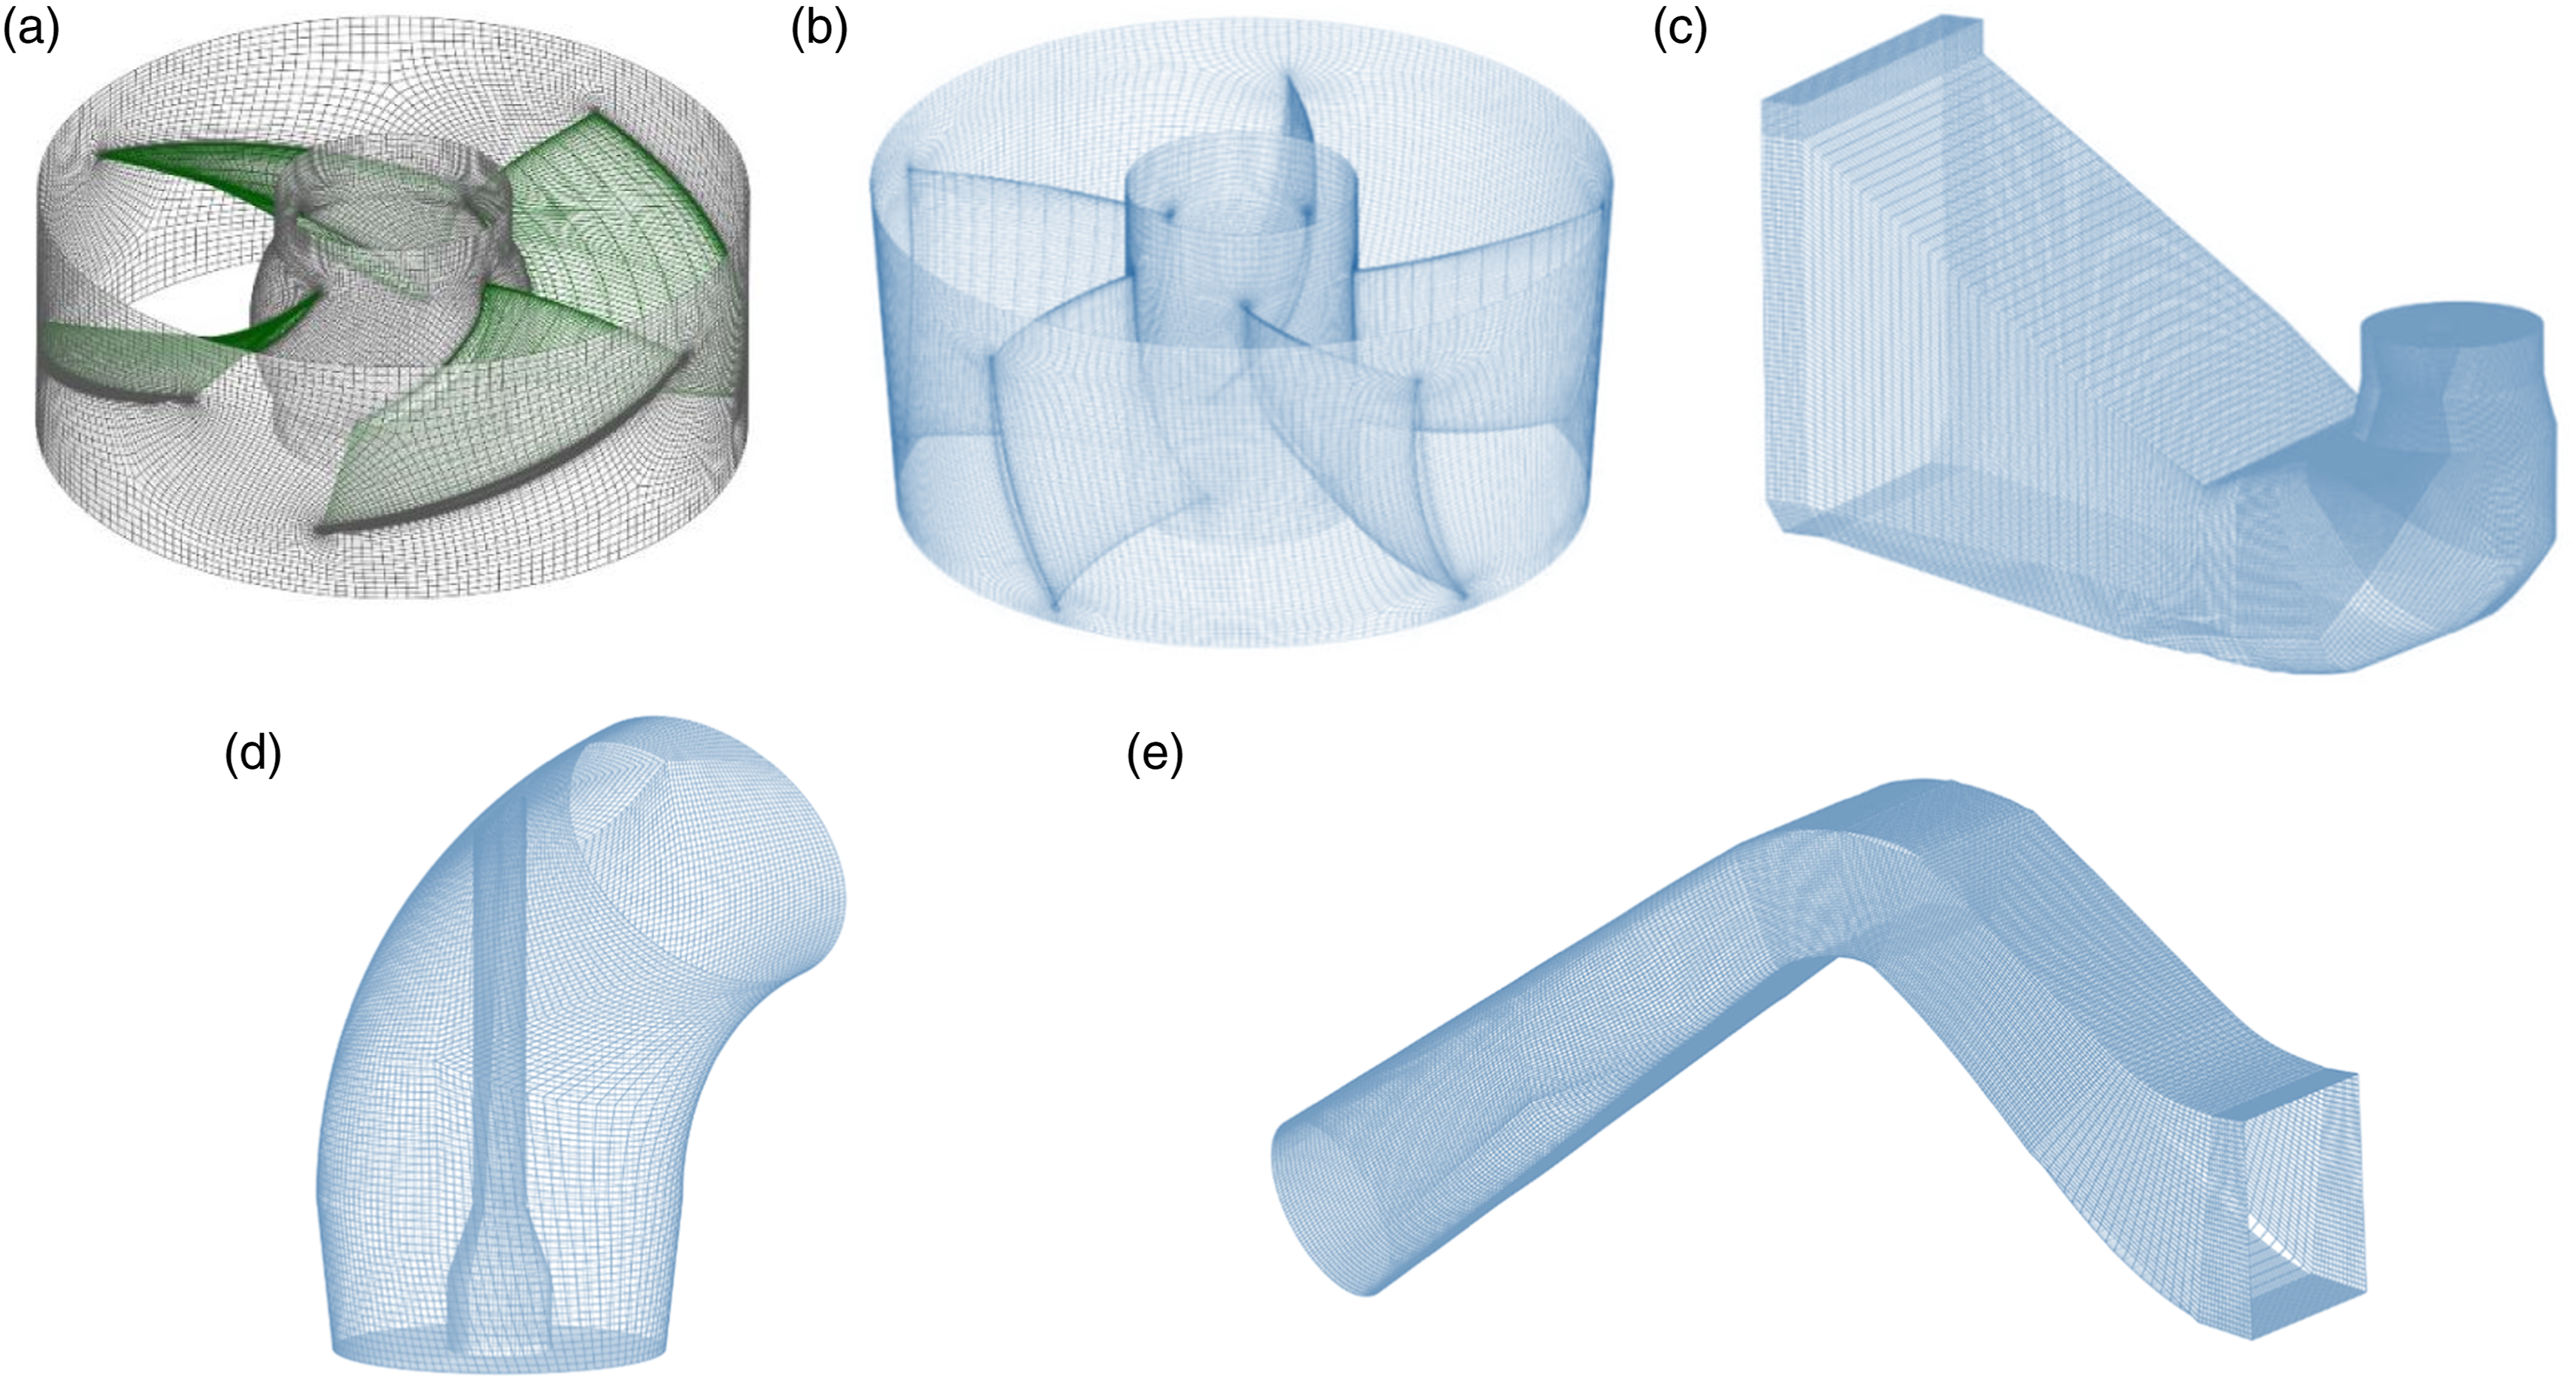
The elblow-shaped inlet pipe, 60° elbow pipe, and siphon outlet pipe are all meshed employing ICEM CFD. TurboGrid is employed to mesh the impeller and guide vane. Figure 3 illustrates the wall mesh of each flow structure. By calculating the ratio of the maximum and minimum determinant of the 2 × 2 × 2 Jacobian matrix, that the result is 1 indicates that the grid element is completely regular, that the result is 0 indicates that the grid element has one or more degraded edges. When it is higher than 0.4, it can be considered that the grid quality is good.
23
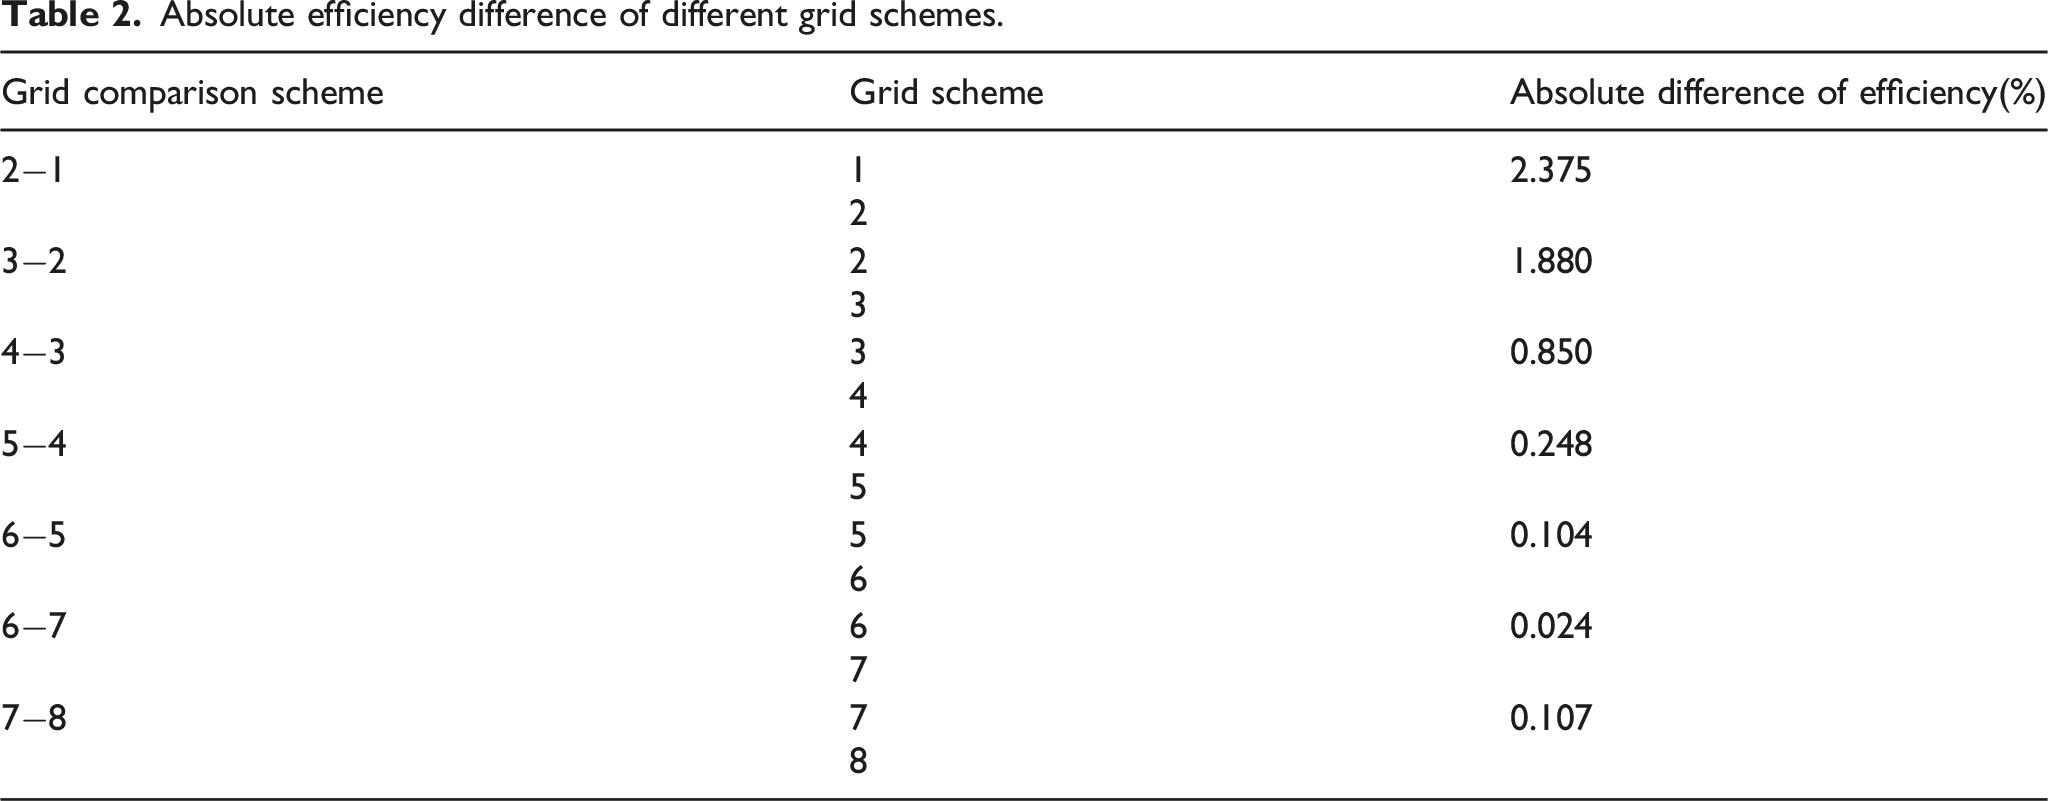
After the grid quality inspection, all the grid quality is above 0.5, which meets the calculation requirements. This paper selects the calculation results of the impact of different grid numbers on the efficiency of the pump device under 1.0Q
bep
to investigate the independence of the number of grids and minimize the impact of the number and size of the grid on the calculation results. Eight schemes are compared: The number of grids is 1000000, 2500000, 3000000, 3900000, 5100000, 5470000, 6000000 and 7000000. The rationality of the number of grids is verified by comparing the absolute difference of efficiency between the two schemes. The calculation formula of efficiency of pump device is: Wall grid diagram of each flow component of the pump device: (a) Impeller, (b) guide vane, (c) elbow-shaped inlet pipe, (d) 60° elbow pipe and (e) siphon outlet pipe.
The absolute difference of efficiency of pump device is:
Absolute efficiency difference of different grid schemes.
Number independence of grids.
Grid convergence index.
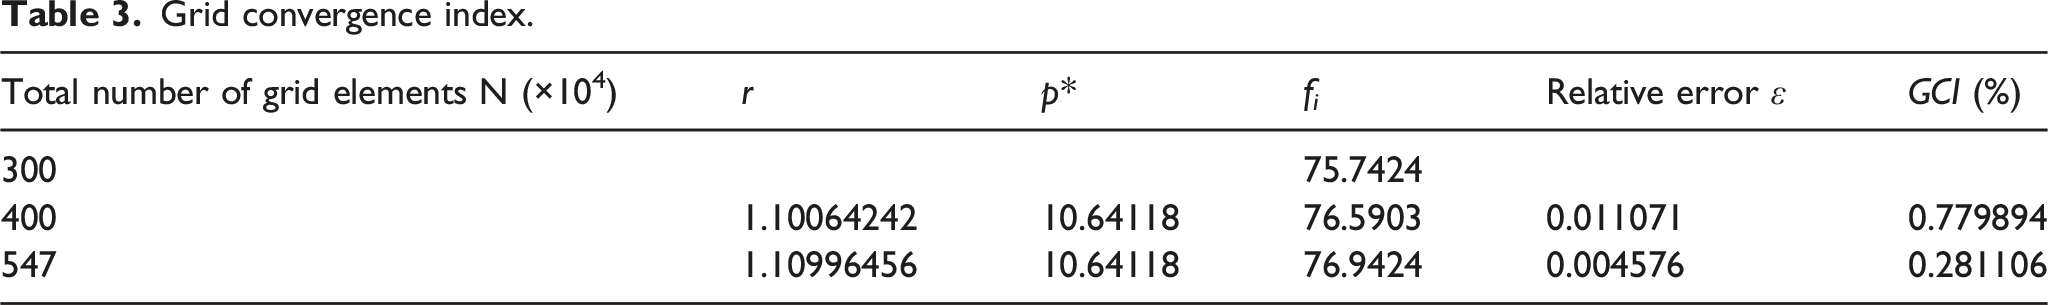
The GCI declines as the number of grids rises, and its proportions are less than 1%, indicating that discretization error is small. It is only 0.28% when there are 5470000 grids. Therefore, the scheme of 5470000 grids is ultimately chosen in combination with the analysis of the independence of the number of grids.
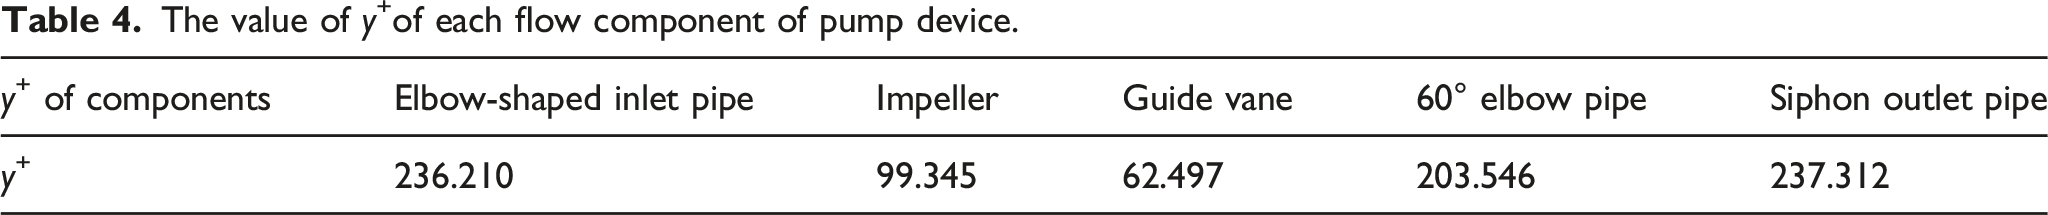
The flow field in the vicinity of the wall is calculated applying the wall function method. To describe the gap between the first layer node and the wall, the dimensionless parameter y+ is proposed. Its expression is: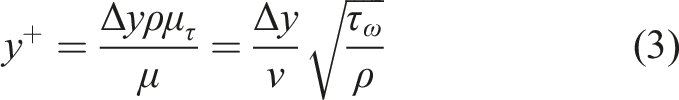
The value of y+of each flow component of pump device.
Model test and energy performance verification
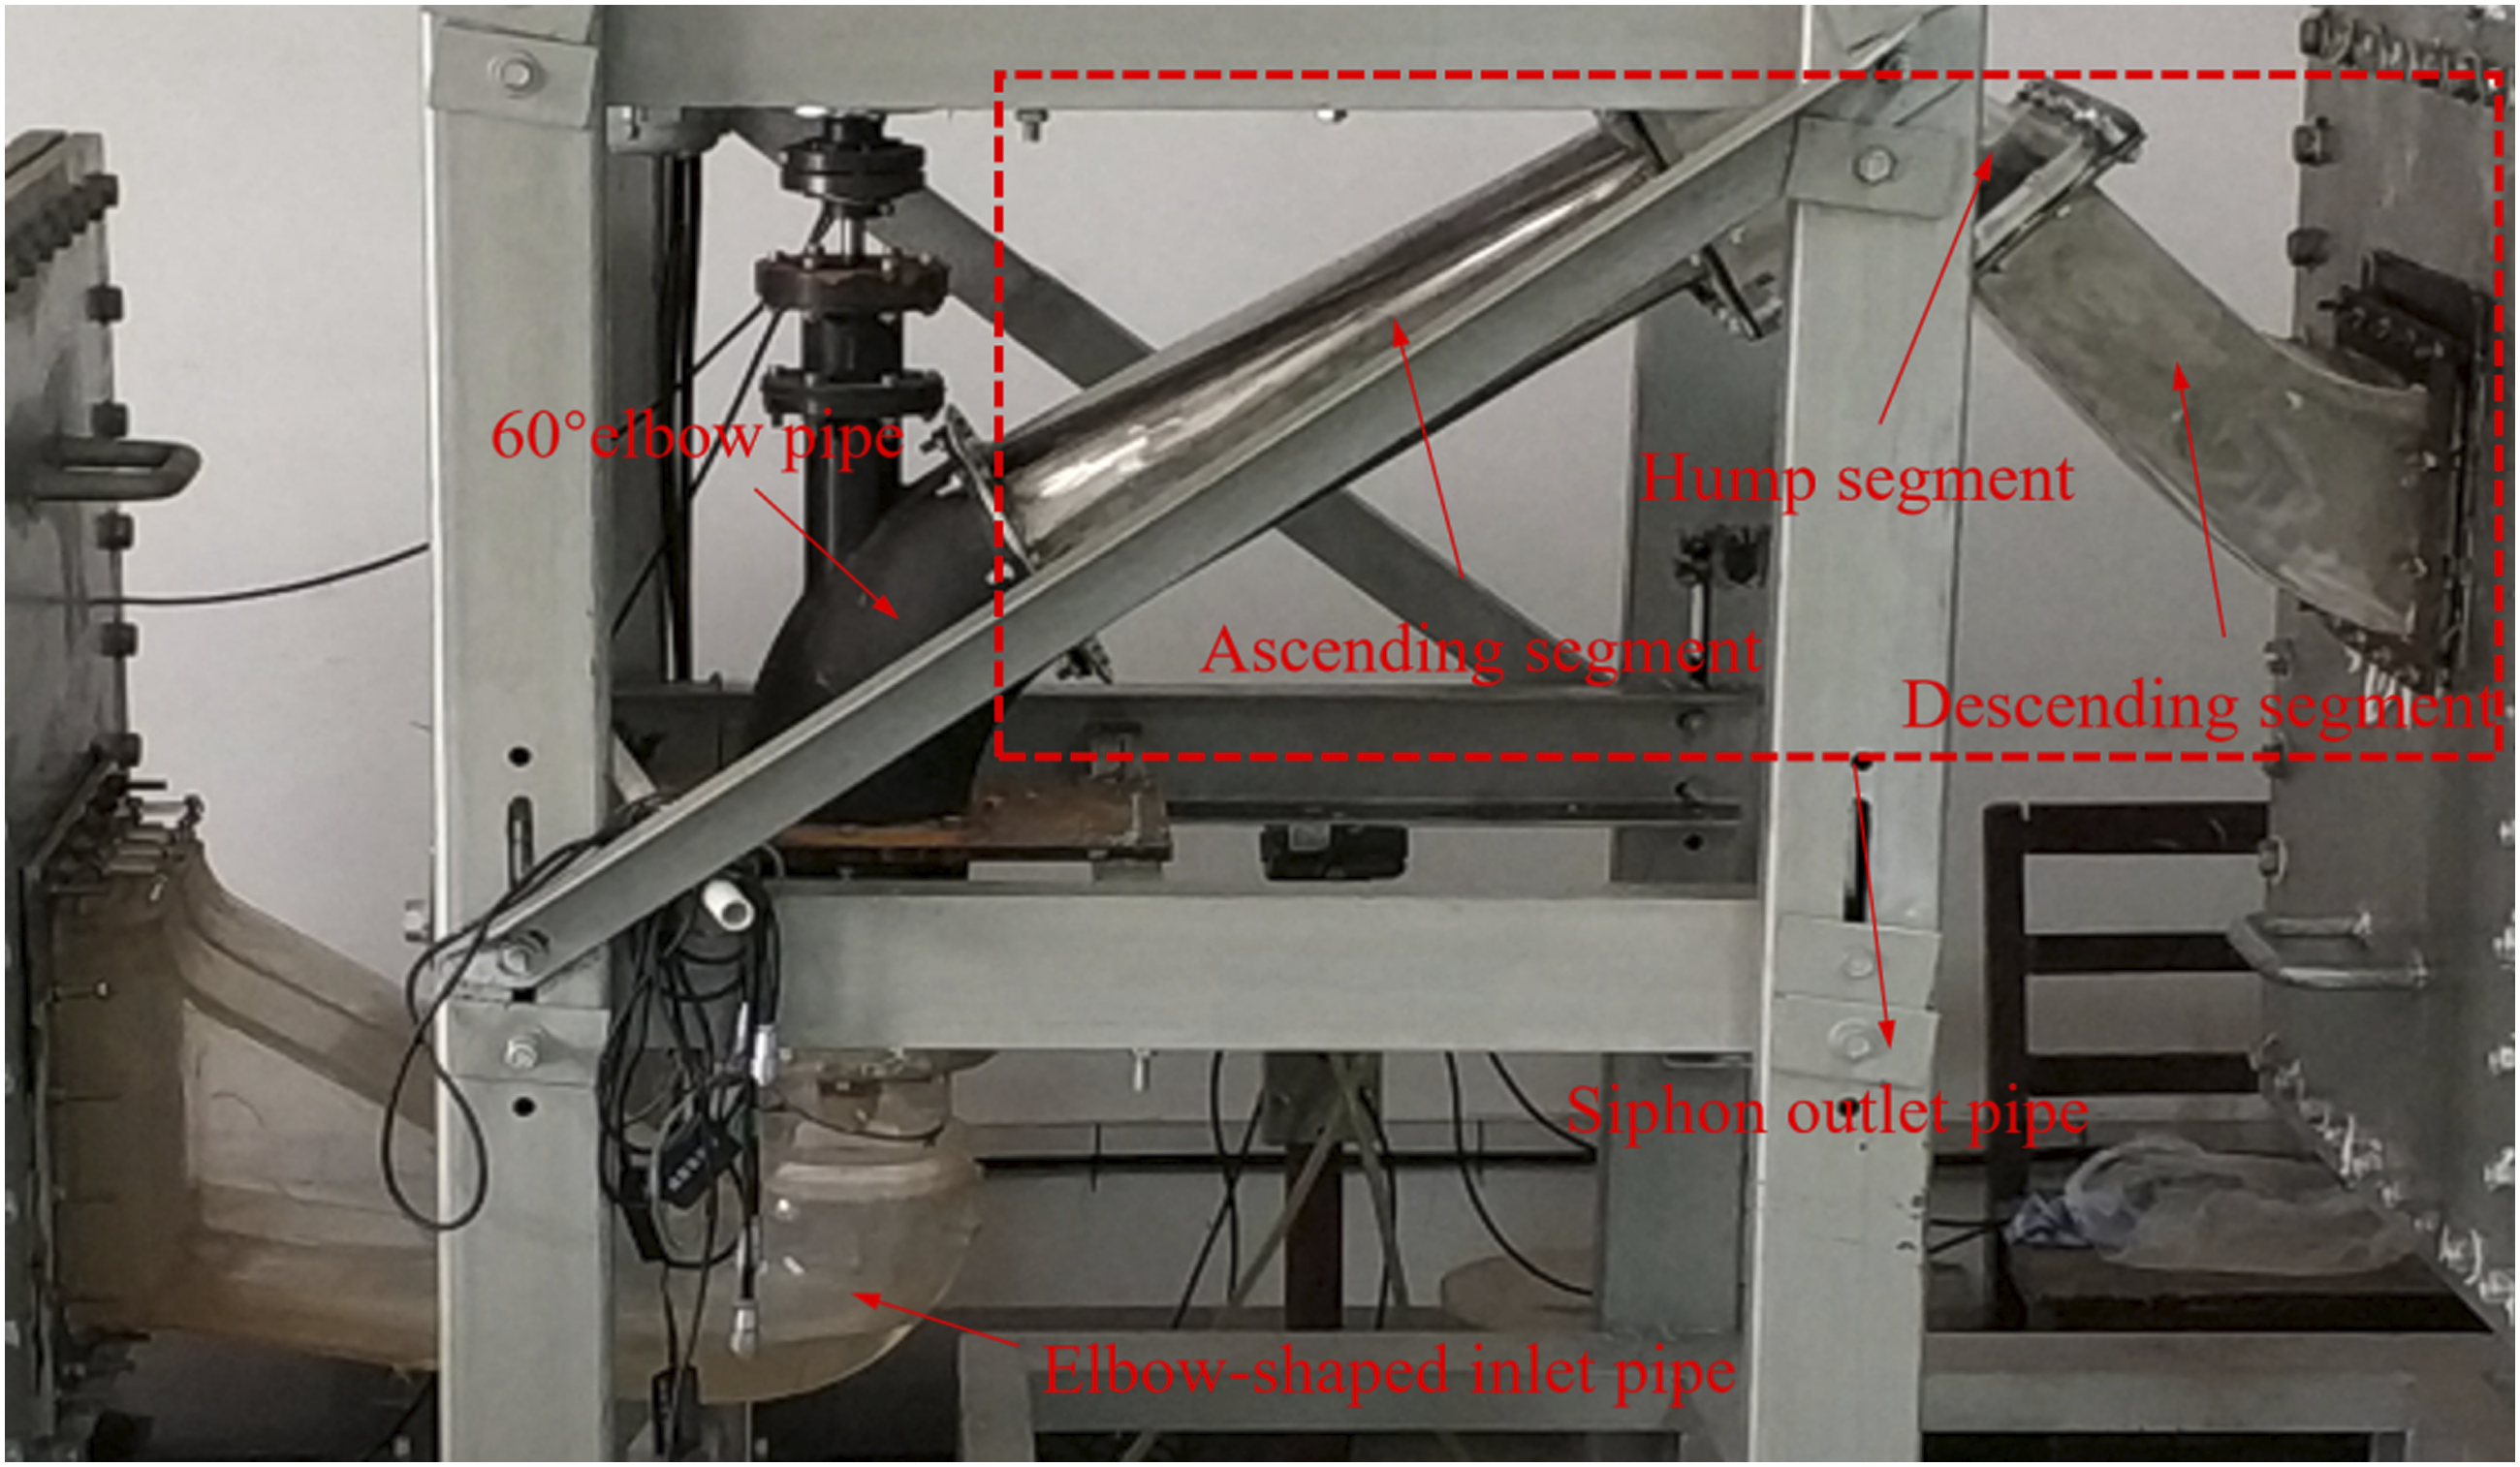
The Core Laboratory of Water Conservancy and Power Engineering’s closed cycle hydraulic equipment test bench, located in Jiangsu Province, China, served as the site for the vertical axial flow pump device’s model test. The three-dimensional model is shown in Figure 5. By using numerical control machine tools, the impeller is manufactured from brass, the guide vane is welded together with stainless steel, as well as the elbow-shaped inlet pipe is made of acrylic. The ascending segment, hump segment and descending segment are made of various materials to analyze the hump segment. The ascending segment and the descending segment are processed by stainless steel metal, and the hump segment is made of acrylic material.The physical model of siphon outlet pipe is shown in Figure 6. Standards of “Pump model and pump device model acceptance test procedure” and “Hydraulic turbines, pumps and pump-turbines-Model acceptance tests (IEC60193-1999)” were followed during the energy performance test of the pump device. To ensure the accuracy of the numerical simulation, the vertical axial flow pump device’s energy performance at 2200 r/min was tested and compared with the numerical simulation findings. Table 5 illustrates the primary measuring variables and tools. Three-dimensional schematic diagram of vertical axial flow pump device physical model test bench. Physical objects of vertical axial flow pump device. External characteristics and measuring equipments.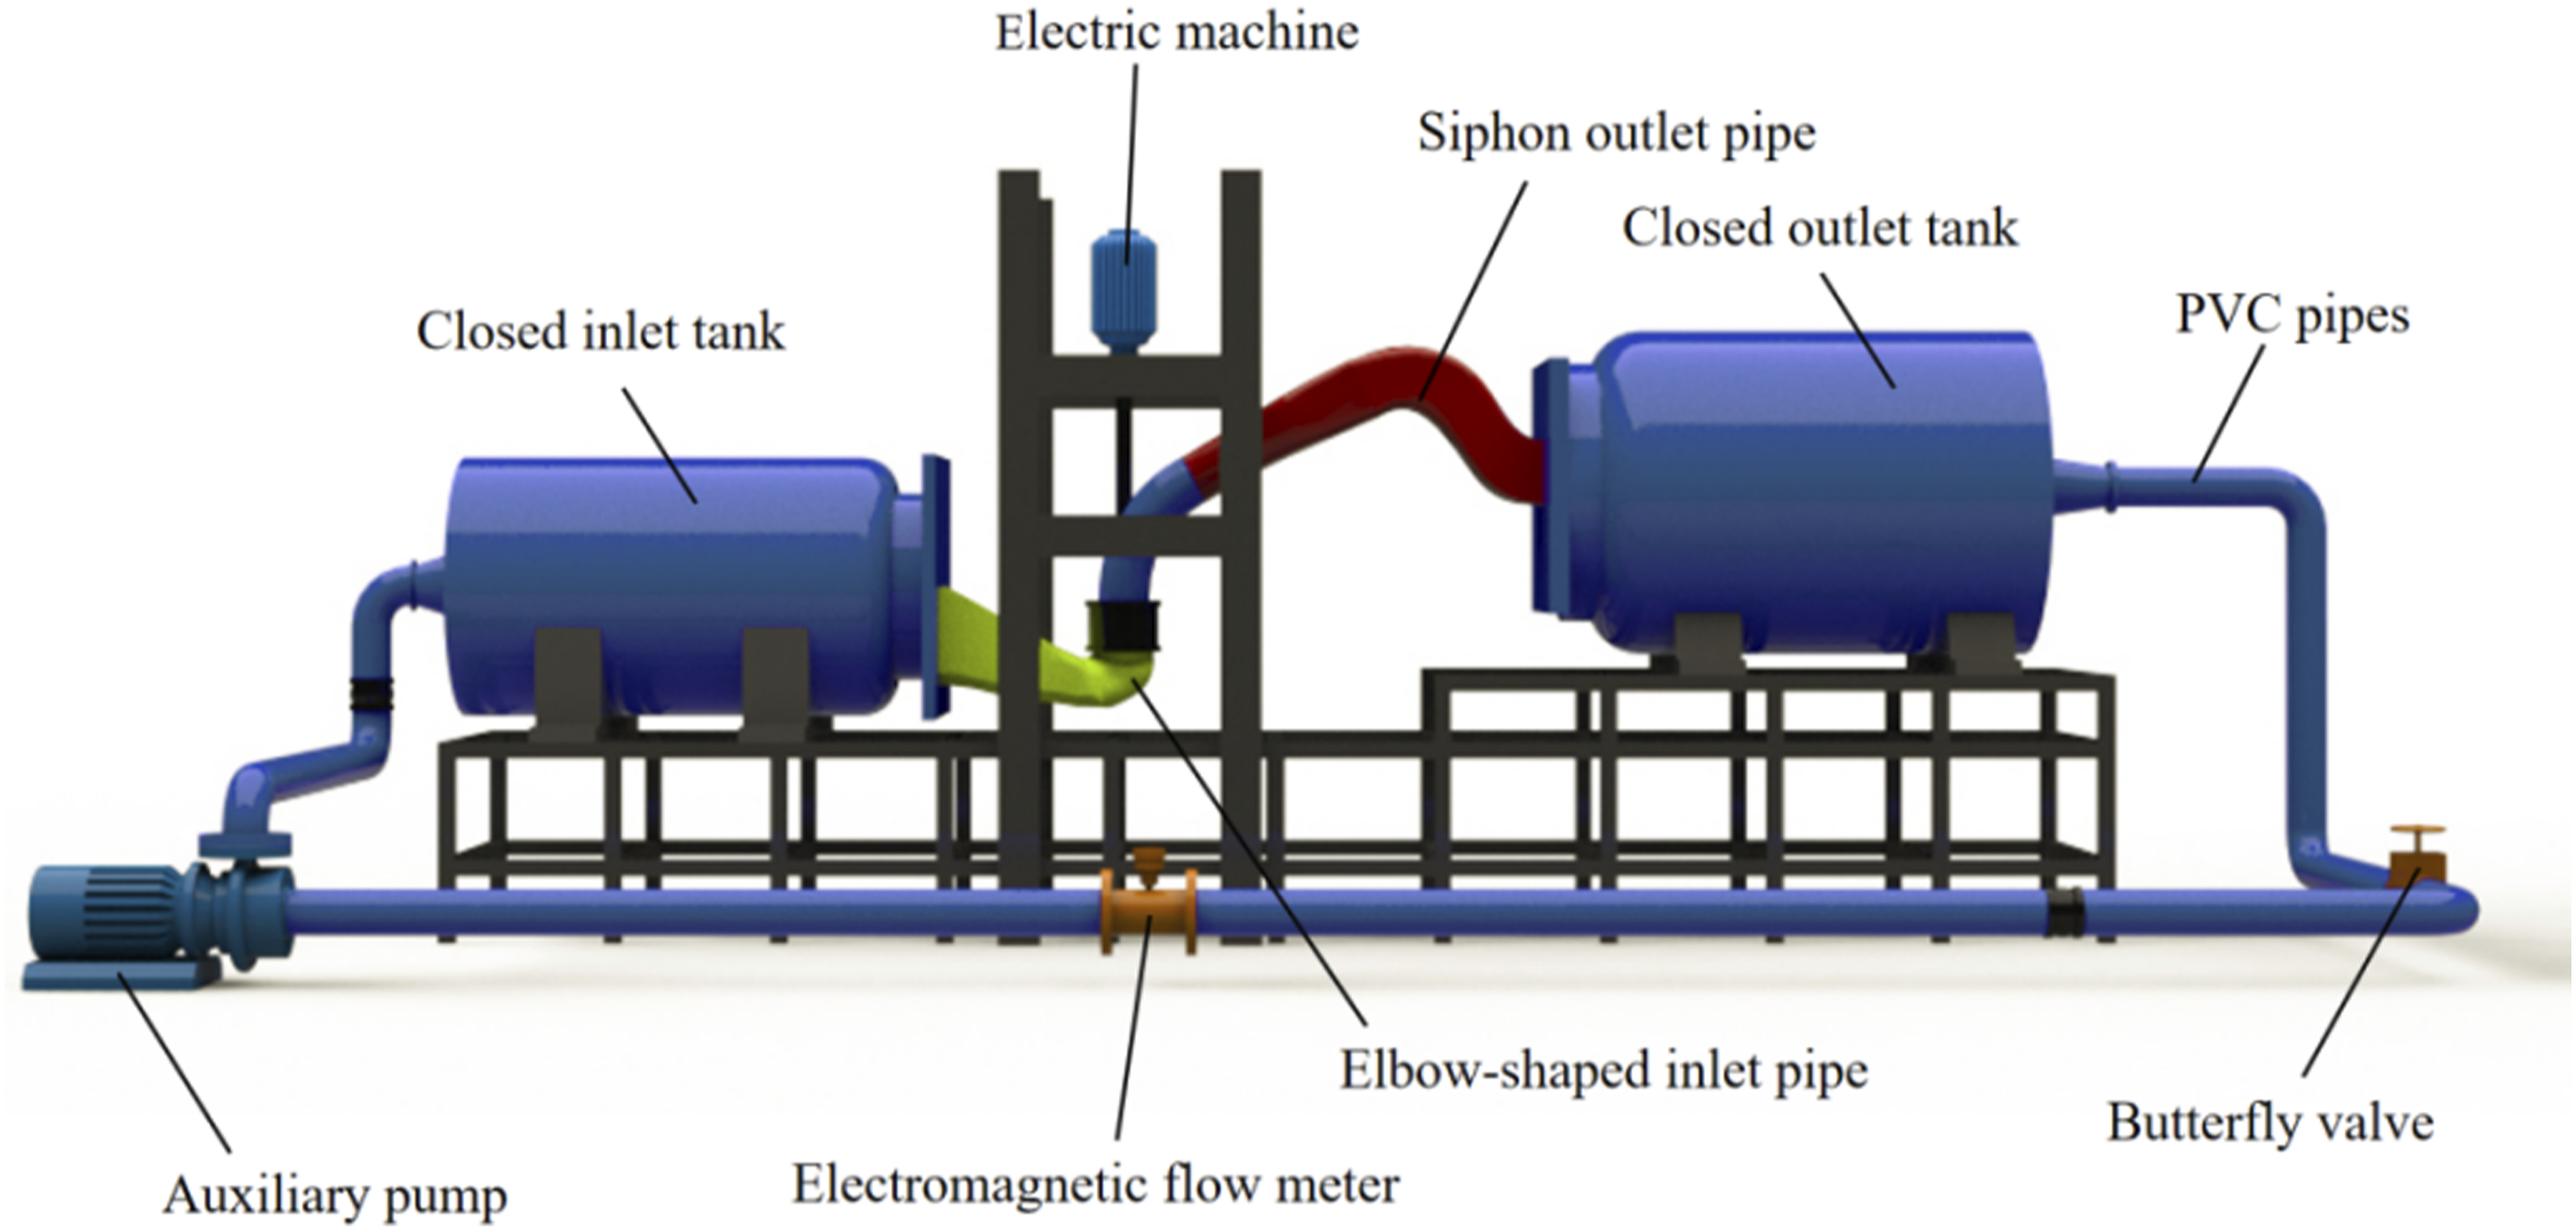
The energy repeatability test of the physical model of the axial flow pump device was conducted at a rotating speed of 2200 r/min to confirm the dependability of the test bench. Under the same test conditions, three energy performance tests were completed. In Figure 7, the results are displayed. Obviously, the flow-head curve of the pump device shows a consistent trend when running at the speed of 2200 r/min in all three tests, and the results of the data under similar working conditions with a flow relative error of less than 5% are very close, indicating that the test bench has good repeatability. Energy performance repeatability test of pump device.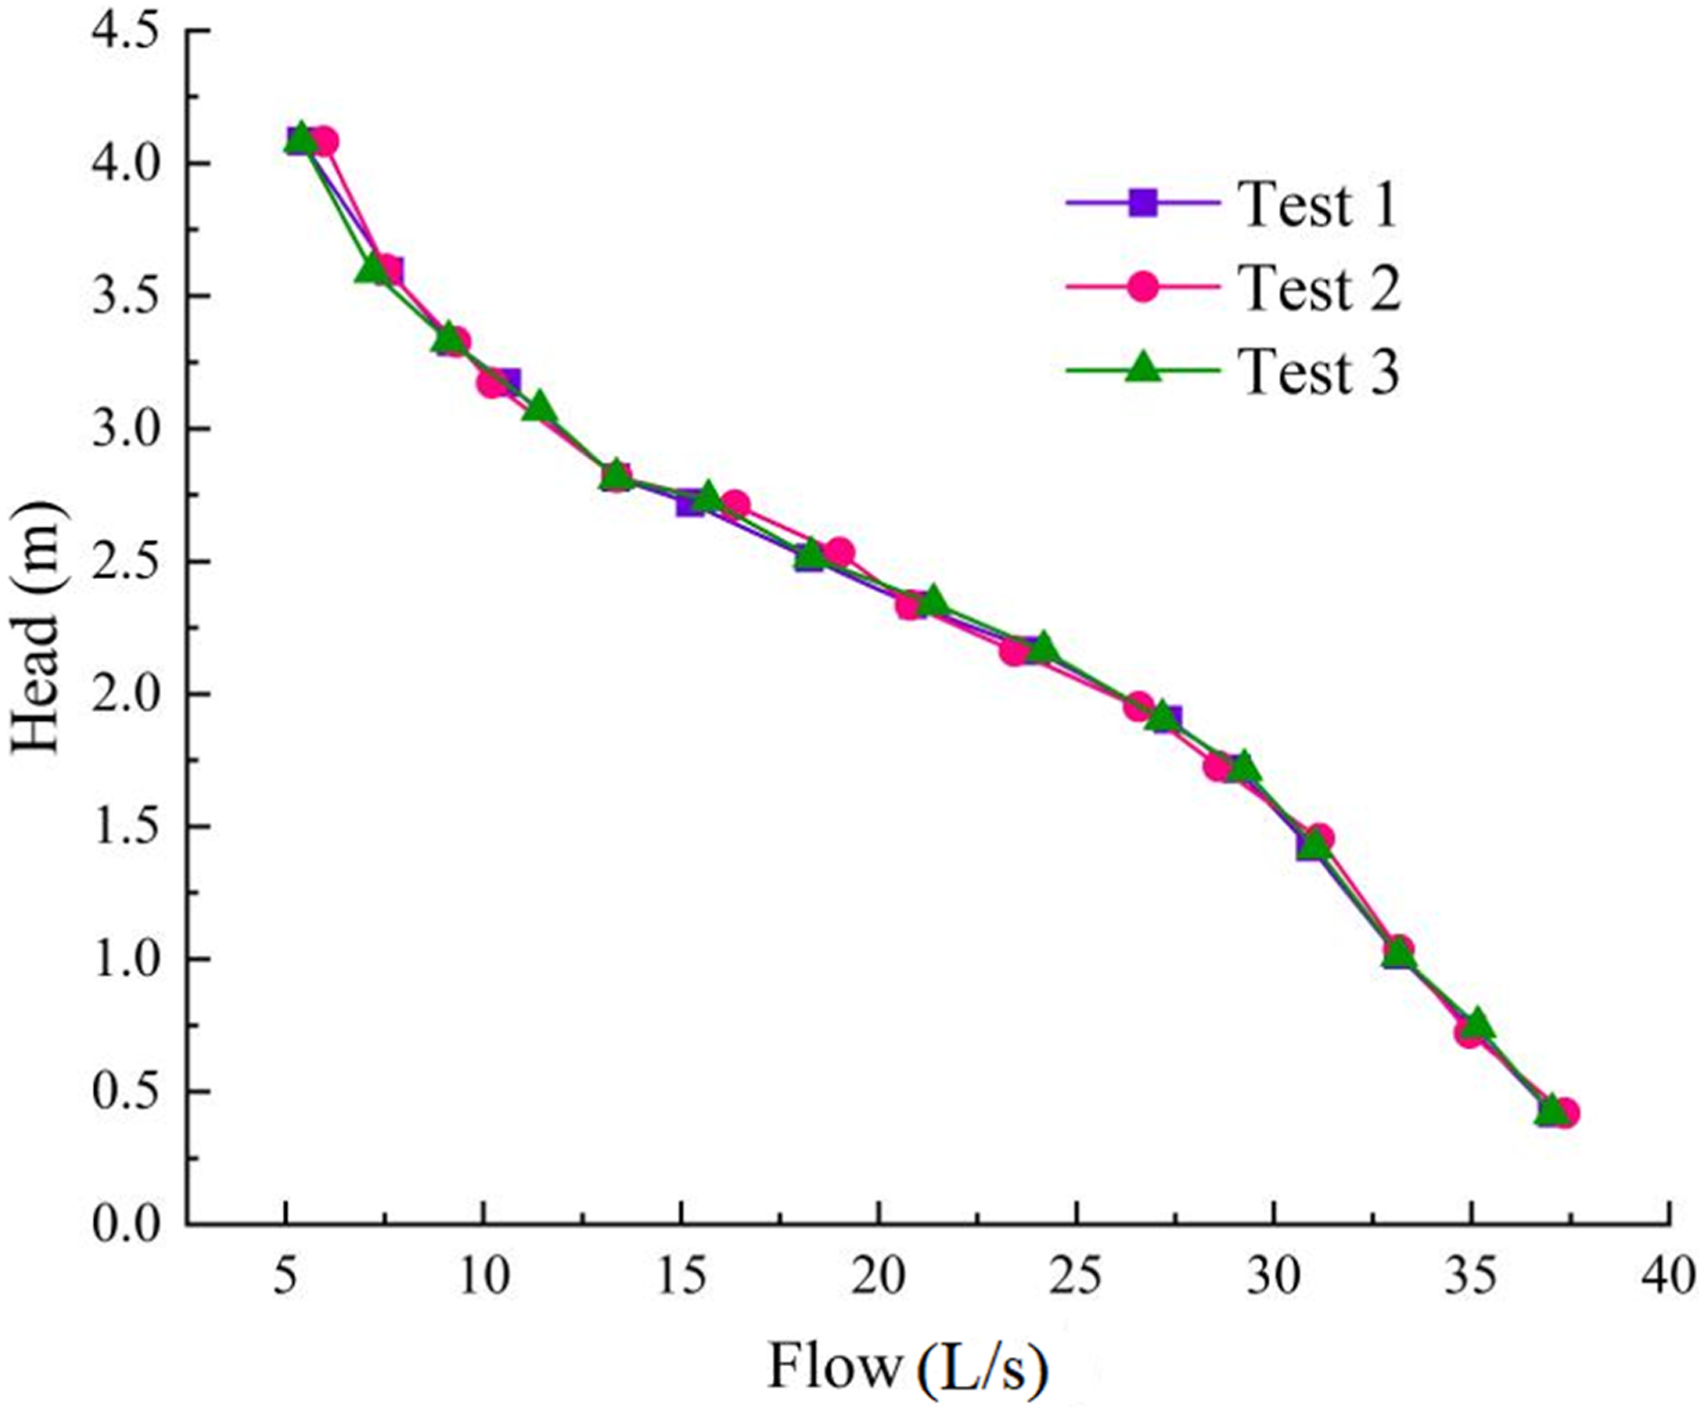
The energy performance repeatability test was passed when the rotation speed was 2200 r/min, and the pump device’s head and efficiency were attained. Figure 8 depicts and compares the curves of Q∼H and Q∼η from numerical simulation and model test. Clearly, the exterior characteristic curve’s trend is essentially the same whether it was derived from numerical simulation or model test. The curve of Q∼H acquired through numerical simulation in the low flow area is a little bit higher than the curve of Q∼H acquired through model test. Because of the intricate flow characteristics in the low flow area, there is a significant difference between the two curve, while the Q∼η curve is different in the high flow area. The the absolute error of efficiency is approximately 1.87% and the head’s relative error is around 2.36% near 1.0Q
bep
. In the range of 0.3Q
bep
∼1.2Q
bep
, both the absolute error of efficiency and the head’s relative error are under 5%, showing that the accuracy of numerical simulation is high.8,28 In summary, it can be observed that the results of numerical simulation and the model test correlate well, and that the numerical calculation results are true and reliable. Comparison of external characteristics between physical model test and numerical simulation of pump device: (a) Efficiency comparison and (b) head comparison.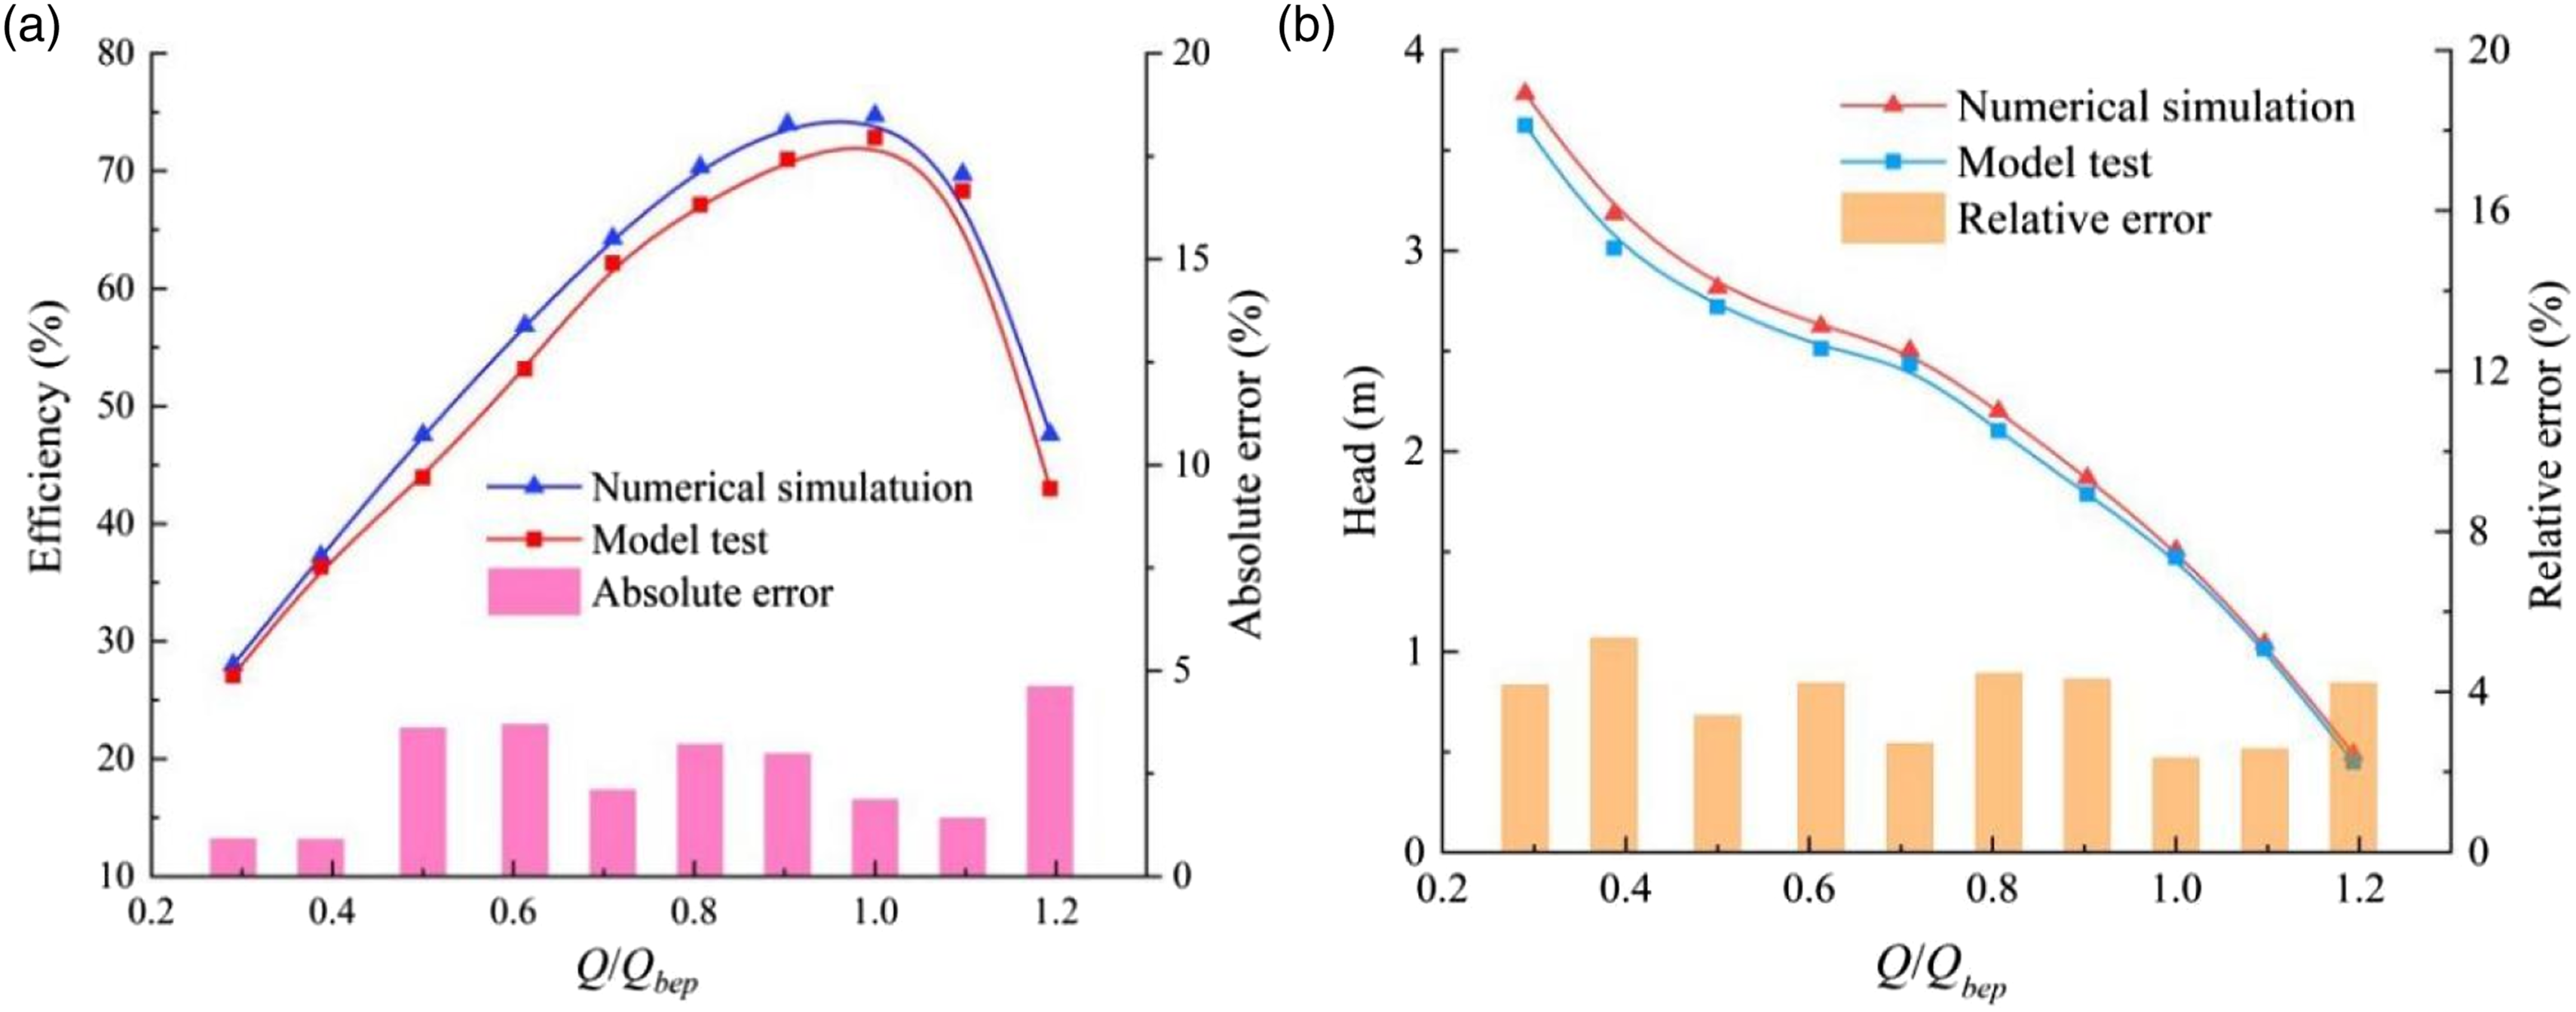
Results analysis and discussion
Analysis of biased flow characteristics of siphon outlet pipe
The distribution of biased flow at the the guiding vane's outlet, the elbow pipe, the siphon outlet pipe’s inlet are significantly different under various flow circumstances. The flow enters the siphon and deflects counterclockwise as a result of the 60° deflection of the flow after entering the elbow pipe and the residual circulation at the guide vane’s outlet. Therefore, an analysis is done of the flow characteristics of some zones in the outlet conduit, and three different sections are selected inside the outlet pipe by using the method of partition flow monitoring, as shown in Figure 9. The first section is the surface of the elbow pipe’s inlet, which is split into four zones: The upper-left part is called A; The upper-right part is called B; The lower-right part is called C; The lower-left part is called D. The surface of the ascending segment’s entrance of the outlet pipe, which is separated into four sections, is where the second section is chosen:The upper-left part is called E; The upper-right part is called F; The lower-right part is called G; The lower-left part is called H. I, J, K and L are the four zones of the top section of the hump segment and they are arranged in the same order as the partitions of the two sections above. Unsteady flow monitoring is carried out in four zones of each of three sections, and the monitoring time is T. Diagram of flow monitoring sections of outlet pipe.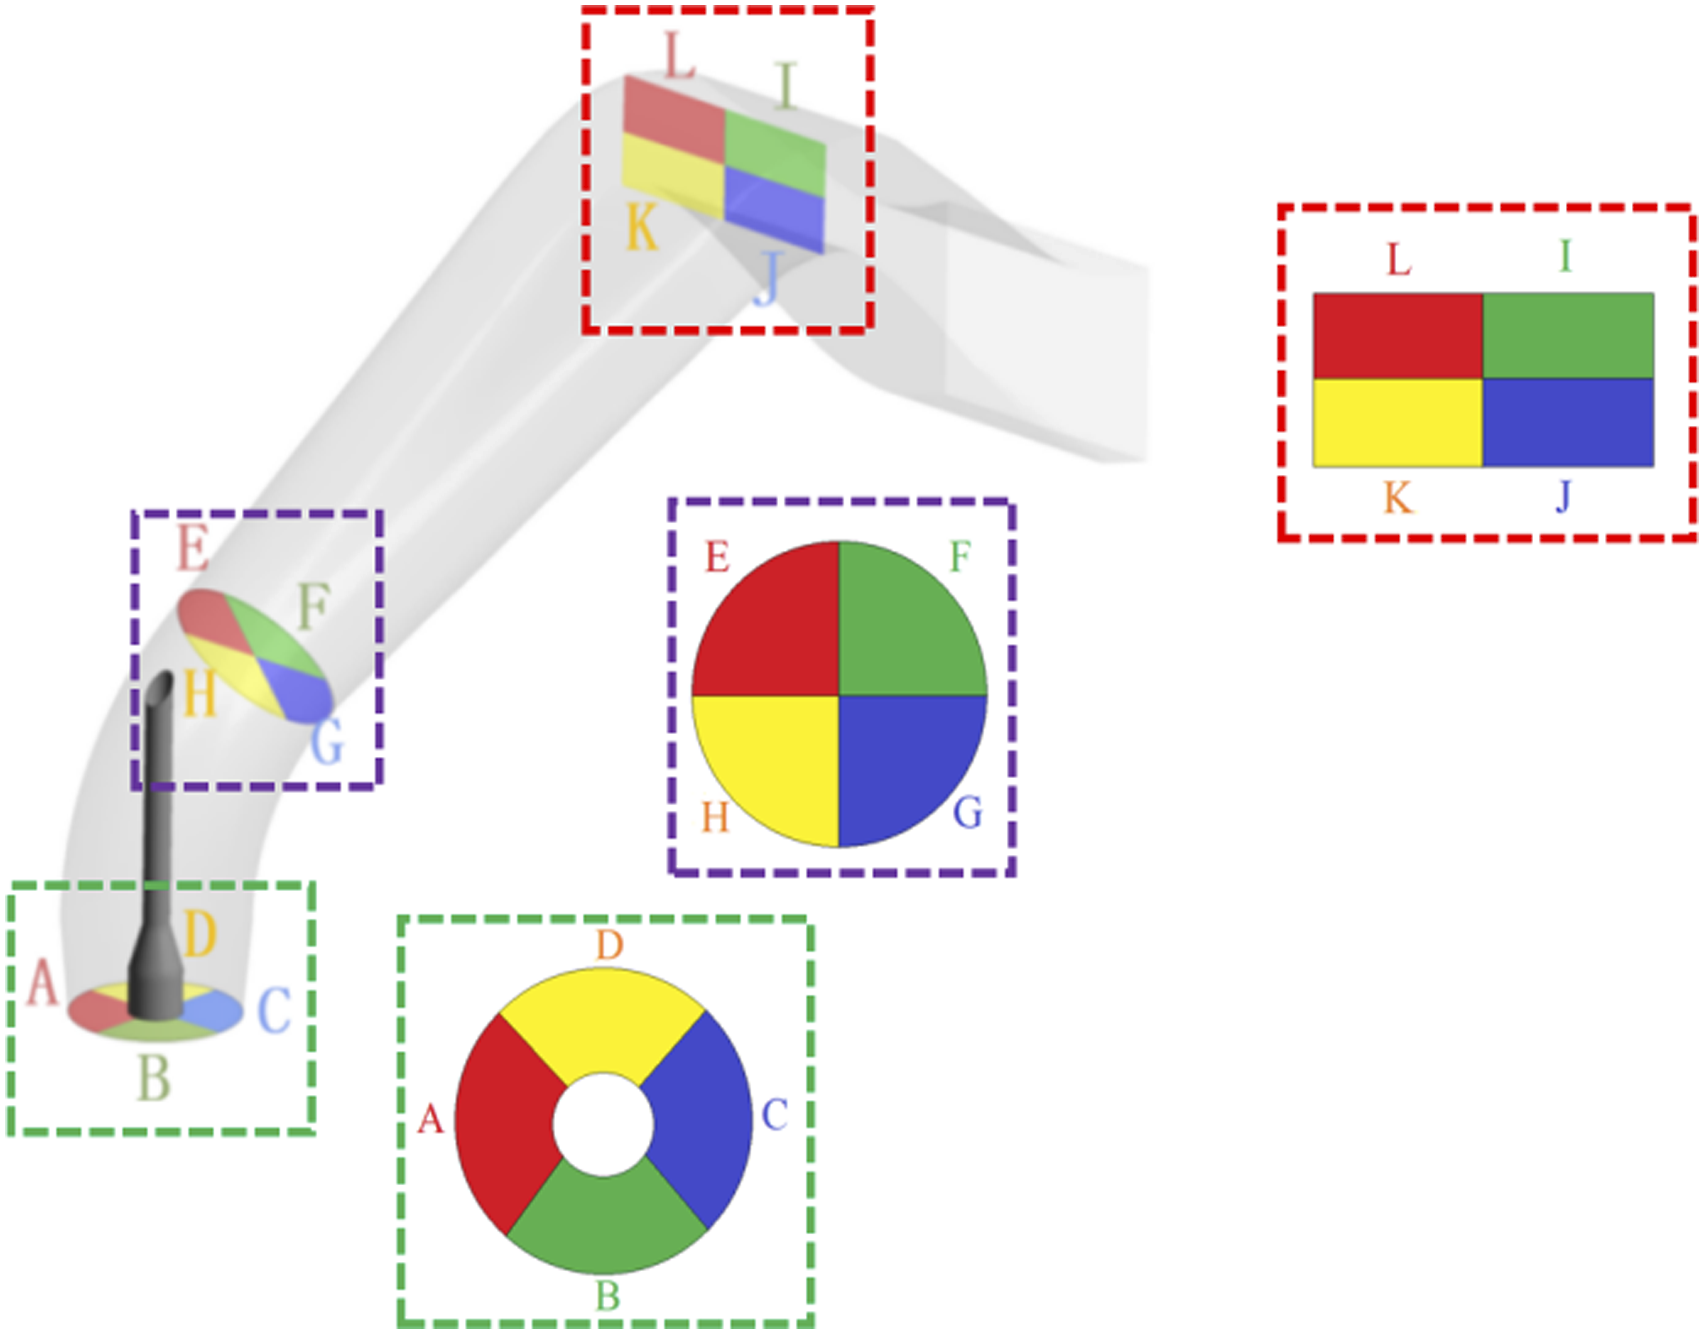
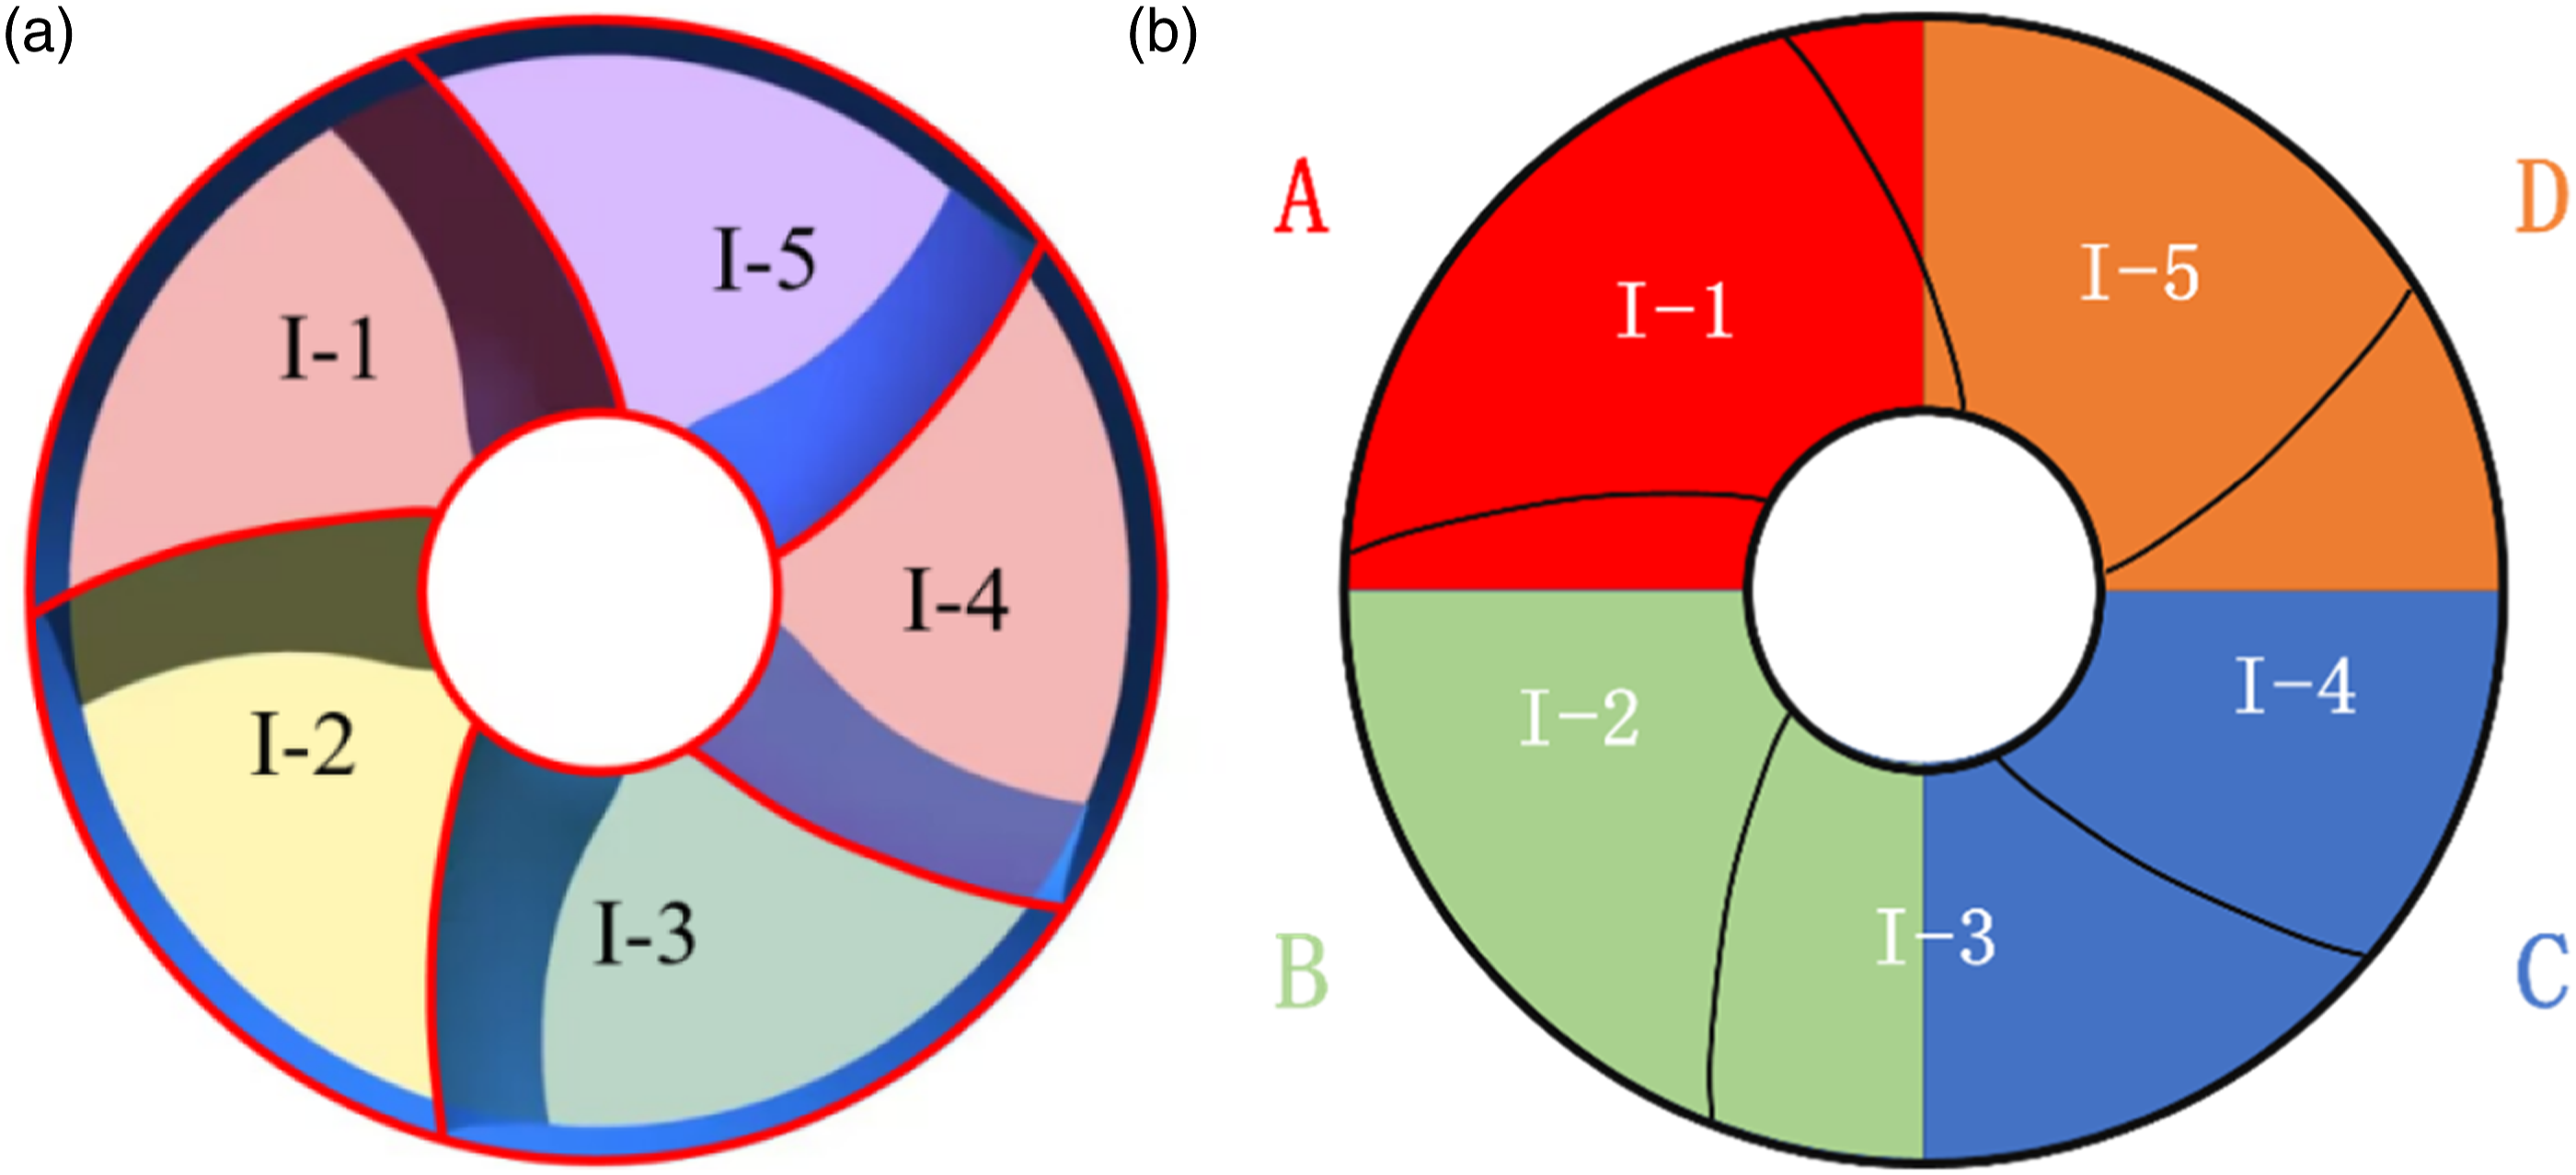
As shown in Figure 10, there are five blade zones in the guide vane, which are I−1∼I−5, respectively. They correspond to the four zones A, B, C and D defined by the first section mentioned above. Areas can be used to describe their relationship: Partition diagram of outlet section of guide vane and inlet section of outlet pipe: (a) Zone map of outlet section of guide vane and (b) correspondence between the outlet section of guide vane and the inlet section of pipe.


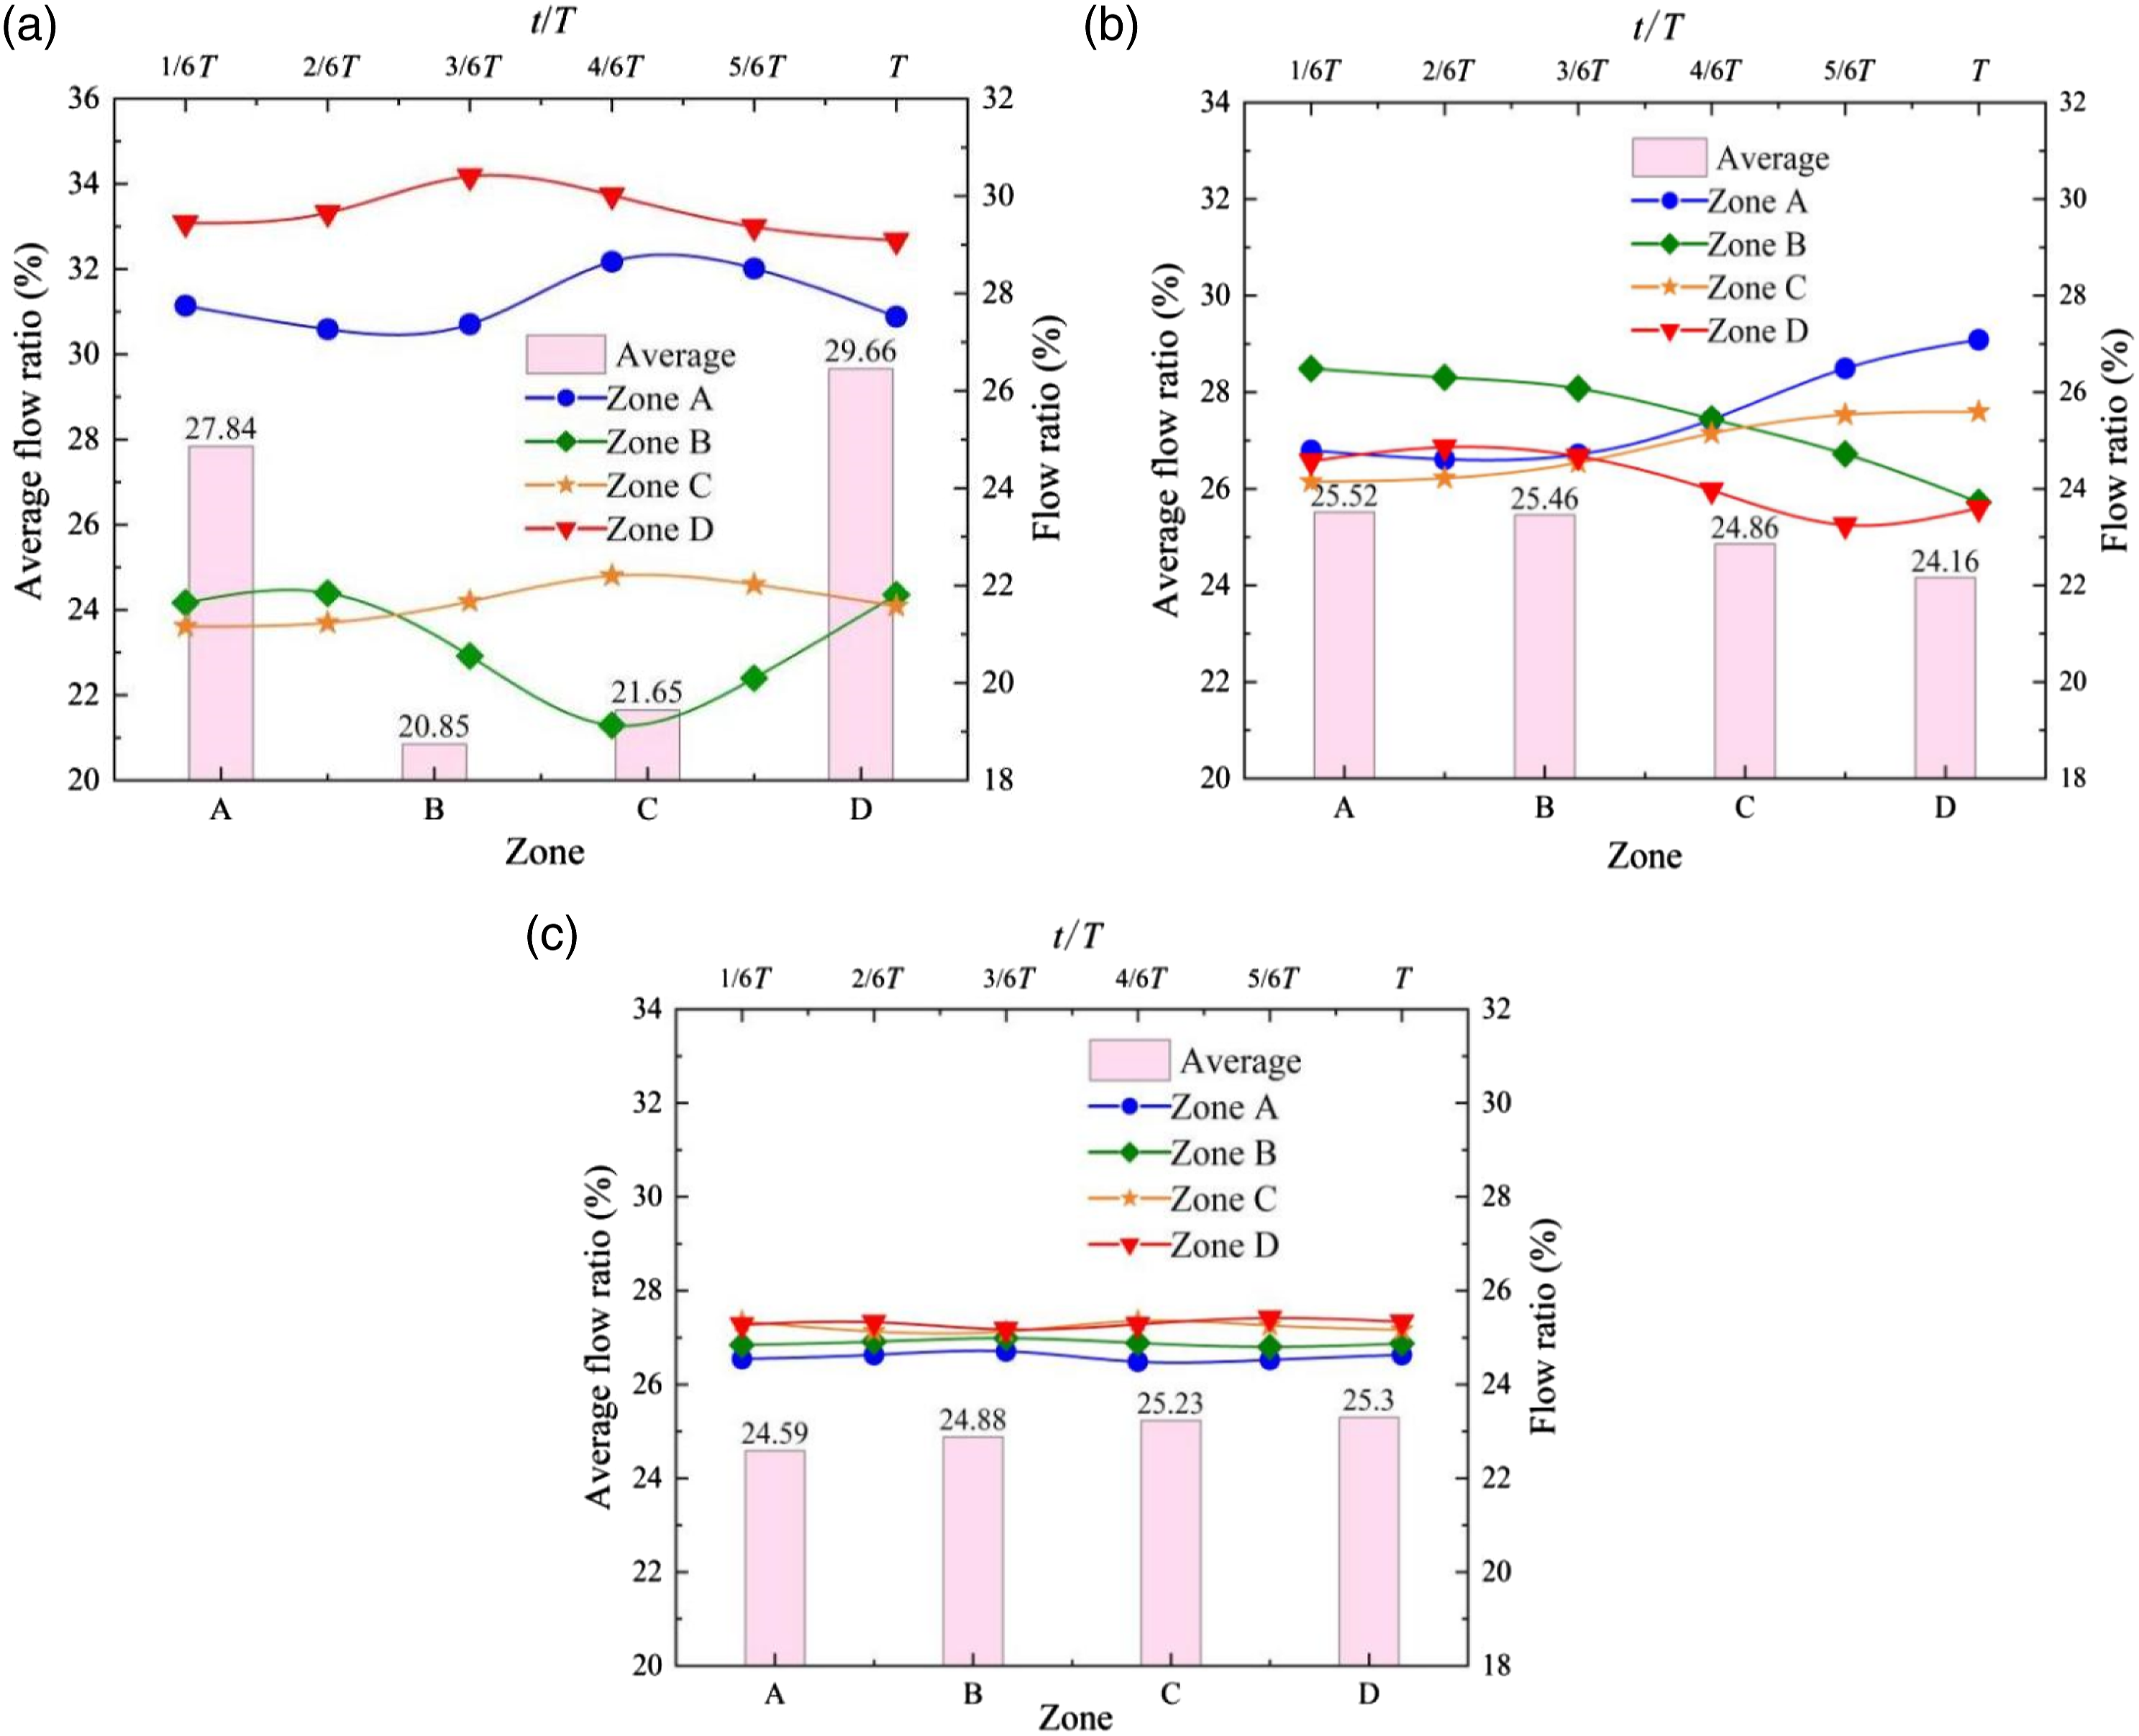
The proportional curve of the flow rates in each zone to the overall flow rates at various moments under various flow conditions is illustrated in Figure 11 at the guide vane’s outlet. The distribution of the curve becomes denser with flow rate increasing, indicating that the flow is distributed more uniformly throughout the four zones and that the conditions of biased flow have improved. Under 0.3Q
bep
, there is an obvious phenomenon of biased flow in the A and D regions, that is, the flow deviates to the left side of the elbow pipe, and the flow accounts for more than 27.2% and 29.0% of the total flow, respectively. The flow on the right side is only about 21%. Under 1.0Q
bep
, however, the degree of biased flow in the elbow pipe’s inlet section declines and the distribution becomes more uniform. Under 1.2Q
bep
, it is found that there is no obvious phenomenon of biased flow, and the flow ratio of four zones is within the range of 25% ± 1%. Under three conditions, the ratios of biased flow of the left and right of the conduit is 1.353, 1.013, 1.005, decreasing in turn. Proportion change of flow rate of each zone to total flow rate at different moments under different conditions of the outlet of guide vane: (a) 0.3Q
bep
, (b) 1.0Q
bep
and (c) 1.2Q
bep
.
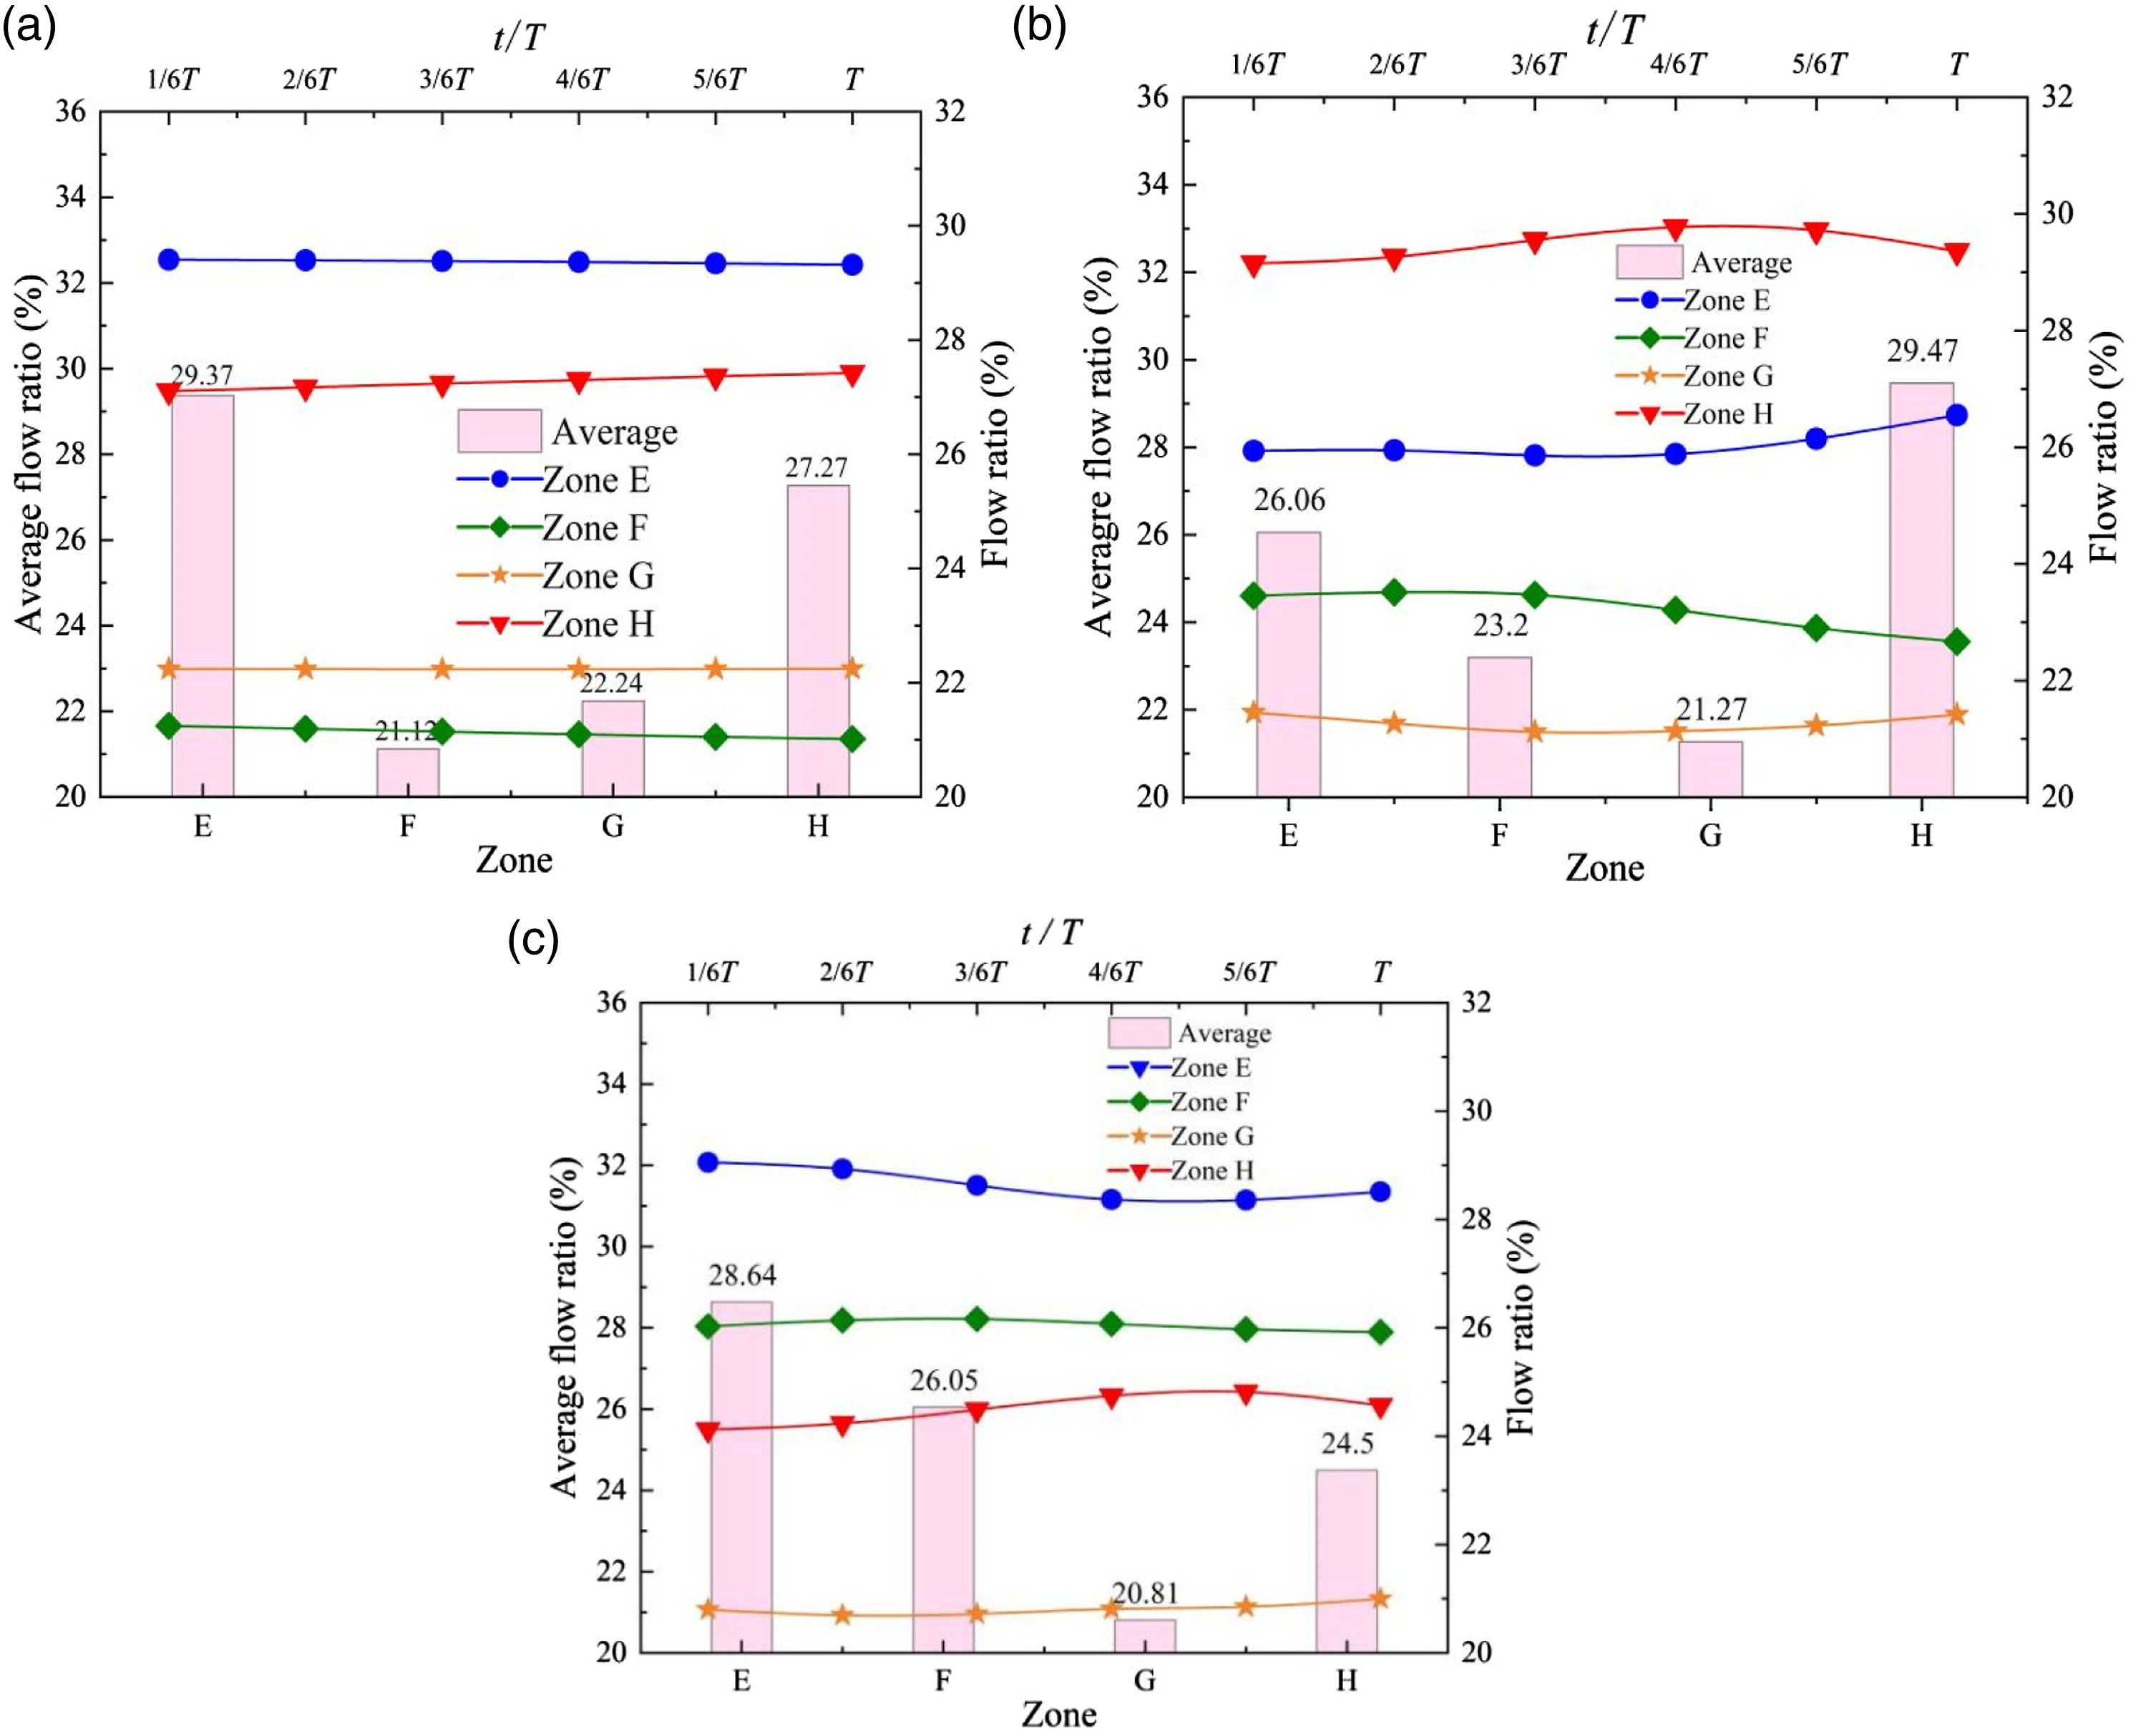
The proportional curve of the flow rates in each zone to the overall flow rates at various moments under various flow conditions is illustrated in Figure 12 at the ascending segment’s entrance. The results show that the distribution of flow is more unbalanced than at the guide vane’s outlet, indicating that the phenomenon of biased flow has intensified, however, the degree of biased flow is still gradually slowing down with the rise of flow rate. Under 0.3Q
bep
, there is obvious phenomenon of biased flow in zone E and H, that is, the water flows to the left side, especially to zone E, and the flow rate accounts for more than 29.3% and 27.2%, respectively. The flow is still biases to the left under 1.0Q
bep
, but the zone of maximum flow ratio changes from E to H, and the flow ratio is about 29.5%, indicating that the water flows from the zone E to zone H, and gradually deflects to the lower side of the elbow pipe. The flow rate of zone E accounts for the largest under 1.2Q
bep
, which is about 28.6%, indicating that the flow is diverted to zone E again. Under three conditions, the ratios of biased flow on the pipe’s left and right sides are 1.306, 1.249, and 1.134, still decreasing in turn. Proportion change of flow rate of each zone to total flow rate at different moments under different conditions at the entrance of the ascending segment: (a) 0.3Q
bep
, (b) 1.0Q
bep
and (c) 1.2Q
bep
.
The internal steamlines of the elbow pipe under 1.0Q
bep
is shown in Figure 13. The analysis shows that the flow is affected by the 60° deflection of the elbow pipe, and the flow in the elbow pipe deflects counterclockwise because the guide vane’s outlet still exists a significant circulation. Under the combined action of inertia of the flow and centrifugal force, most of the water flows to the left zone E and H of the siphon outlet pipe in the ascending segment. The streamline distribution of each zone in the elbow pipe of the outlet pipe: (a) Zone A, (b) zone B, (c) zone C and (d) zone (d)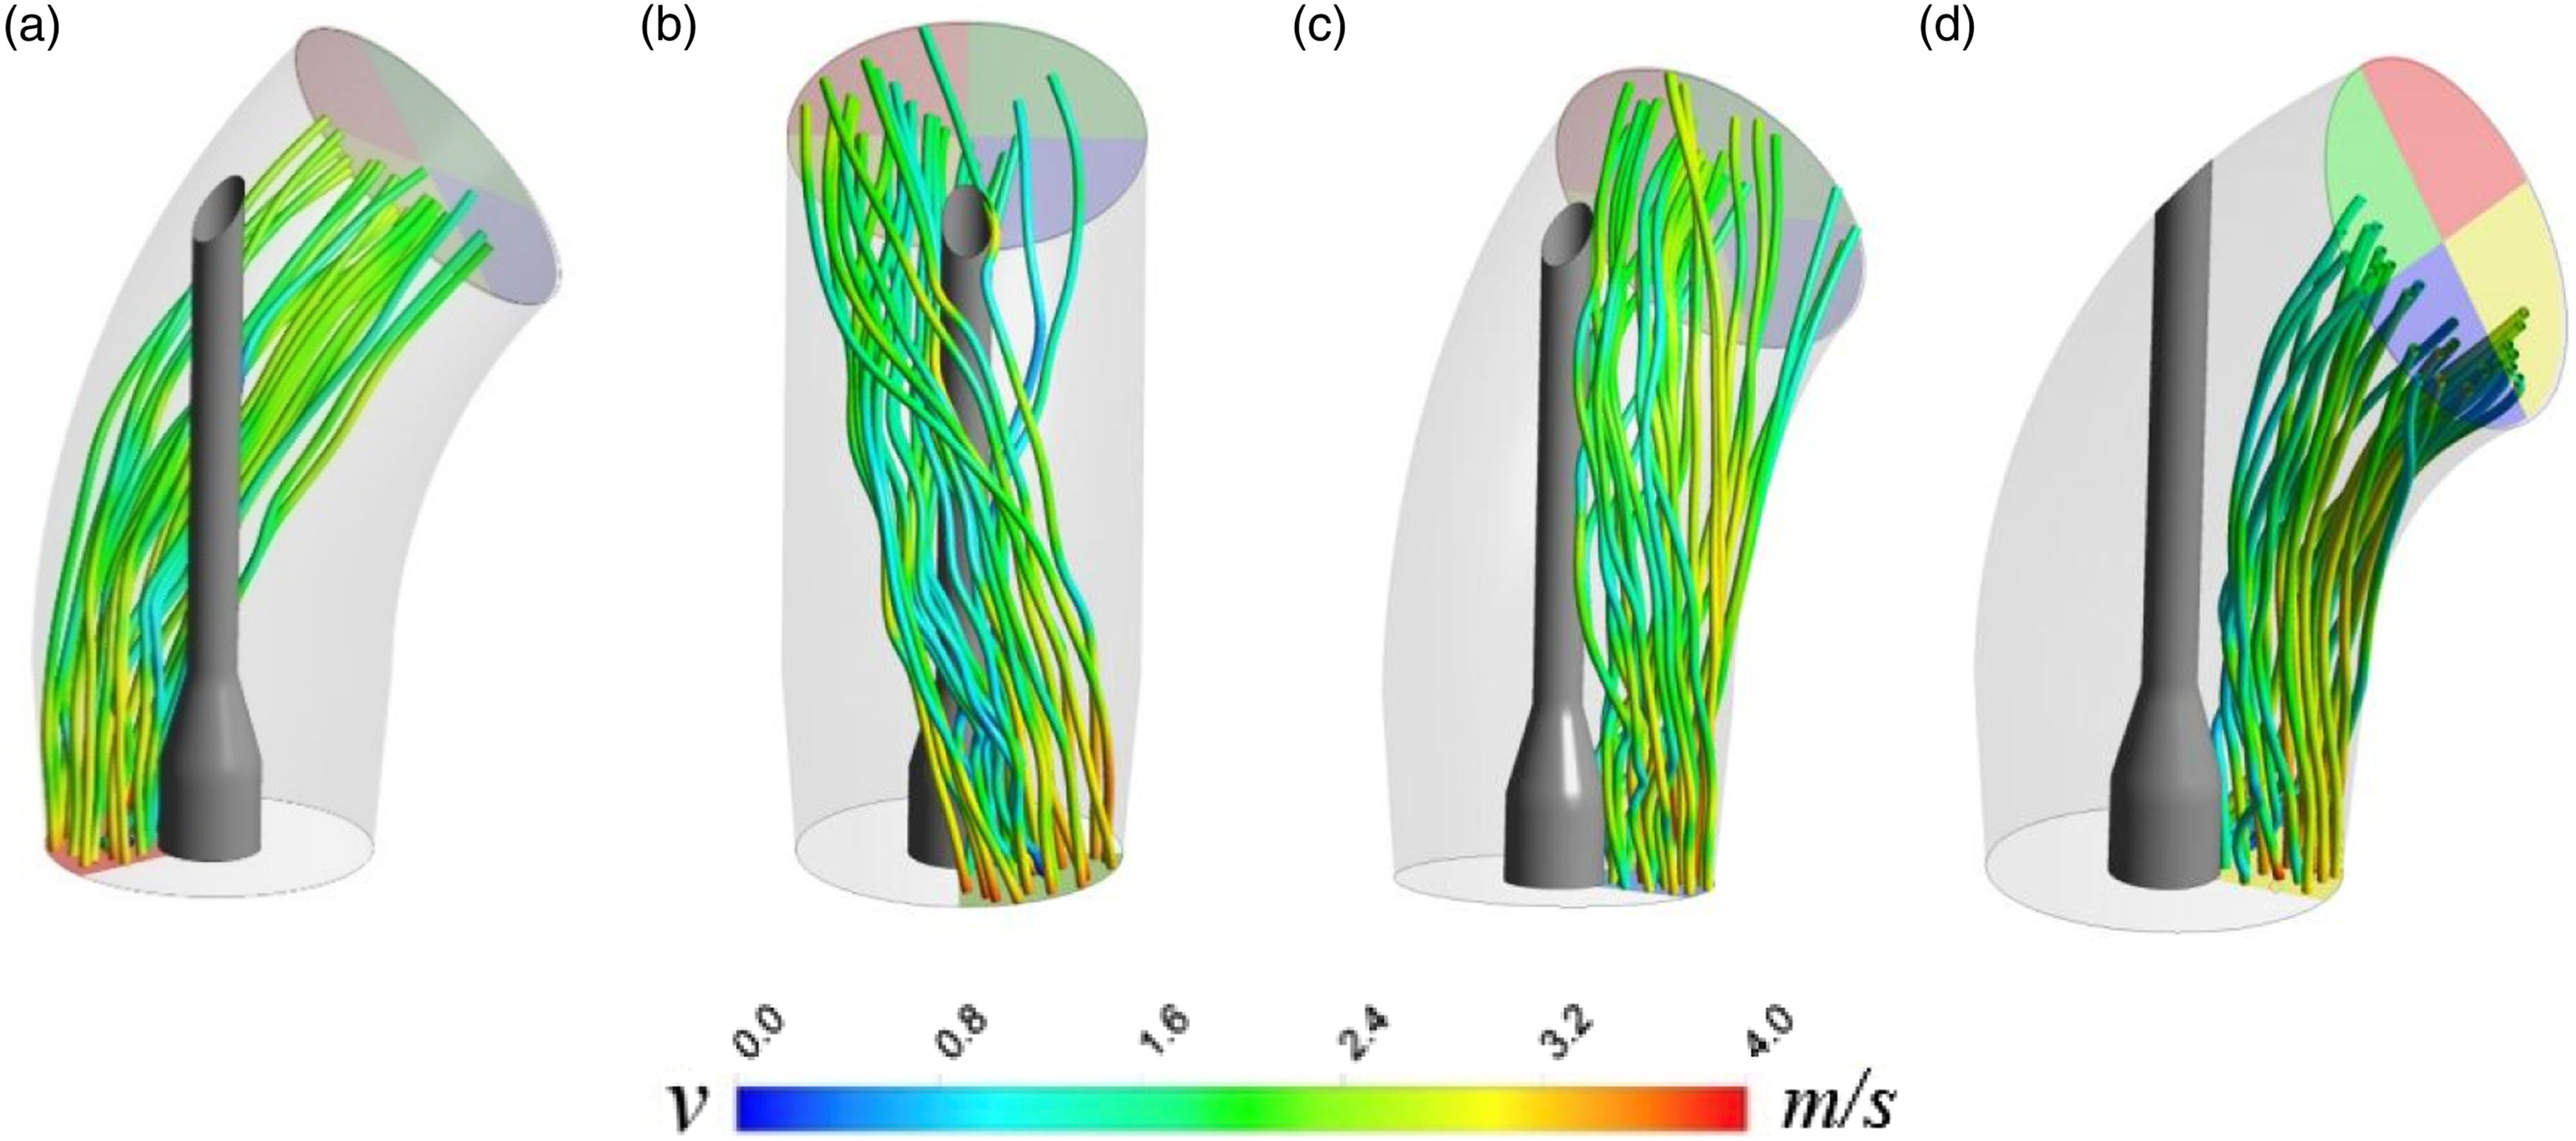
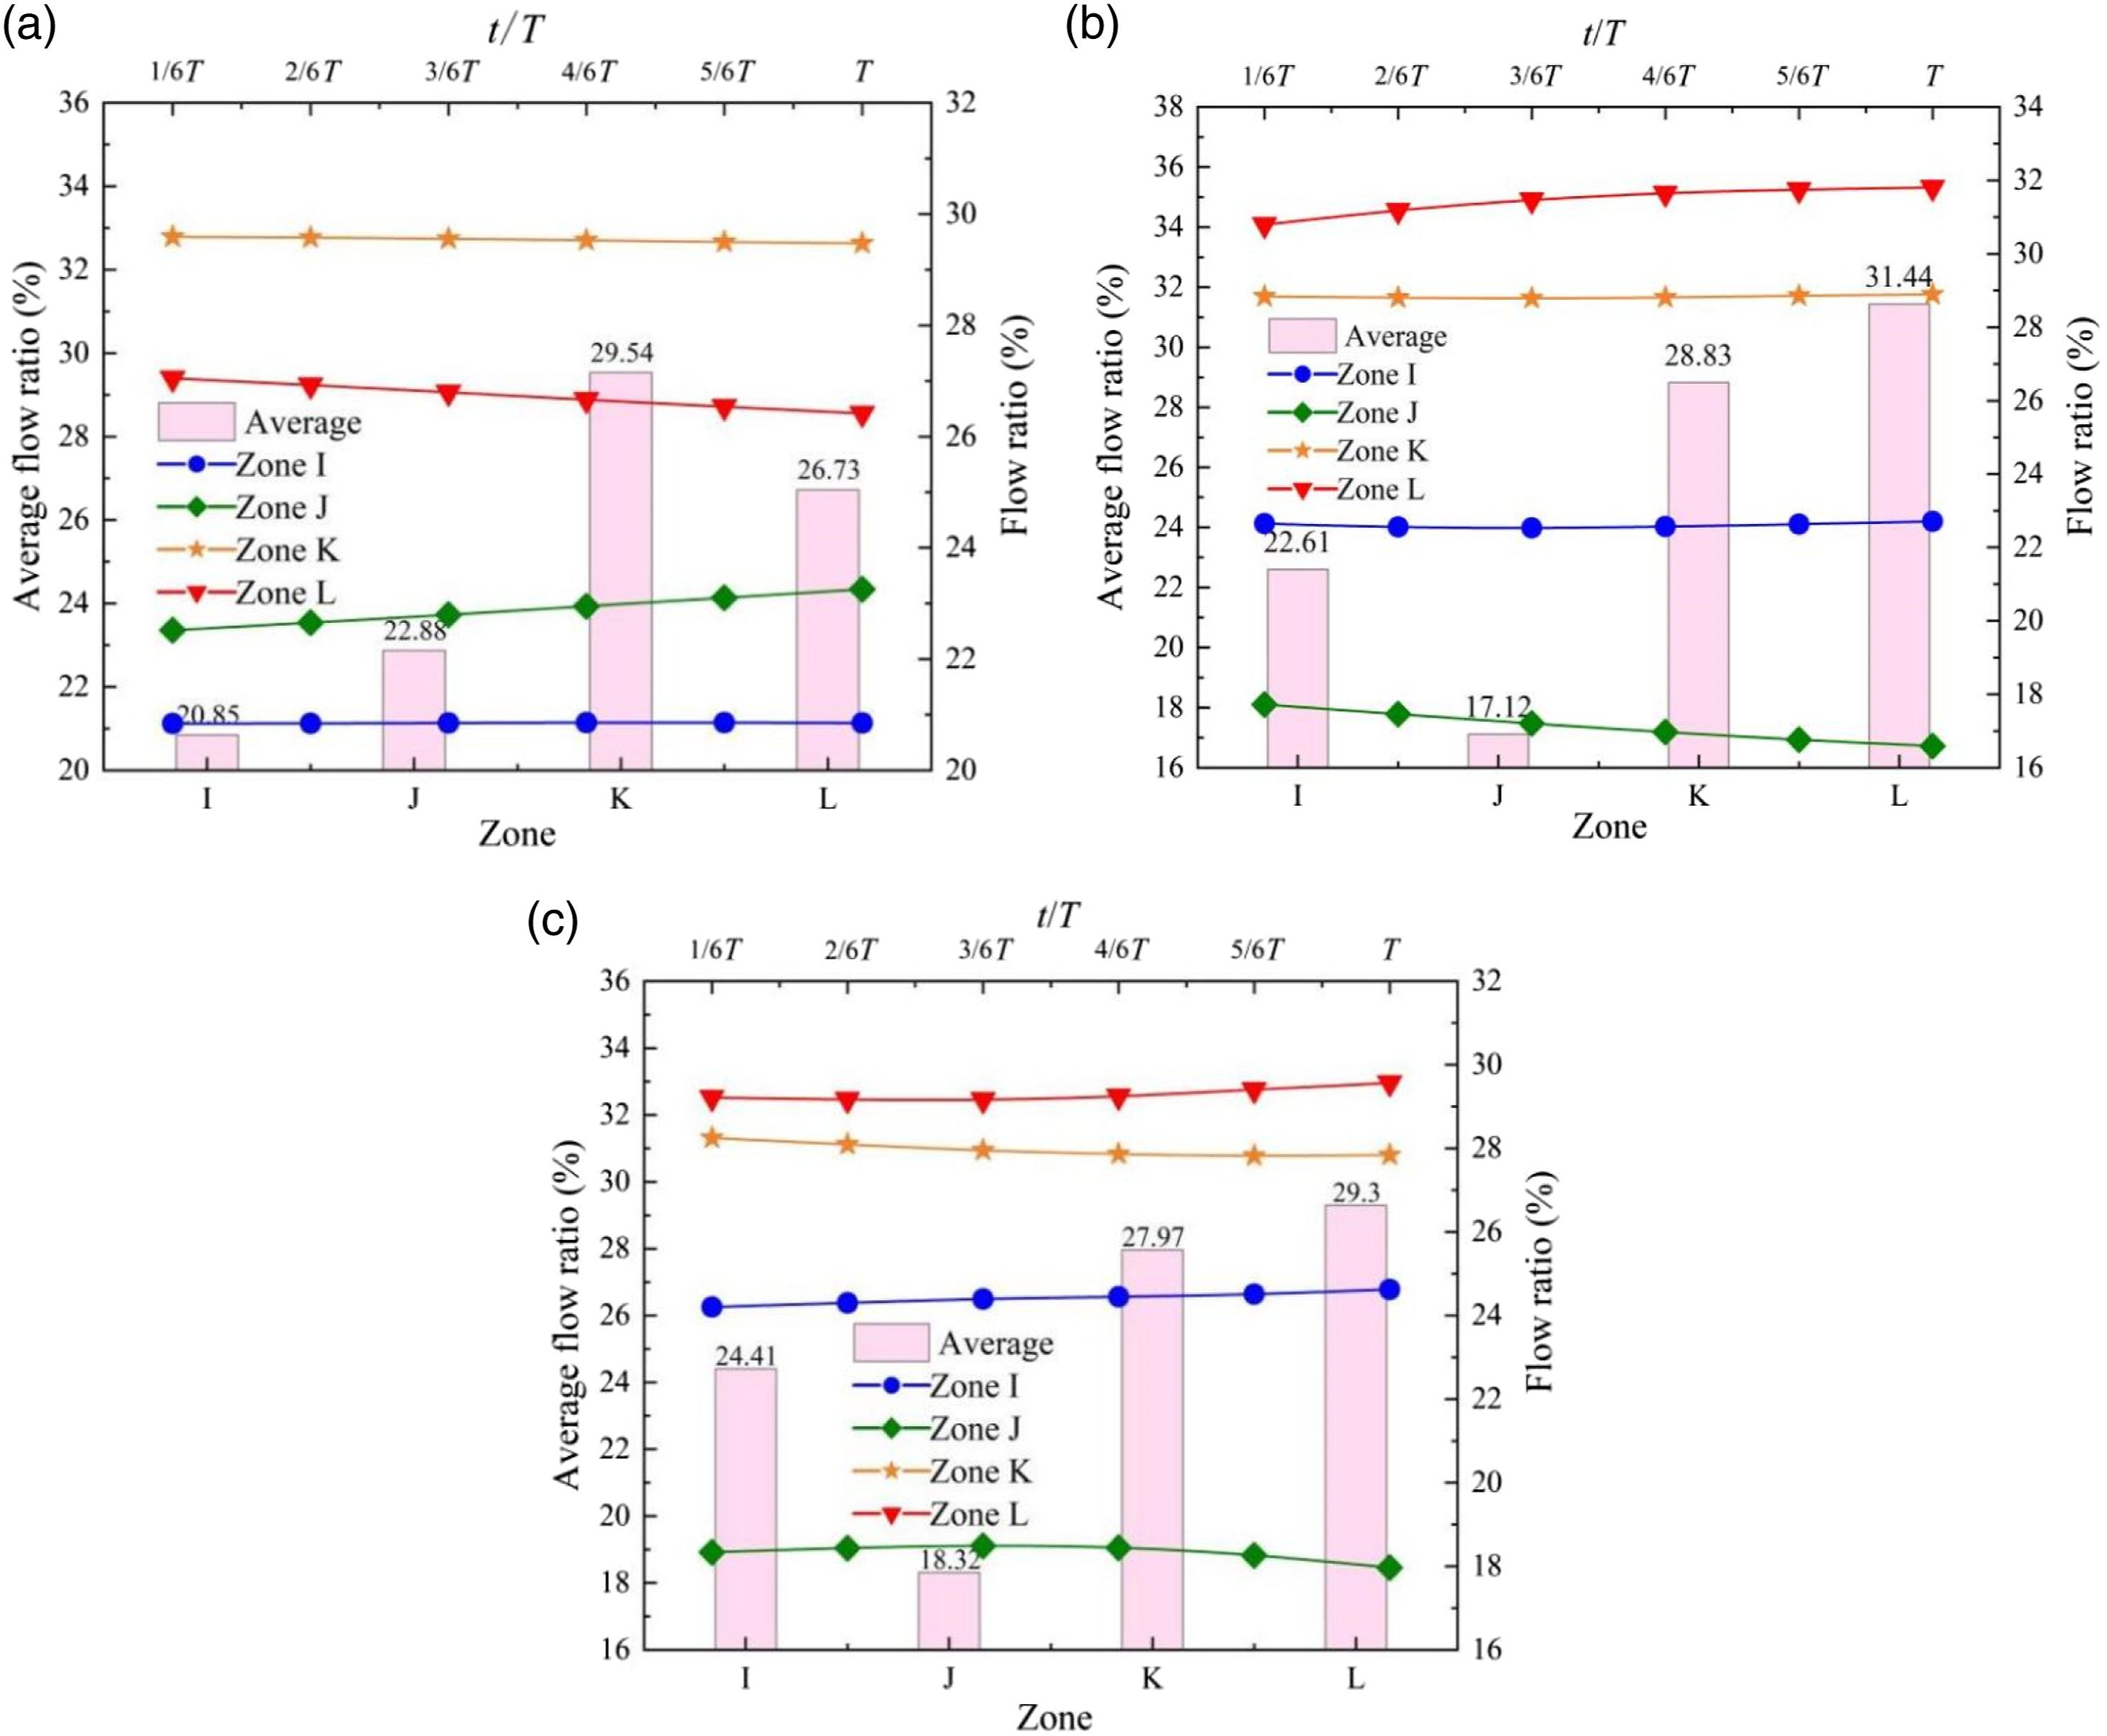
The proportional curve of the flow rates in each zone to the overall flow rates at various moments and under various flow conditions is illustrated in Figure 14 at the hump segment’s top section. The distribution of flow in four zones do not show a uniform trend as the flow rate rises, and the flow generally drifted to the zone K and L, which diverts to the sublayer of the pipe. Under 0.3Q
bep
, a significant proportion of the flow occurs in zones K and L, which is especially biased towards zone K, accounting for about 29.5% and 26.7% respectively. Under 1.0Q
bep
, the zone of the maximum flow ratio changes from K to L, and the flow ratio exceeds 30%, indicating that the flow switches to the lower-left part from the lower-right part. Under 1.2Q
bep
, the flow ratios in four zones is balanced, and the flow ratios in zone K and L is still large, which is higher than 27% and 29% respectively, and the flow is still biased to the lower-left part. The ratios of biased flow above and below the pipe are 0.78, 0.66 and 0.75 respectively, showing a trend of initially dropping and then rising. Proportion change of flow rate of each zone to total flow rate at different moments under different conditions at the top section of the hump segment: (a) 0.3Q
bep
, (b) 1.0Q
bep
and (c) 1.2Q
bep
.
Analysis of vortex intensity and vortex structure in siphon outlet pipe
The dimensionless circulation Γ* is introduced to quantitatively analyze the intensity of the spiral vortex under various flow conditions inside the siphon outlet pipe. The expression is: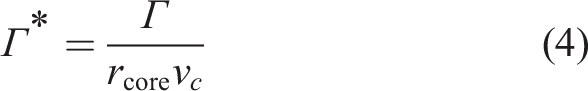
The following is the equation for the vortex core's pressure coefficient: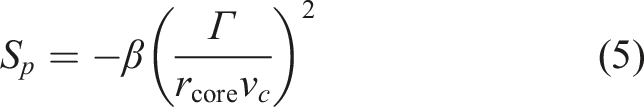
From equations (4) and (5), the relation between dimensionless circulation Γ
*
and pressure coefficient of vortex core S
p
can be obtained: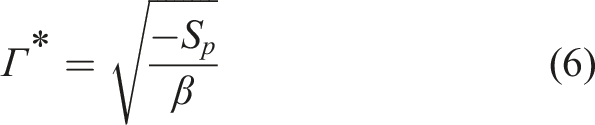
Figure 15 demonstrates the calculation results of dimensionless circulation Γ
*
at various moments under various flow conditions. It can be seen that when the flow rate rises, the spiral vortex structure gradually weakens as the dimensionless circulation of the siphon outlet pipe gradually decreases. This mainly because under high flow conditions, the guide vane’s effective recovery effect on water circulation causes a drop in the pressure coefficient of the vortex core, which corresponds to the results of biased flow. The dimensionless circulation is shown to be the largest under the 0.3Q
bep
in Figure 15, and its value is 39.04, which is related to the unstable flow such as backflow under 0.3Q
bep
. The time-averaged value of dimensionless circulation is stable around 15.0∼15.5 under 1.0 Q
bep
and 1.2 Q
bep
, indicating that there exists less spiral vortex structure, the flow is therefore uniformly distributed and the degree of biased flow weakened. Strength of spiral vortex in siphon outlet pipe: (a) dimensionless circulation at different moments and (b) time-averaged values of dimensionless circulation under different flow conditions.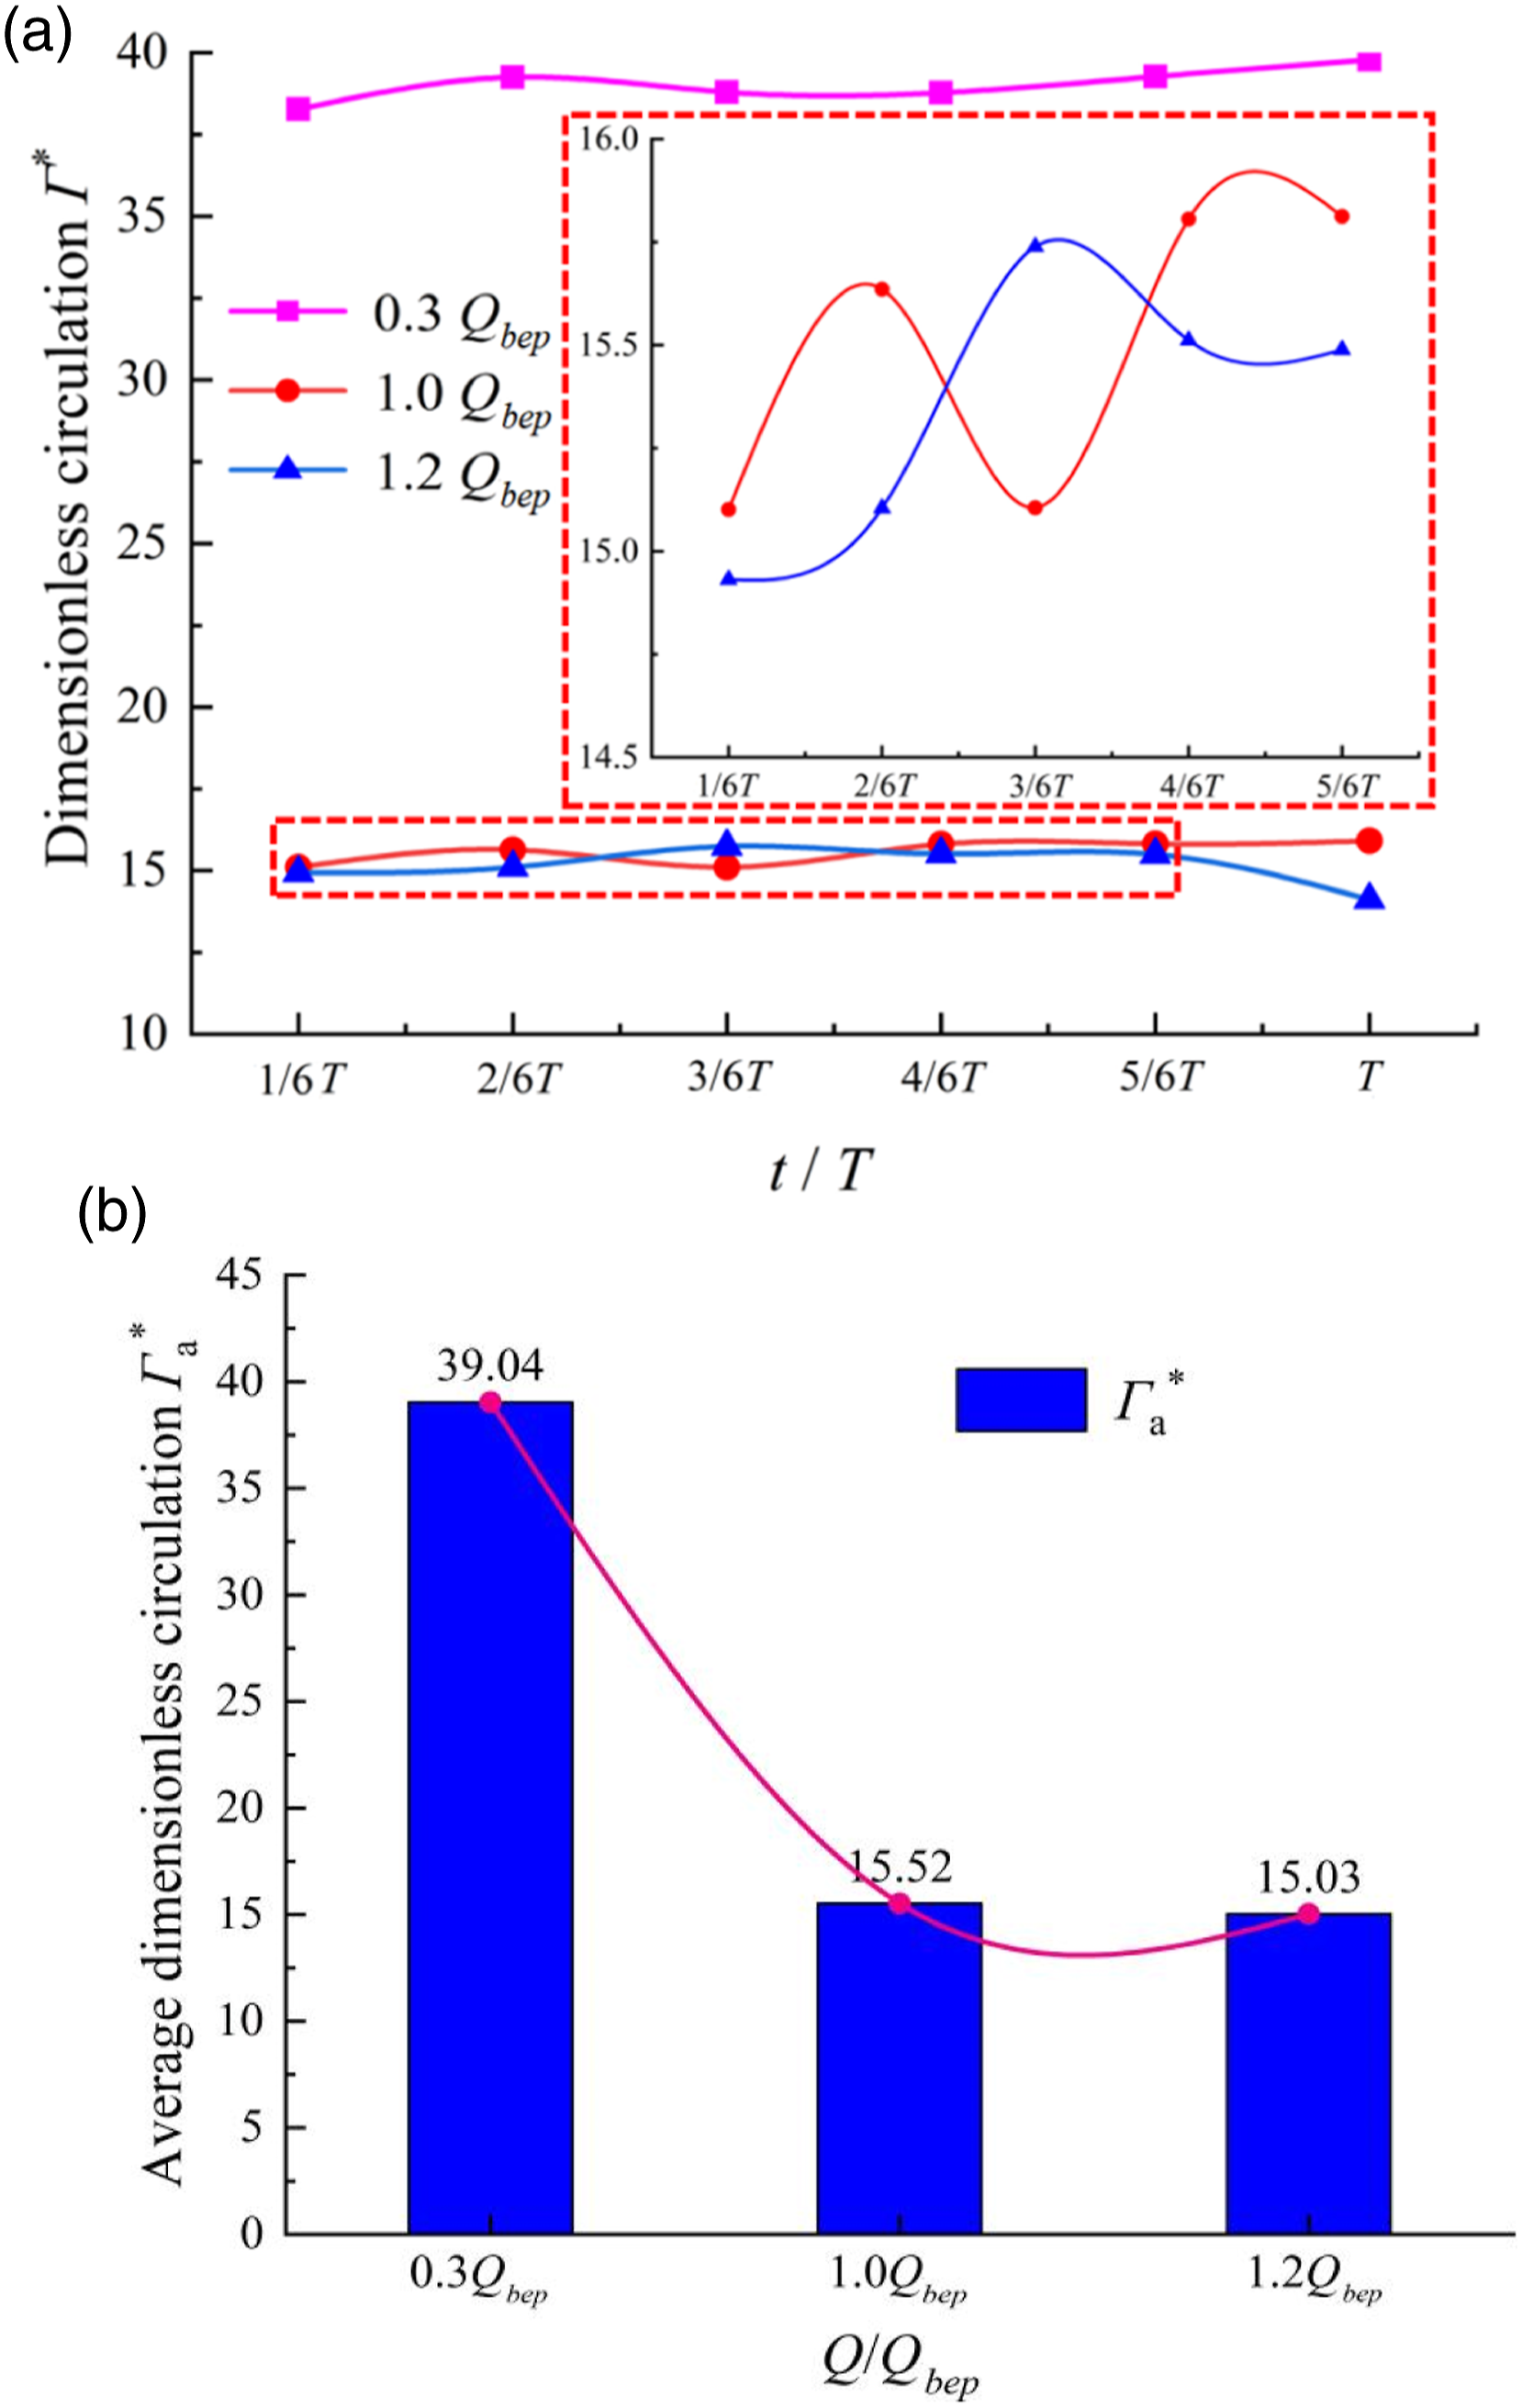
The vortex structure is analyzed using Ω criterion, which is introduced by Liu et al.
29
When compared to the traditional approach of identifying vortex structures, the physical meaning of Ω criterion is quite explicit. In many cases, the threshold Ω does not need to be adjusted too much. Usually, using the value of 0.52∼0.90 can find most vortex core structures, the ability to capture weak vortices is strong, and the recognition result is not sensitive to the threshold.
30
The definition of threshold Ω is:

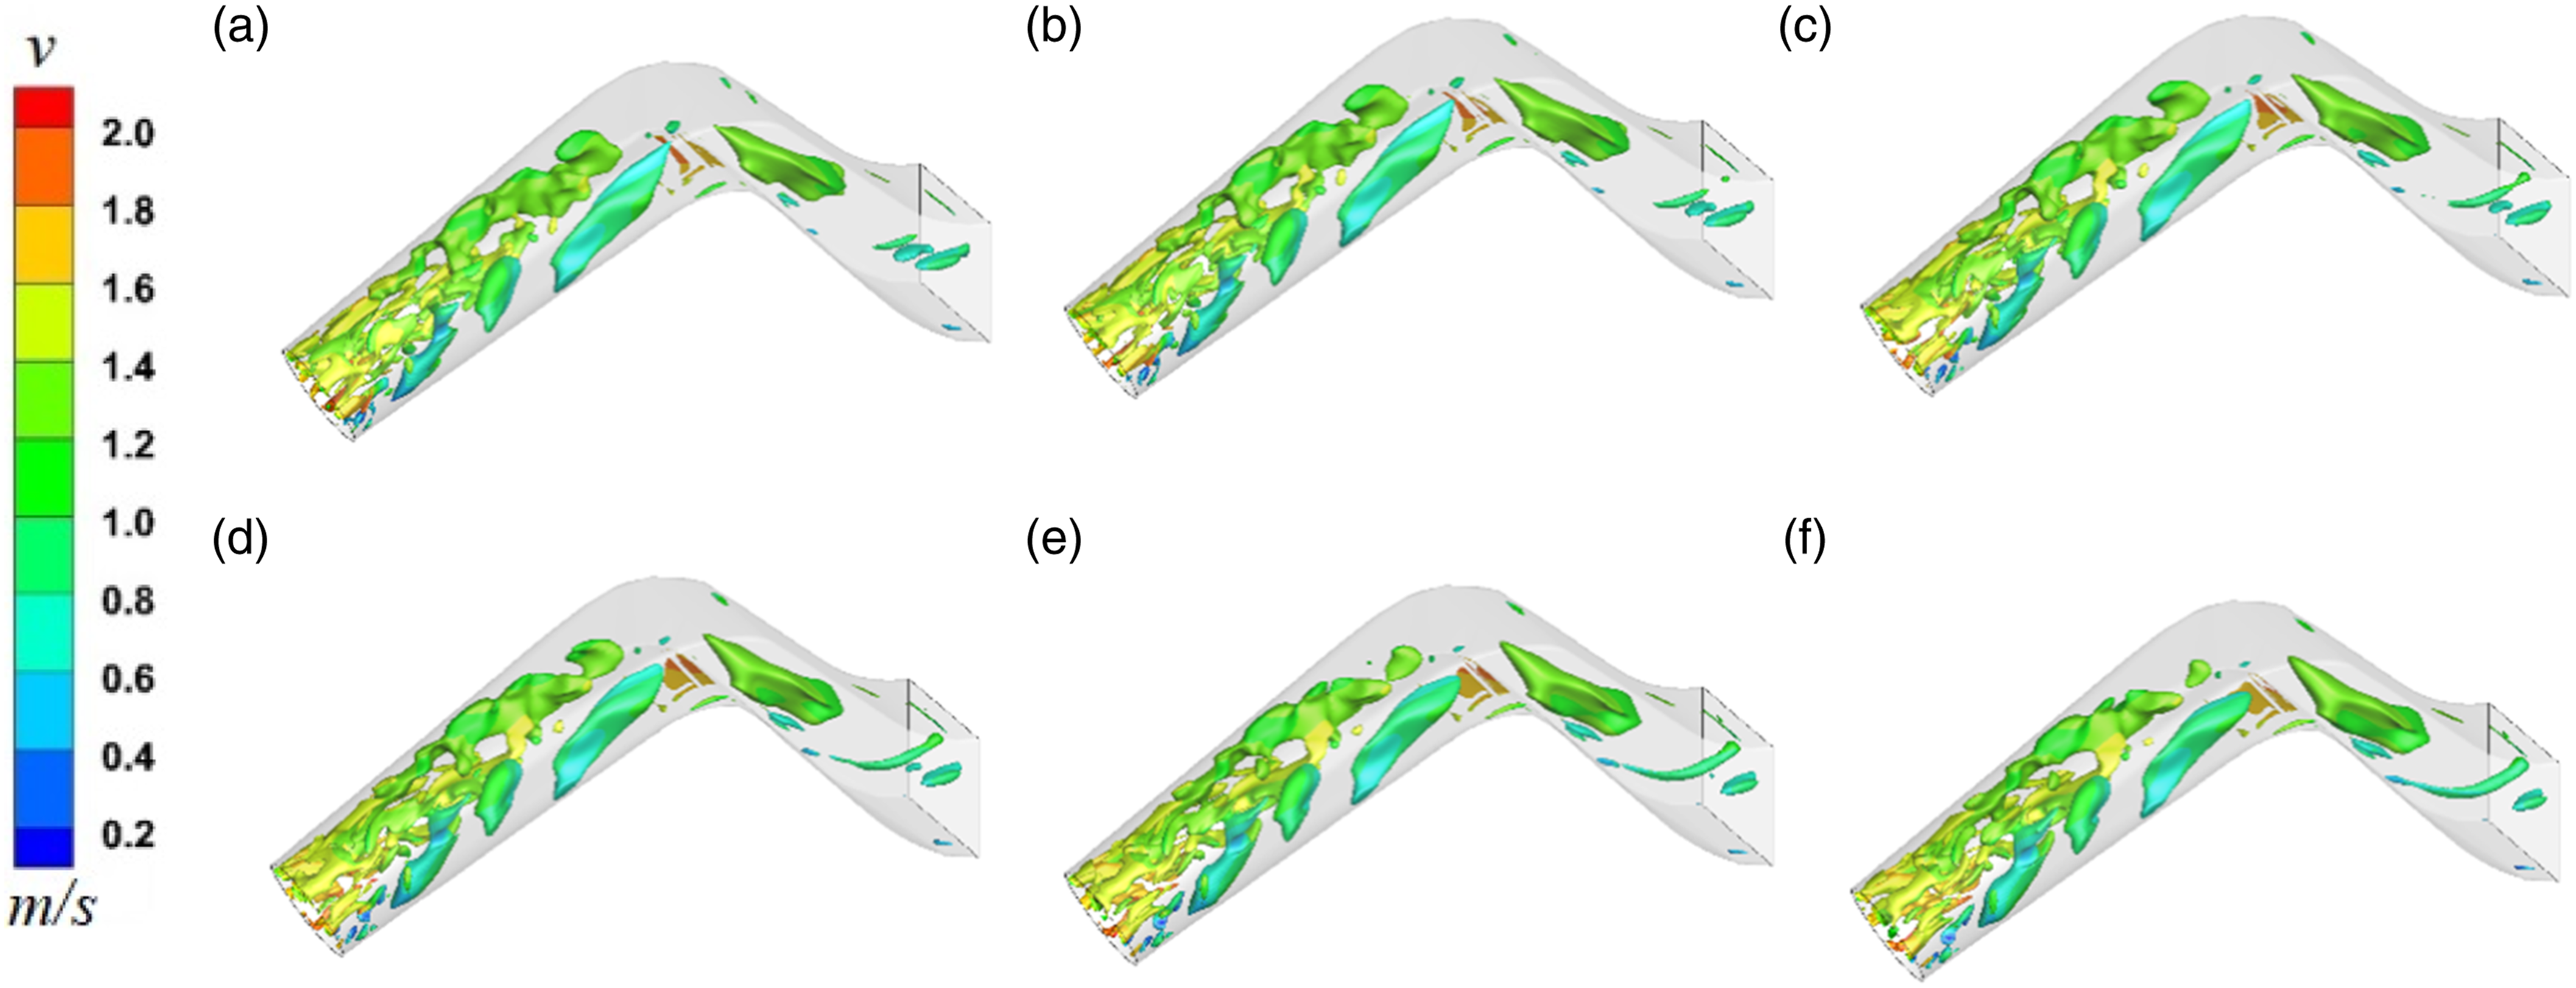
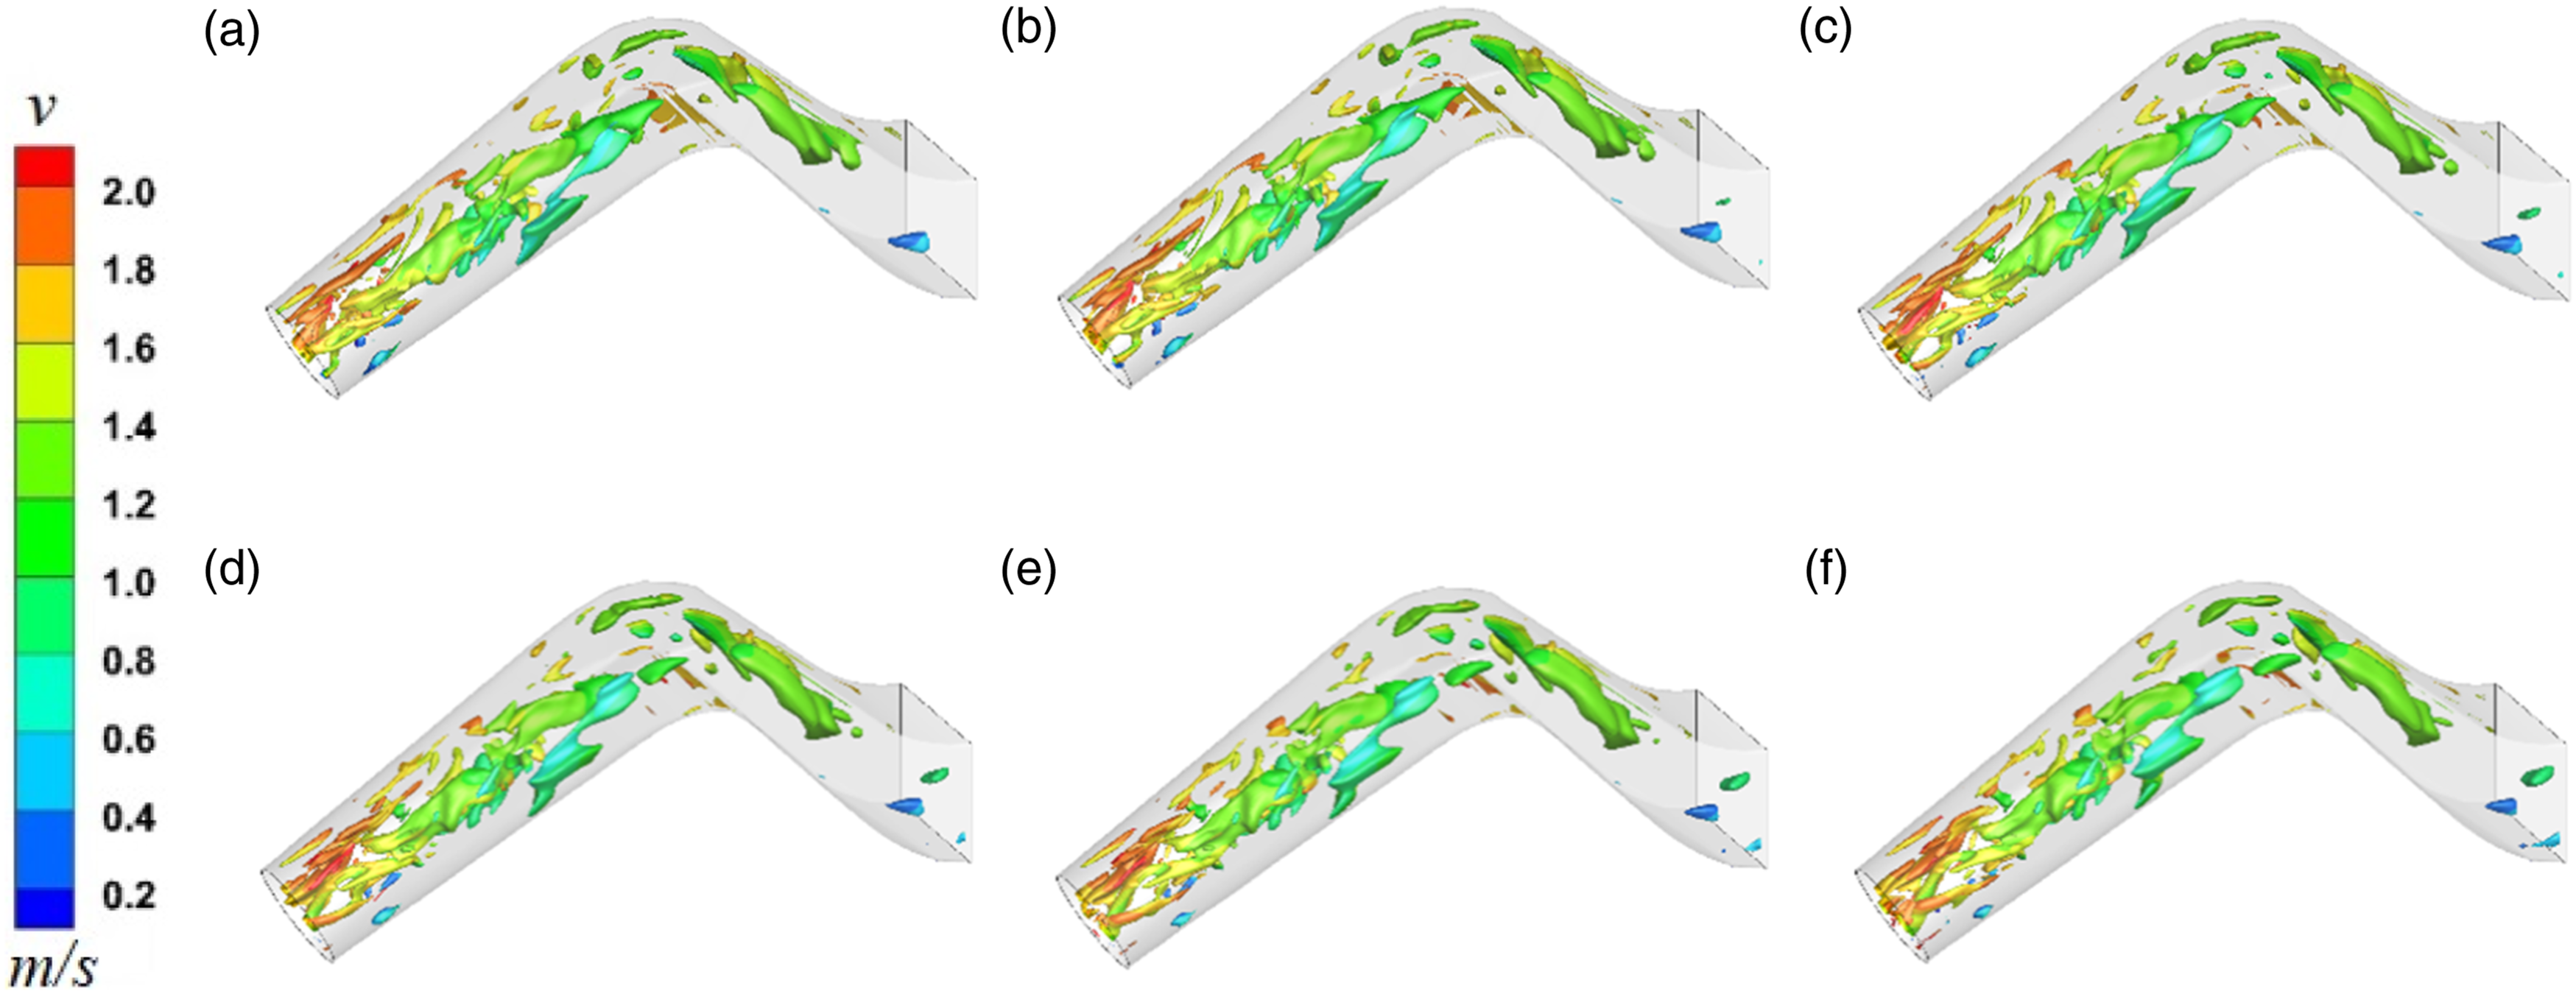
The threshold value Ω is set to 0.52, and the three-dimension vortex structure is analyzed. Figures 16–18 shows the vortex structure at various moments under various flow conditions. Apparently, there is no significant difference in the internal vortex structure of the siphon outlet pipe under the same flow condition, and there are only subtle differences, which due to the very short time interval of six different moments in a rotating period T. These subtle differences are mostly concentrated in the hump segment and the outlet of the siphon outlet pipe. It suggests that the ascending segment, hump segment, and descending segment of the pipe each have a different shape of vortex structure under various flow conditions. The vortex structure is mostly concentrated at the outlet pipe’s inlet under 0.3Q
bep
, and its volume is large, showing a long strip in the ascending segment, which is caused by the small flow velocity and low flow inertia. The vortex structure gradually shrinks and separates under the conditions of 1.0Q
bep
and 1.2Q
bep
due to a rise in flow velocity and a larger inertia impact on the flow, which generates a large degree of outflow. Behind the hump segment, a significant amount of low-speed vortex is present. Vortex structure of siphon outlet pipe (Ω = 0.52, 0.3Q
bep
): (a) 1/6T, (b)2/6T, (c) 3/6T, (d) 4/6T, (e) 5/6T and (f) T. Vortex structure of siphon outlet pipe (Ω = 0.52, 1.0Q
bep
): (a) 1/6T, (b)2/6T, (c) 3/6T, (d) 4/6T, (e) 5/6T and (f) T. Vortex structure of siphon outlet pipe (Ω = 0.52, 1.2Q
bep
): (a) 1/6T, (b)2/6T, (c) 3/6T, (d) 4/6T, (e) 5/6T and (f) T.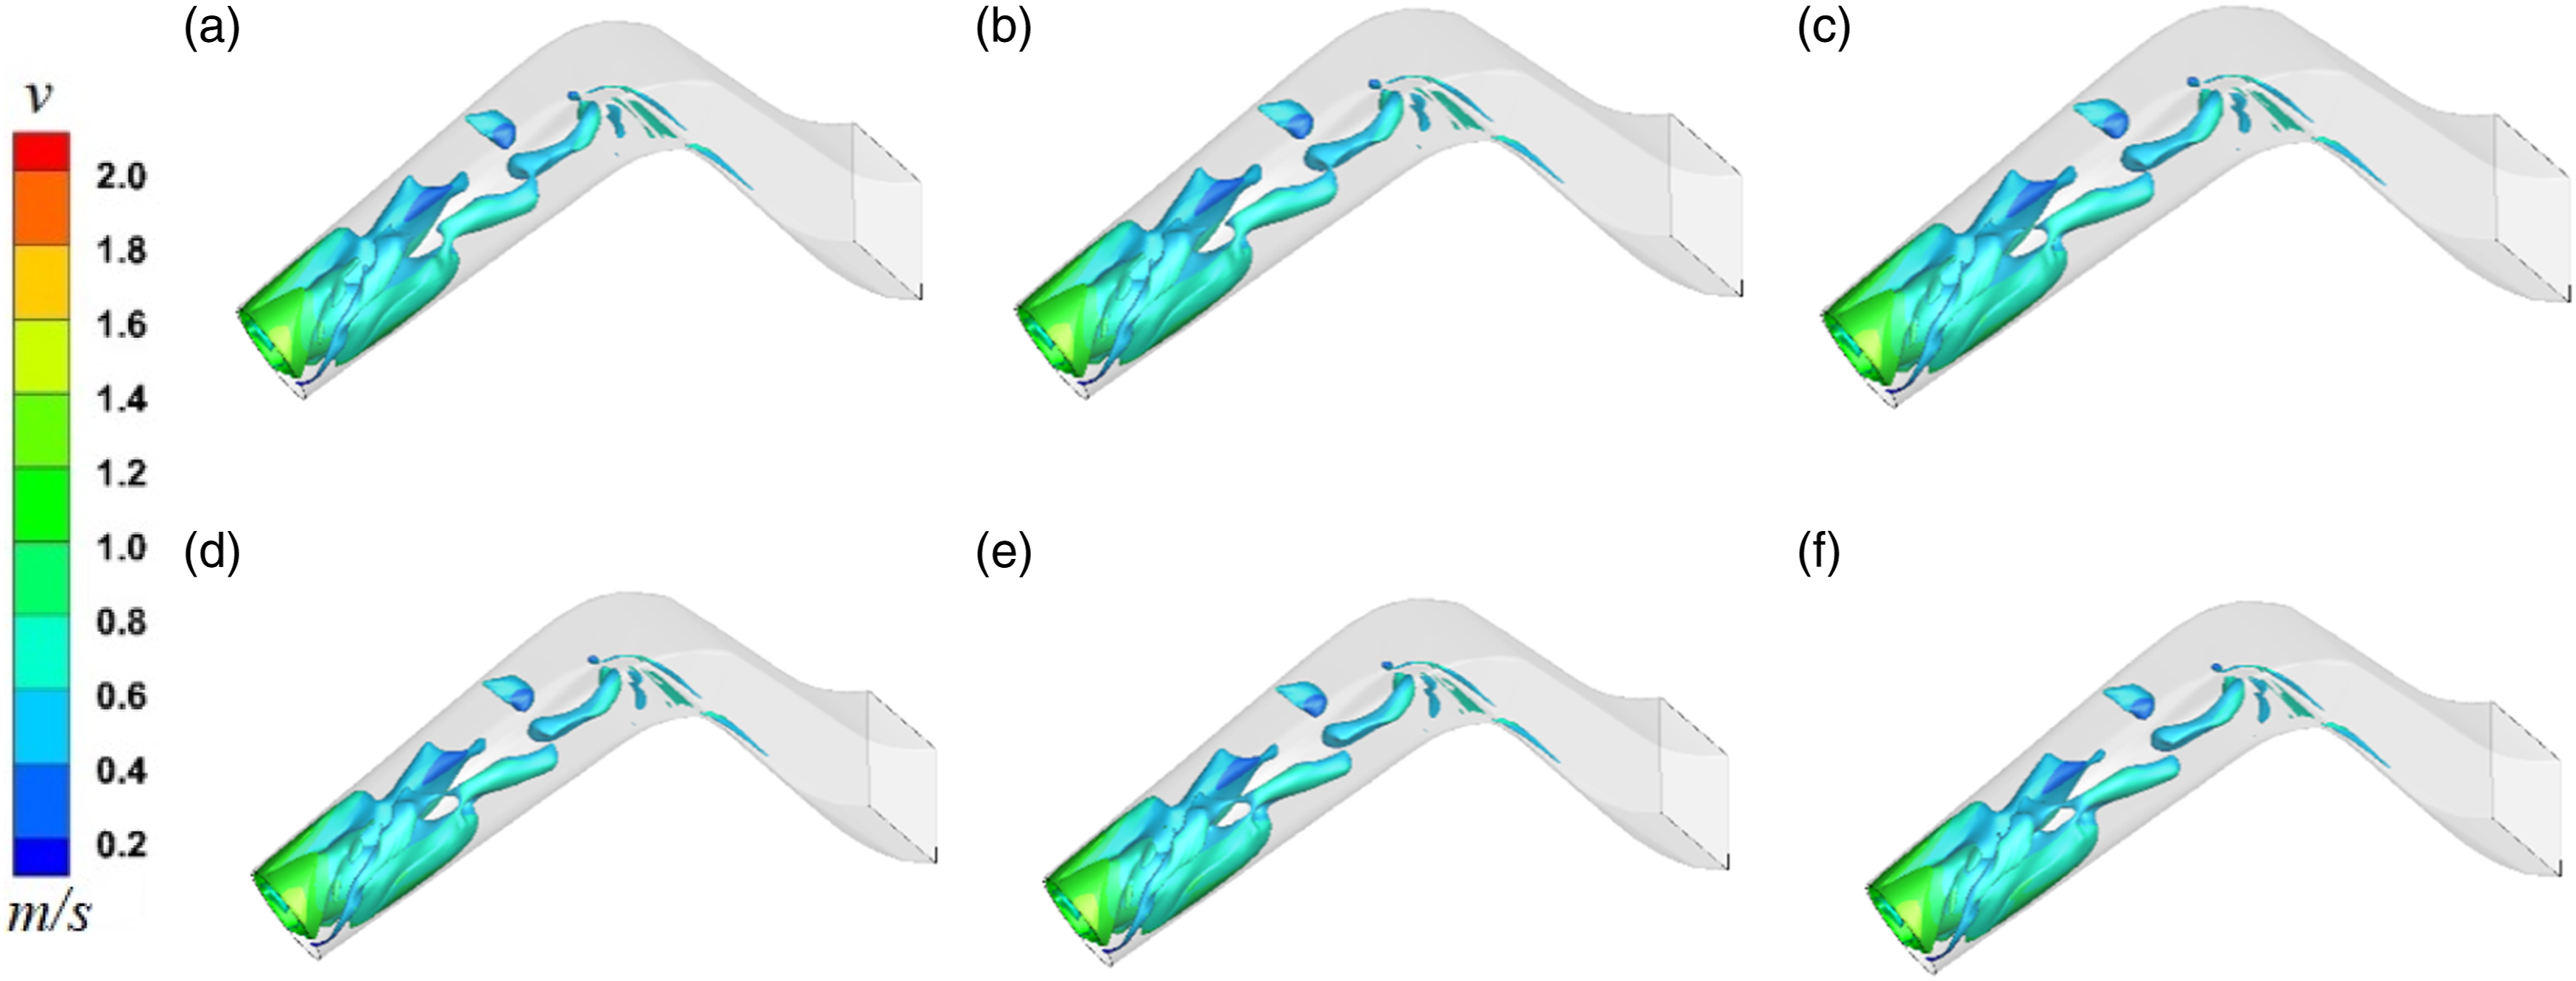
Analysis of energy conversion characteristics of each flow structure
Depending upon the impeller’s energy, the proportion of the energy conversion of each flow structure is defined as the percentage of the absolute value of the ratio of the value of energy variation of each flow structure to the energy of the impeller. This value can reflect the magnitude of hydraulic loss, the change of hydraulic loss with the flow structure, and it can provide the fluctuation with time or flow conditions of hydraulic loss. its expression is: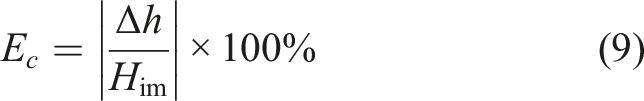
The proportion of the energy conversion of each flow structure at different moments under the optimal flow condition of 1.0Q
bep
is shown in Figure 19. The results show that the proportion of the energy conversion E
c
of different structures at the same moment is evidently different, but for a single flow structure, the proportion of the energy conversion E
c
at different moments is not much different. The proportion of the energy conversion E
c
of the elbow-shaped inlet pipe is about 1.04% in a rotating period, and the value and fluctuation of the proportion of the energy conversion are the smallest in each flow structure; The guide vane's energy variation has a rather high value, fluctuates significantly within a rotation period, and its proportion of the energy conversion E
c
is 2.85%∼5.2%; The proportion of the energy conversion E
c
of the elbow pipe is 3.57%∼6.2%, and energy changes and fluctuates greatly; The proportion of the energy conversion E
c
of the siphon outlet pipe is 4.28%∼4.57% and the value of the energy variation is large but there is no obvious fluctuation. The flow structures that primarily contribute to hydraulic loss in this pump device are the siphon outlet pipe, 60° elbow pipe and guide vane. The proportion of the energy conversion of each flow structure under 1.0Q
bep
.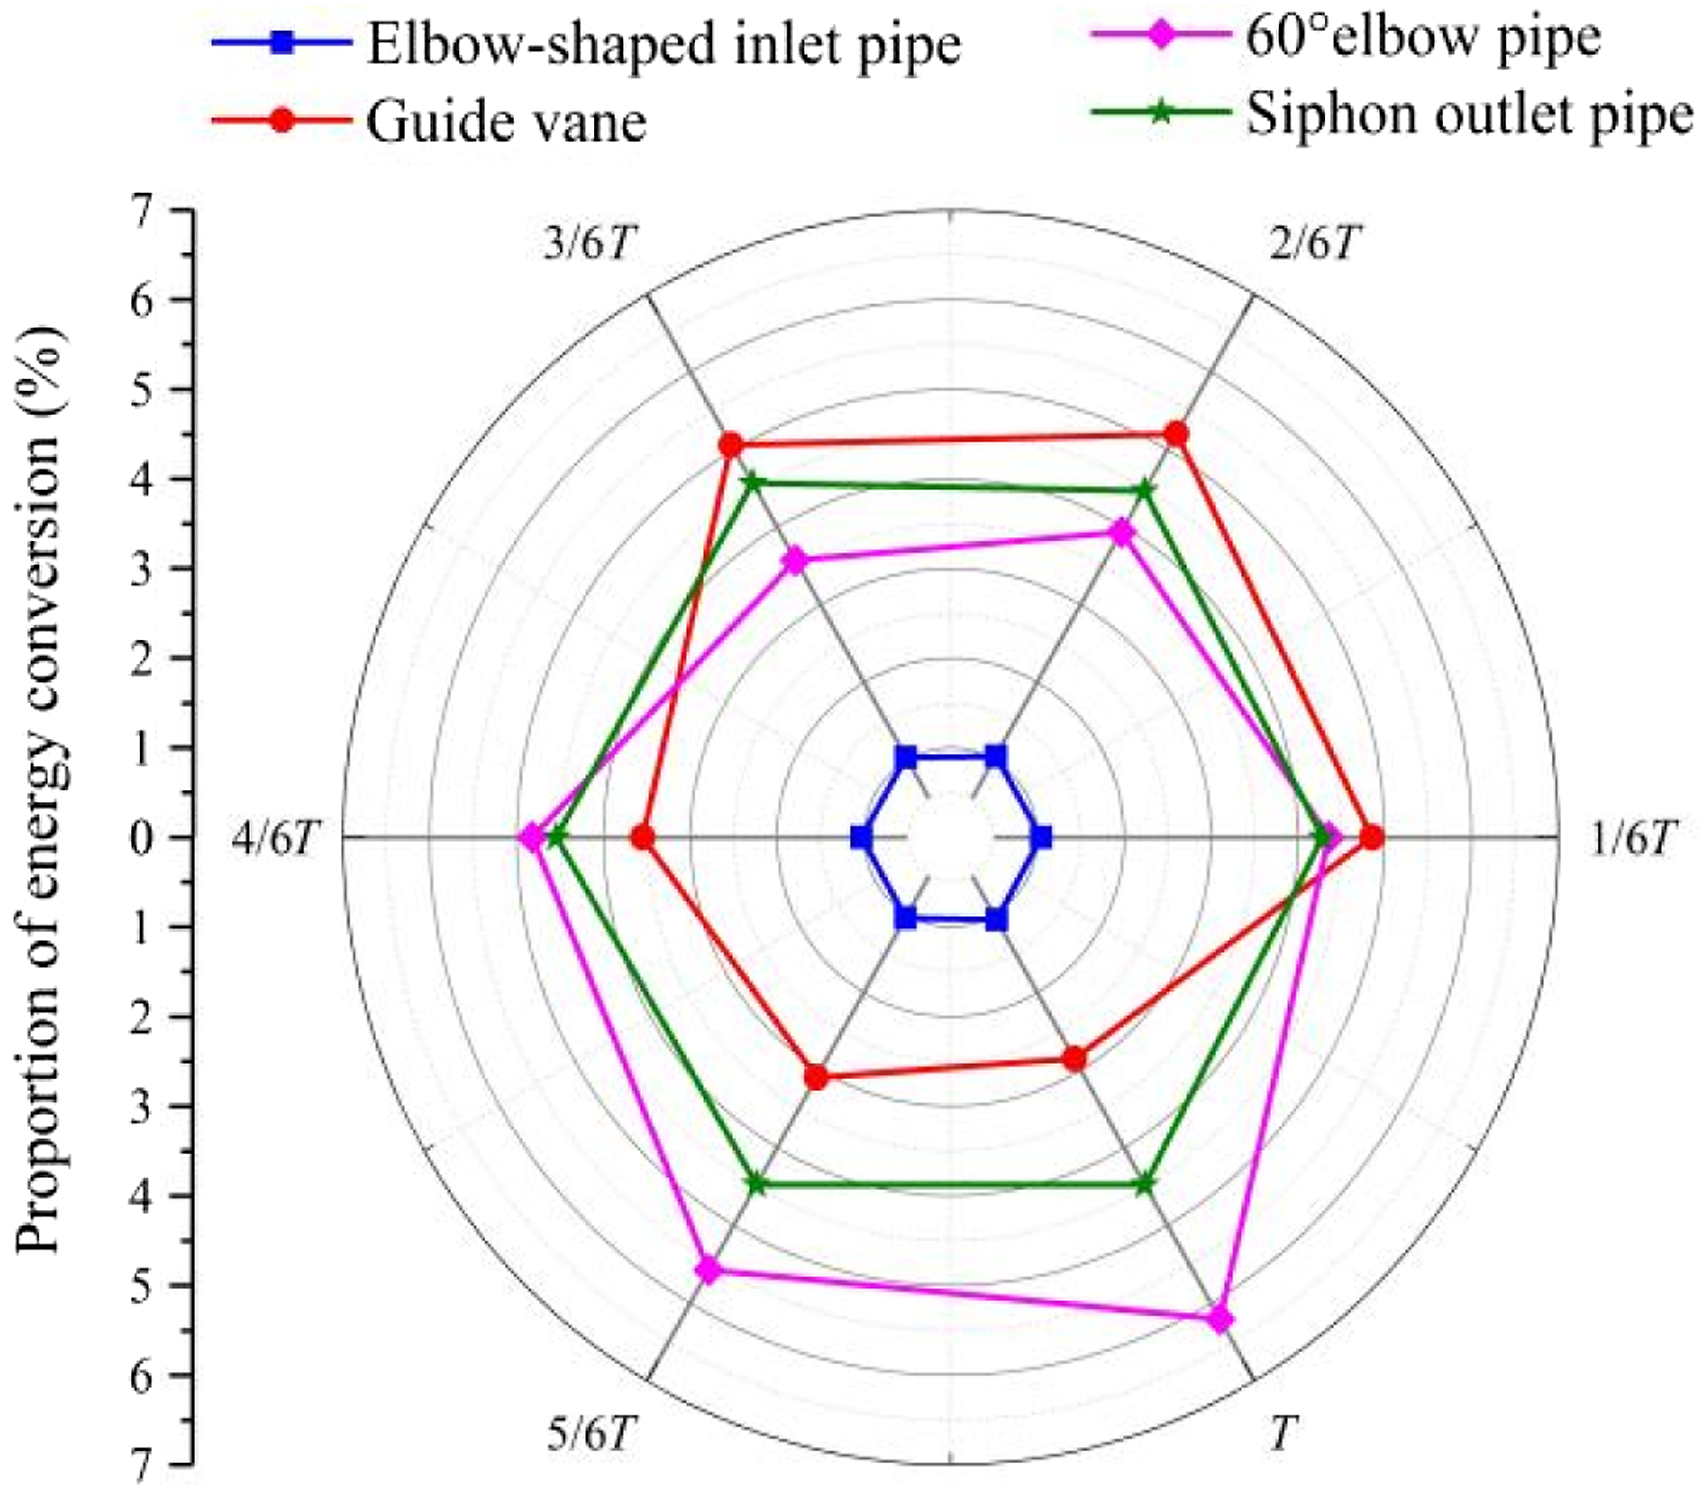
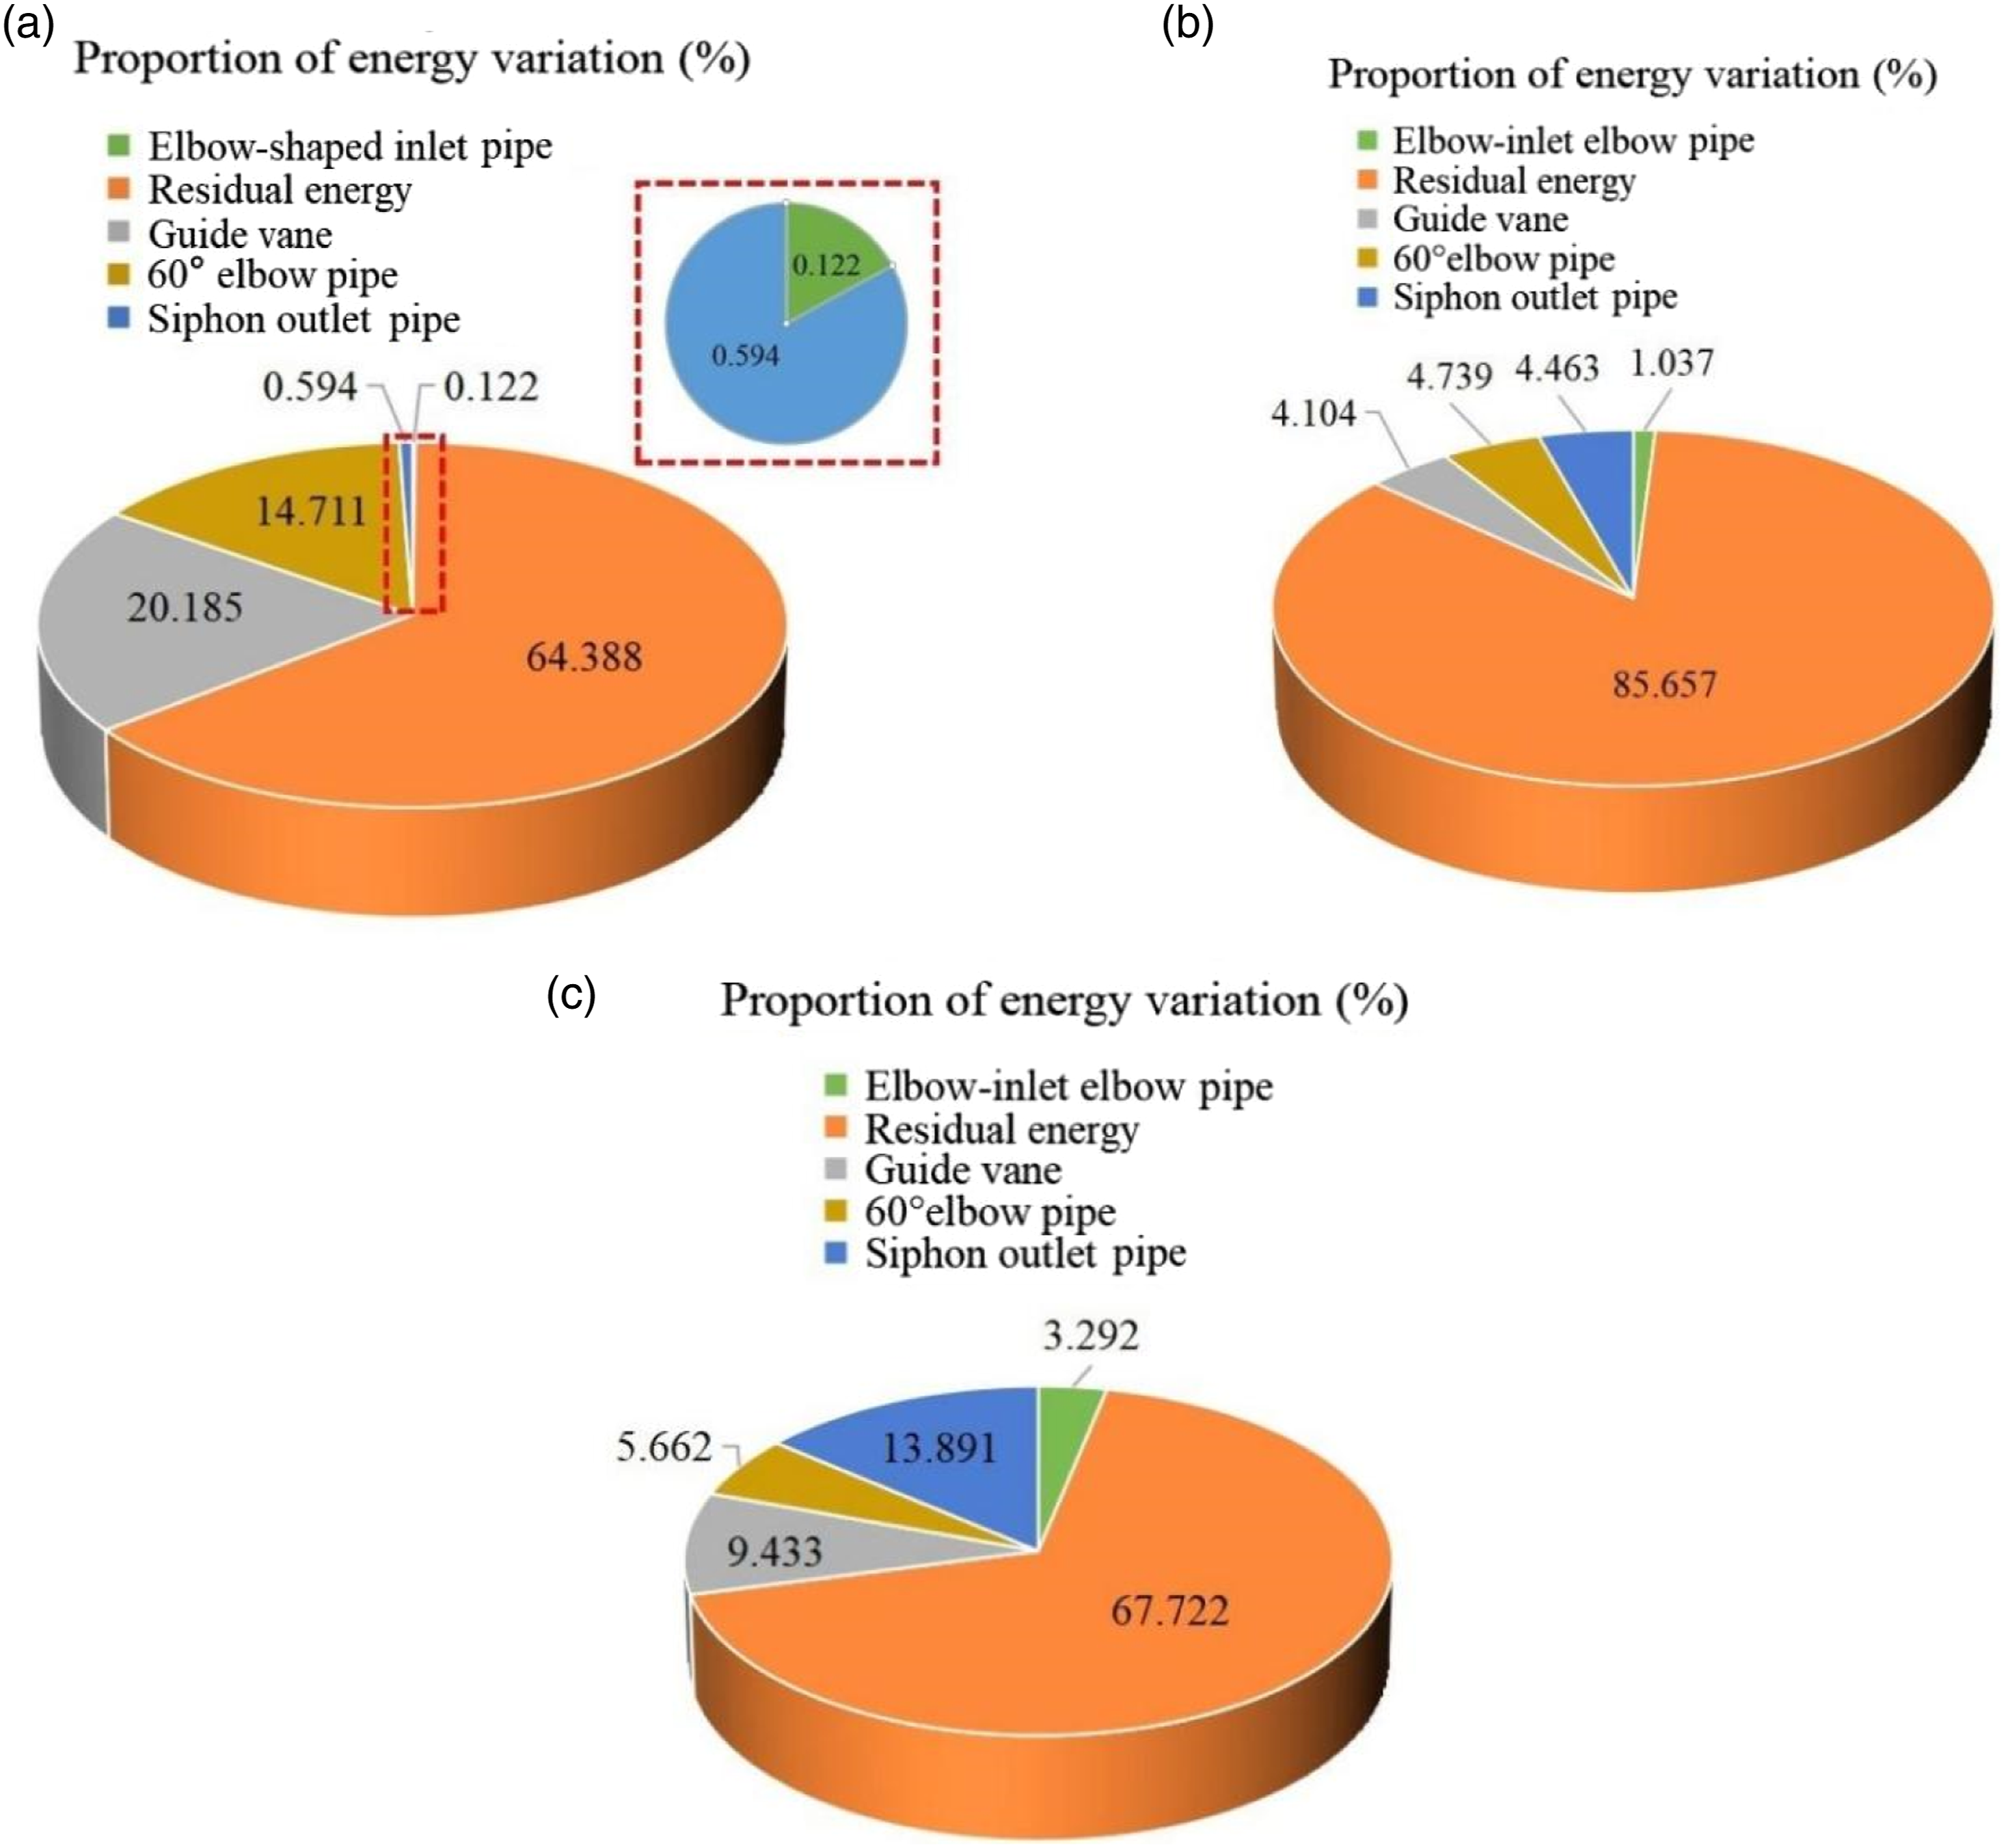
Figure 20 illustrates the average proportion of the energy conversion of each component in a rotation cycle under different flow conditions. The elbow-inlet pipe’s proportion of energy conversion E
c
gradually rises as flow rate rises, rising from 0.12% to 3.29%, indicating that the inlet pipe’s hydraulic loss gradually rises as flow rate rises; The guide vane’s proportion of energy conversion E
c
initially declines and then rises as the flow rate rises; The elbow pipe’s proportion of energy conversion E
c
declines before rises as the flow rate rises; The siphon outlet pipe's proportion of energy conversion E
c
gradually rises as flow rate rises, rising from 0.6% to 13.9%, indicating that the the siphon outlet pipe’s hydraulic loss gradually rises as flow rate rises. Average value of energy variation of each flow component in a cycle under different flow conditions: (a) 0.3Q
bep
, (b) 1.0Q
bep
and (c) 1.2Q
bep
.
Conclusions
The vertical axial flow pump device of the siphon outlet pipe’s three-dimensional unsteady flow field was numerically calculated. The predicted energy performance and the results from the physical model test were compared. The numerical simulation's accuracy and dependability were verified. Features of the energy conversion of each flow structure and the internal flow’s mechanism of the siphon outlet pipe induced by the axial flow pump were studied. The following are the major conclusions: 1. Under various flow conditions, the biased degree of each characteristic section of the siphon outlet pipe differs. The flow biased horizontally to the left and right at the elbow pipe’s inlet and outlet surface. Ratios of biased flow of the inlet surface of the elbow pipe is 1.353, 1.013 and 1.005, and ratios of biased flow of the outlet surface of the elbow pipe is 1.306,1.249 and 1.134, which gradually decreases as the flow rate rises. Ratios of biased flow are 0.78, 0.66, and 0.75 in the hump segment of the outlet pipe, which has an up-and-down biased flow. The ratios of biased flow initially decreases and then increases as the flow rate rises. 2. Under the three characteristic flow conditions, the geometry of the vortex structure in the ascending segment, hump segment and descending segment is different. At the inlet of the siphon outlet pipe, the vortex structure is large under 0.3Q
bep
, and a large low-speed vortex is generated in the descending segment. Under 1.0Q
bep
and 1.2Q
bep
, the outlet pipe presents a large range of dispersed small-volume vortices, while there is a large low-speed vortex in the descending segment. The vortex structure of the ascending segment of the outlet pipe is further decreased and separated as the flow rate rises. 3. In the range of calculated flow conditions, the elbow-inlet pipe’s proportion of energy conversion under 1.0Q
bep
is the smallest and the fluctuation is the smallest, only about 1.04%. At various moments, the energy of siphon outlet pipe, 60° elbow pipe and guide vane changes greatly and fluctuates in the range of 2.85%∼6.2%. The main source of hydraulic loss in the pump device is the flow structure following the outlet of impeller. Elbow-inlet pipe’s proportion of energy conversion increases gradually from about 0.12% to 0.39% when the flow rate rises under various flow conditions, and siphon outlet pipe’s proportion of energy conversion increases greatly from about 0.6% to 13.9%. The 60° elbow pipe and guide vane’s proportion of energy conversion initially decreases and then increases.
Considering the hydraulic coupling between the pump and the flow conduit, the spatial-temporal evolution law of the flow rate of each blade groove of the guide vane under various flow conditions is revealed, the mechanism of axial flow pump on the internal biased flow of siphon outlet pipe is revealed, and the variation of energy and distribution law of each flow structure are clarified. The ultimate goal is to improve the design idea of the guide vane and the outlet pipe of the low-head axial flow pump device, so as to reduce the hydraulic loss of the guide vane and the outlet pipe and improve the efficiency and operation stability of the low-head axial flow pumping station.
Footnotes
Declaration of conflicting interests
The author(s) declared no potential conflicts of interest with respect to the research, authorship, and/or publication of this article.
Funding
The author(s) disclosed receipt of the following financial support for the research, authorship, and/or publication of this article: The author(s) would like to thank the National Natural Science Foundation of China (Grant No. 51609210), Major Projects of the Natural Science Foundation of the Jiangsu Higher Education Institutions of China (Grant No. 20KJA570001), the Technology Project of the Water Resources Department of Jiangsu Province (Grant No. 2022074), the Science and Technology Plan Project of Yangzhou City (Grant No. YZ2022192), the Open Research Fund of Key Laboratory of Jinan Digital Twins and Intelligent Water Conservancy (Grant No. 37H2022KY040101), the Scientific Research Program of Jiangsu Hydraulic Research Institute (Grant No. 2021) and the Postgraduate Research & Practice Innovation Program of Jiangsu Province (Grant No. SJCX23_1952) for their financial support.