
Abstract
Because current emissions accounting approaches focus on an entire city, cities are often considered to be large emitters of greenhouse gas (GHG) emissions, with no attention to the variation within them. This makes it more difficult to identify climate change mitigation strategies that can simultaneously reduce emissions and address place-specific development challenges. In response to this gap, a bottom-up emissions inventory study was undertaken to identify high emission zones and development goals for the Durban metropolitan area (eThekwini Municipality). The study is the first attempt at creating a spatially disaggregated emissions inventory for key sectors in Durban. The results indicate that particular groups and economic activities are responsible for more emissions, and socio-spatial development and emission inequalities are found both within the city and within the high emission zone. This is valuable information for the municipality in tailoring mitigation efforts to reduce emissions and address development gaps for low-carbon spatial planning whilst contributing to objectives for social justice.
Keywords
I. Introduction
It is estimated that up to 80 per cent of global carbon-based greenhouse gas (GHG) emissions can be attributed to urban centres, highlighting their disparate contribution to global emissions relative to their land area.(1) Urbanization is important for the economic growth that underpins development, but it can be associated with various social and environmental challenges, including urban sprawl, informal settlement growth, increasing risk of climate change and disasters, decreasing environmental health, habitat destruction and increasing GHG emissions. Countries in the global South, especially, face major development challenges along with their rising emissions.(2) In these countries, responding to emissions can be considered an opportunity not only for making the transition to low-carbon cities,(3) but for working simultaneously towards other important development goals.(4) Despite the extent of the challenges in cities in the global South, there has been little mitigation research from these countries. While emissions inventories are not uncommon, research addressing mitigation in the context of the wider range of development challenges is especially lacking. In focusing on Durban in South Africa (SA), this paper contributes to addressing this gap.
A specific challenge for climate change mitigation is the spatial distribution of GHG emissions within cities due to the varying industrial, development, social, economic and natural conditions in different parts of the city. Responsibilities and mitigation efforts need to be tailored to those differences.(5) Spatial planning on the part of local governments is therefore an essential component of strategic policies to address climate mitigation, but has only recently been addressed as part of climate mitigation, even in high-income countries in Europe and North America.(6) For the global South, this complex spatial distribution of emissions and developmental needs provides the context for equitable and fair mitigation interventions and outcomes linked to sustainable development.(7) This is key as there are concerns that climate change interventions can reproduce or reinforce existing spatial and social inequalities or create new inequalities within the city,(8) undermining sustainable development. This brings the issue of climate justice, usually addressed within the international climate policy arena, to the local scale.(9) Climate justice encompasses distributive justice, procedural justice, and recognition of existing injustices.(10)
In the case of mitigation, distributive justice concerns rights and responsibilities – who has the right to emit GHGs and who should take responsibility for climate change by reducing their GHG emissions.(11) Initially framed in relation to nation-states, there is increasing attention to relating the responsibilities for GHG emissions to the individual.(12)
Procedural justice concerns access to, and inclusion and participation in, decision-making. The recognition of historical injustices and of differential responsibilities, costs and benefits of mitigation for various actors can contribute to the successful implementation of interventions that deliver developmental co-benefits.(13) These aspects determine the fair distribution of rights, responsibilities, capacities, burdens and benefits among people over space and time.(14)
This study provides a first attempt to explore the spatial distribution of anthropogenic GHG emissions in Durban, drawing attention to high-carbon emission zones to inform low-carbon spatial planning strategies at the neighbourhood or ward scale in South Africa. It also indicates the ways in which this low-carbon spatial planning can simultaneously address other development gaps, contributing to social justice objectives.
II. Background: Approach to Understanding Place-Based Mitigation
a. Spatial attribution versus emissions inventories in South African cities
An emissions inventory accounts for the anthropogenic emissions of a place, system or boundary for a specified time period.(15) Atmospheric emissions inventories are conducted for the purposes of regulation, compliance, and determination of inputs in climate change models.(16) Furthermore, emissions inventories have a strong link to socioeconomic development and climate change justice. Compiling them is the first step in the shift towards low-carbon development, and they are policy instruments used to determine equity in mitigation responsibilities.(17) When compiled at the neighbourhood scale, emissions inventories create awareness by connecting activities to their global impact.(18) Studies to determine the spatial distribution of emissions at neighbourhood scales are often top-down, based on land use or population information, and thus they lack bottom-up approaches with activity data and emission factors. (Emission factors express the mass of GHG emitted per activity or energy use, assuming a linear relationship with activities.(19))
The majority of studies are undertaken from the production perspective, which is unsuitable for cities as the perspective underestimates emissions and does not attribute responsibility.(20) In response to the shortcomings of the production perspective, emissions quantification from end-user, i.e. consumption, locations is preferred(21) for assigning responsibility for activities from sectors such as residential, commercial, industrial, transport and waste.(22) However, inventory methods were devised for high-income cities; they do not consider developing city contexts or integrate socioeconomic factors.
The emissions inventory approach needs to come within the planning framework of the municipality, covering the key sectoral emissions, using a bottom-up approach. The approach should also be easily applied and use already available datasets(23) that yield quick results and cut costs. In South Africa, local governments do not have the resources to spend on modelling that calls for often expensive, specialized software requiring detailed data inputs. Even if software is free, municipalities often lack the human and technical capacity to use these tools.(24) There is limited research on urban GHG emissions in South Africa. When municipalities compile emissions inventories, it is a voluntary act, and accounts mostly for emissions from their operations. Thus, there is a lack of evidence to link emissions reductions to broader spatial planning and to include citizens, businesses and industries.
III. Research Study
a. Background on Durban
The city of Durban, located on the east coast of South Africa in the KwaZulu-Natal (KZN) province (Map 1), is governed by the eThekwini Metropolitan Municipality (EM). Durban has a population of 3.5 million, covers an area of 2,297 km2, and contributes 10.9 per cent and 65.5 per cent to the national and provincial gross domestic product respectively.(25) The major economic activities of the city are shipping, logistics, manufacturing industries, and tourism. Since the late 1990s, sustainable development has been addressed in city planning and policy, in response to national government objectives, but has not been applied well in large-scale development plans.(26) Durban is considered to have the most fragmented spatial form of all South African cities due to its bisected topography, coupled with the legacy of apartheid spatial planning(27) and the current, post-apartheid spatial planning, which has given prominence to private developers.(28) Of Durban’s metropolitan area, 25 per cent is considered urban, 30 per cent peri-urban, and 45 per cent rural.(29)
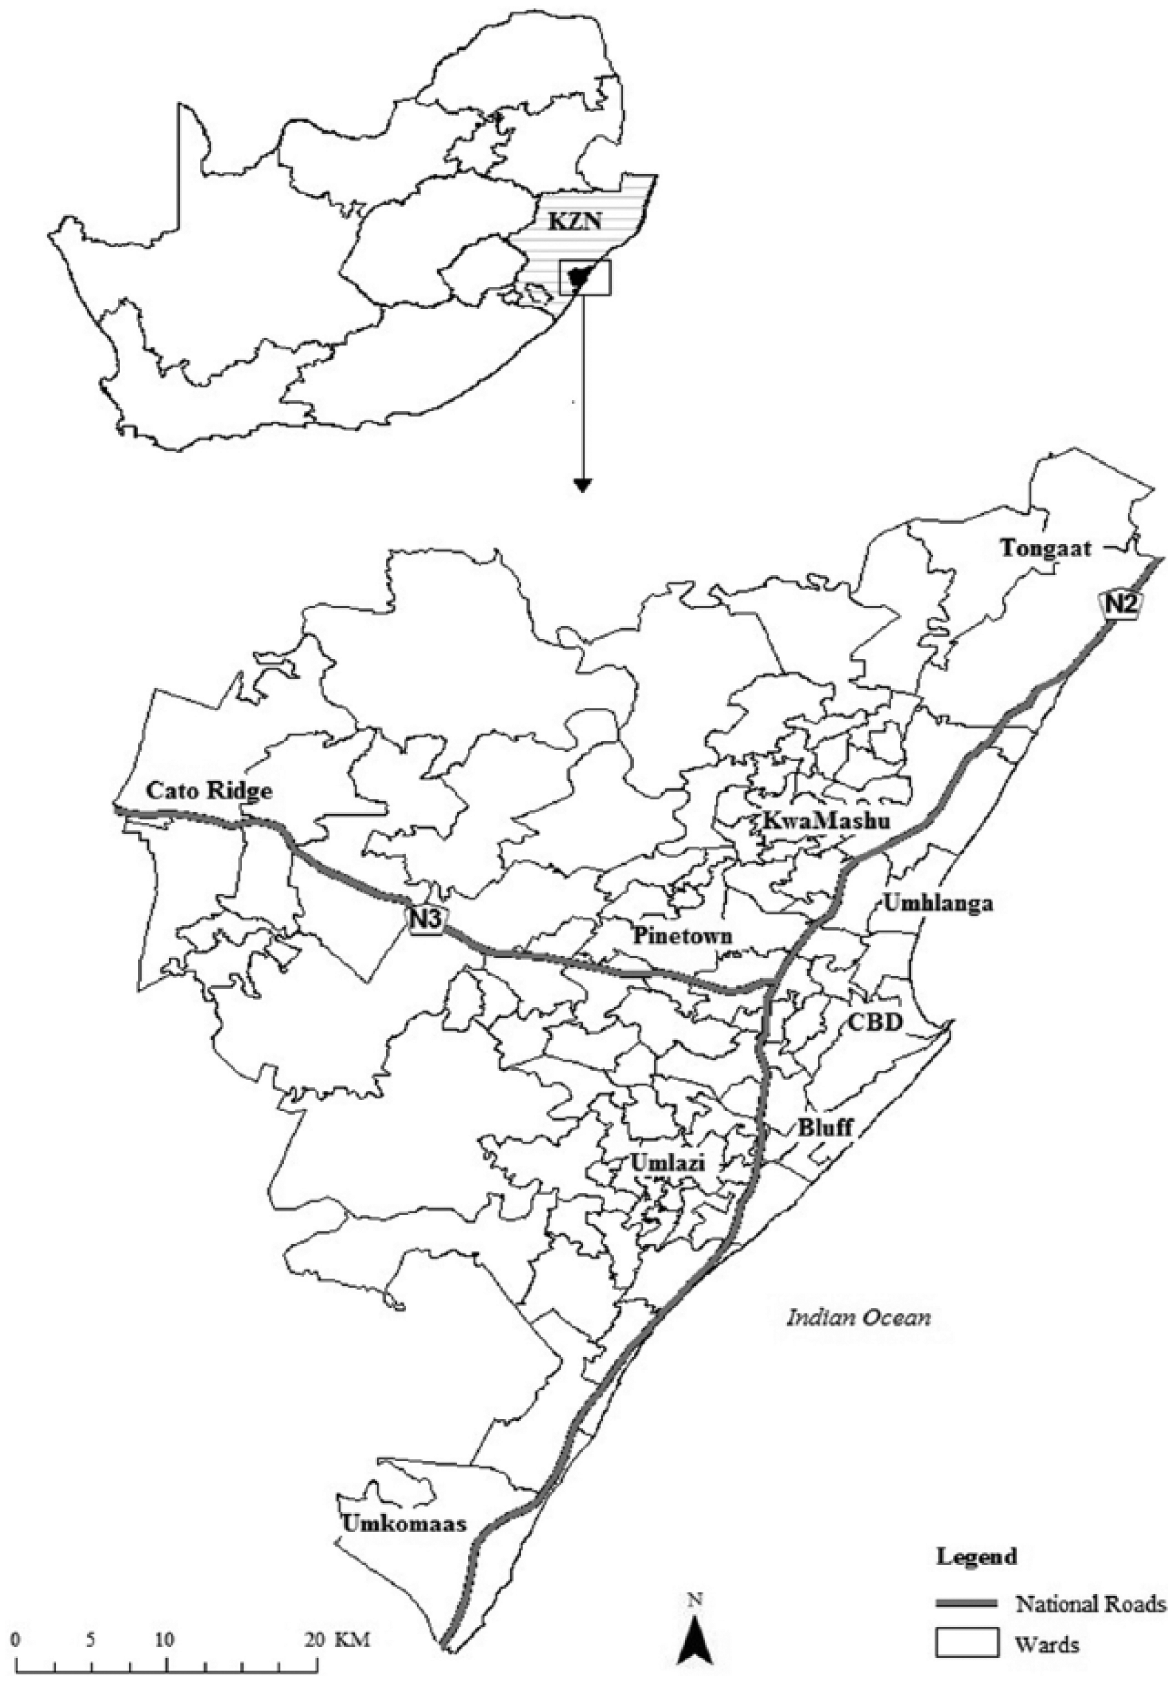
Major suburbs of Durban and the city location within SA and KZN
b. Methods
The methodological approach developed for this study combined the analysis of emissions inventory results and a qualitative analysis of local development plans to identify locations of high emissions and key developments, as shown in Figure 1.
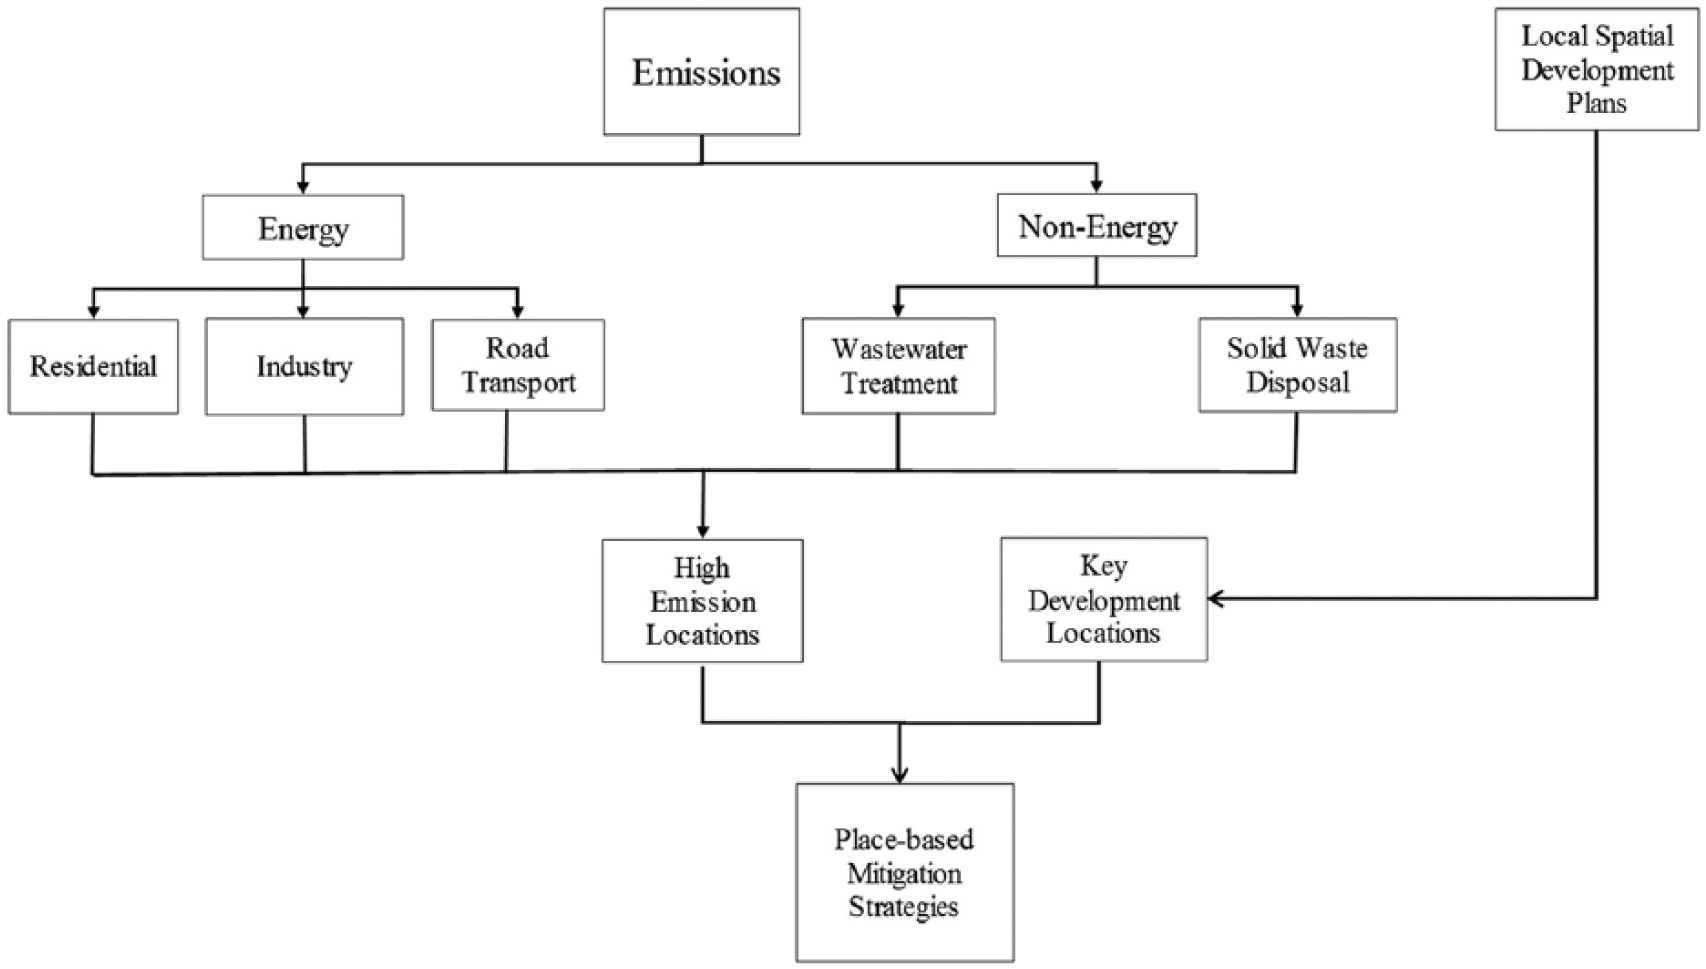
Framework depicting the approach used to identify place-based mitigation strategies
Inventory methods and data sources
An inventory of key emissions activities in Durban for 2013 was calculated using the community inventory guidelines of ICLEI – Local Governments for Sustainability,(30) which are specifically designed for local-scale emissions, supplemented with information from other studies.(31) The key GHGs calculated from emissions activity sources are: carbon dioxide (CO2) from consumption of road transport fuel, electricity (which is fossil fuel-based) consumption from households and industries, and nitrous oxide (N2O) and methane (CH4) from landfills and wastewater treatment plants. Information on the methods, local activity data sources, and emission factors are provided in Table 1.
Summary of methods, activity data, and emission factors used in compiling the GHG emissions inventory
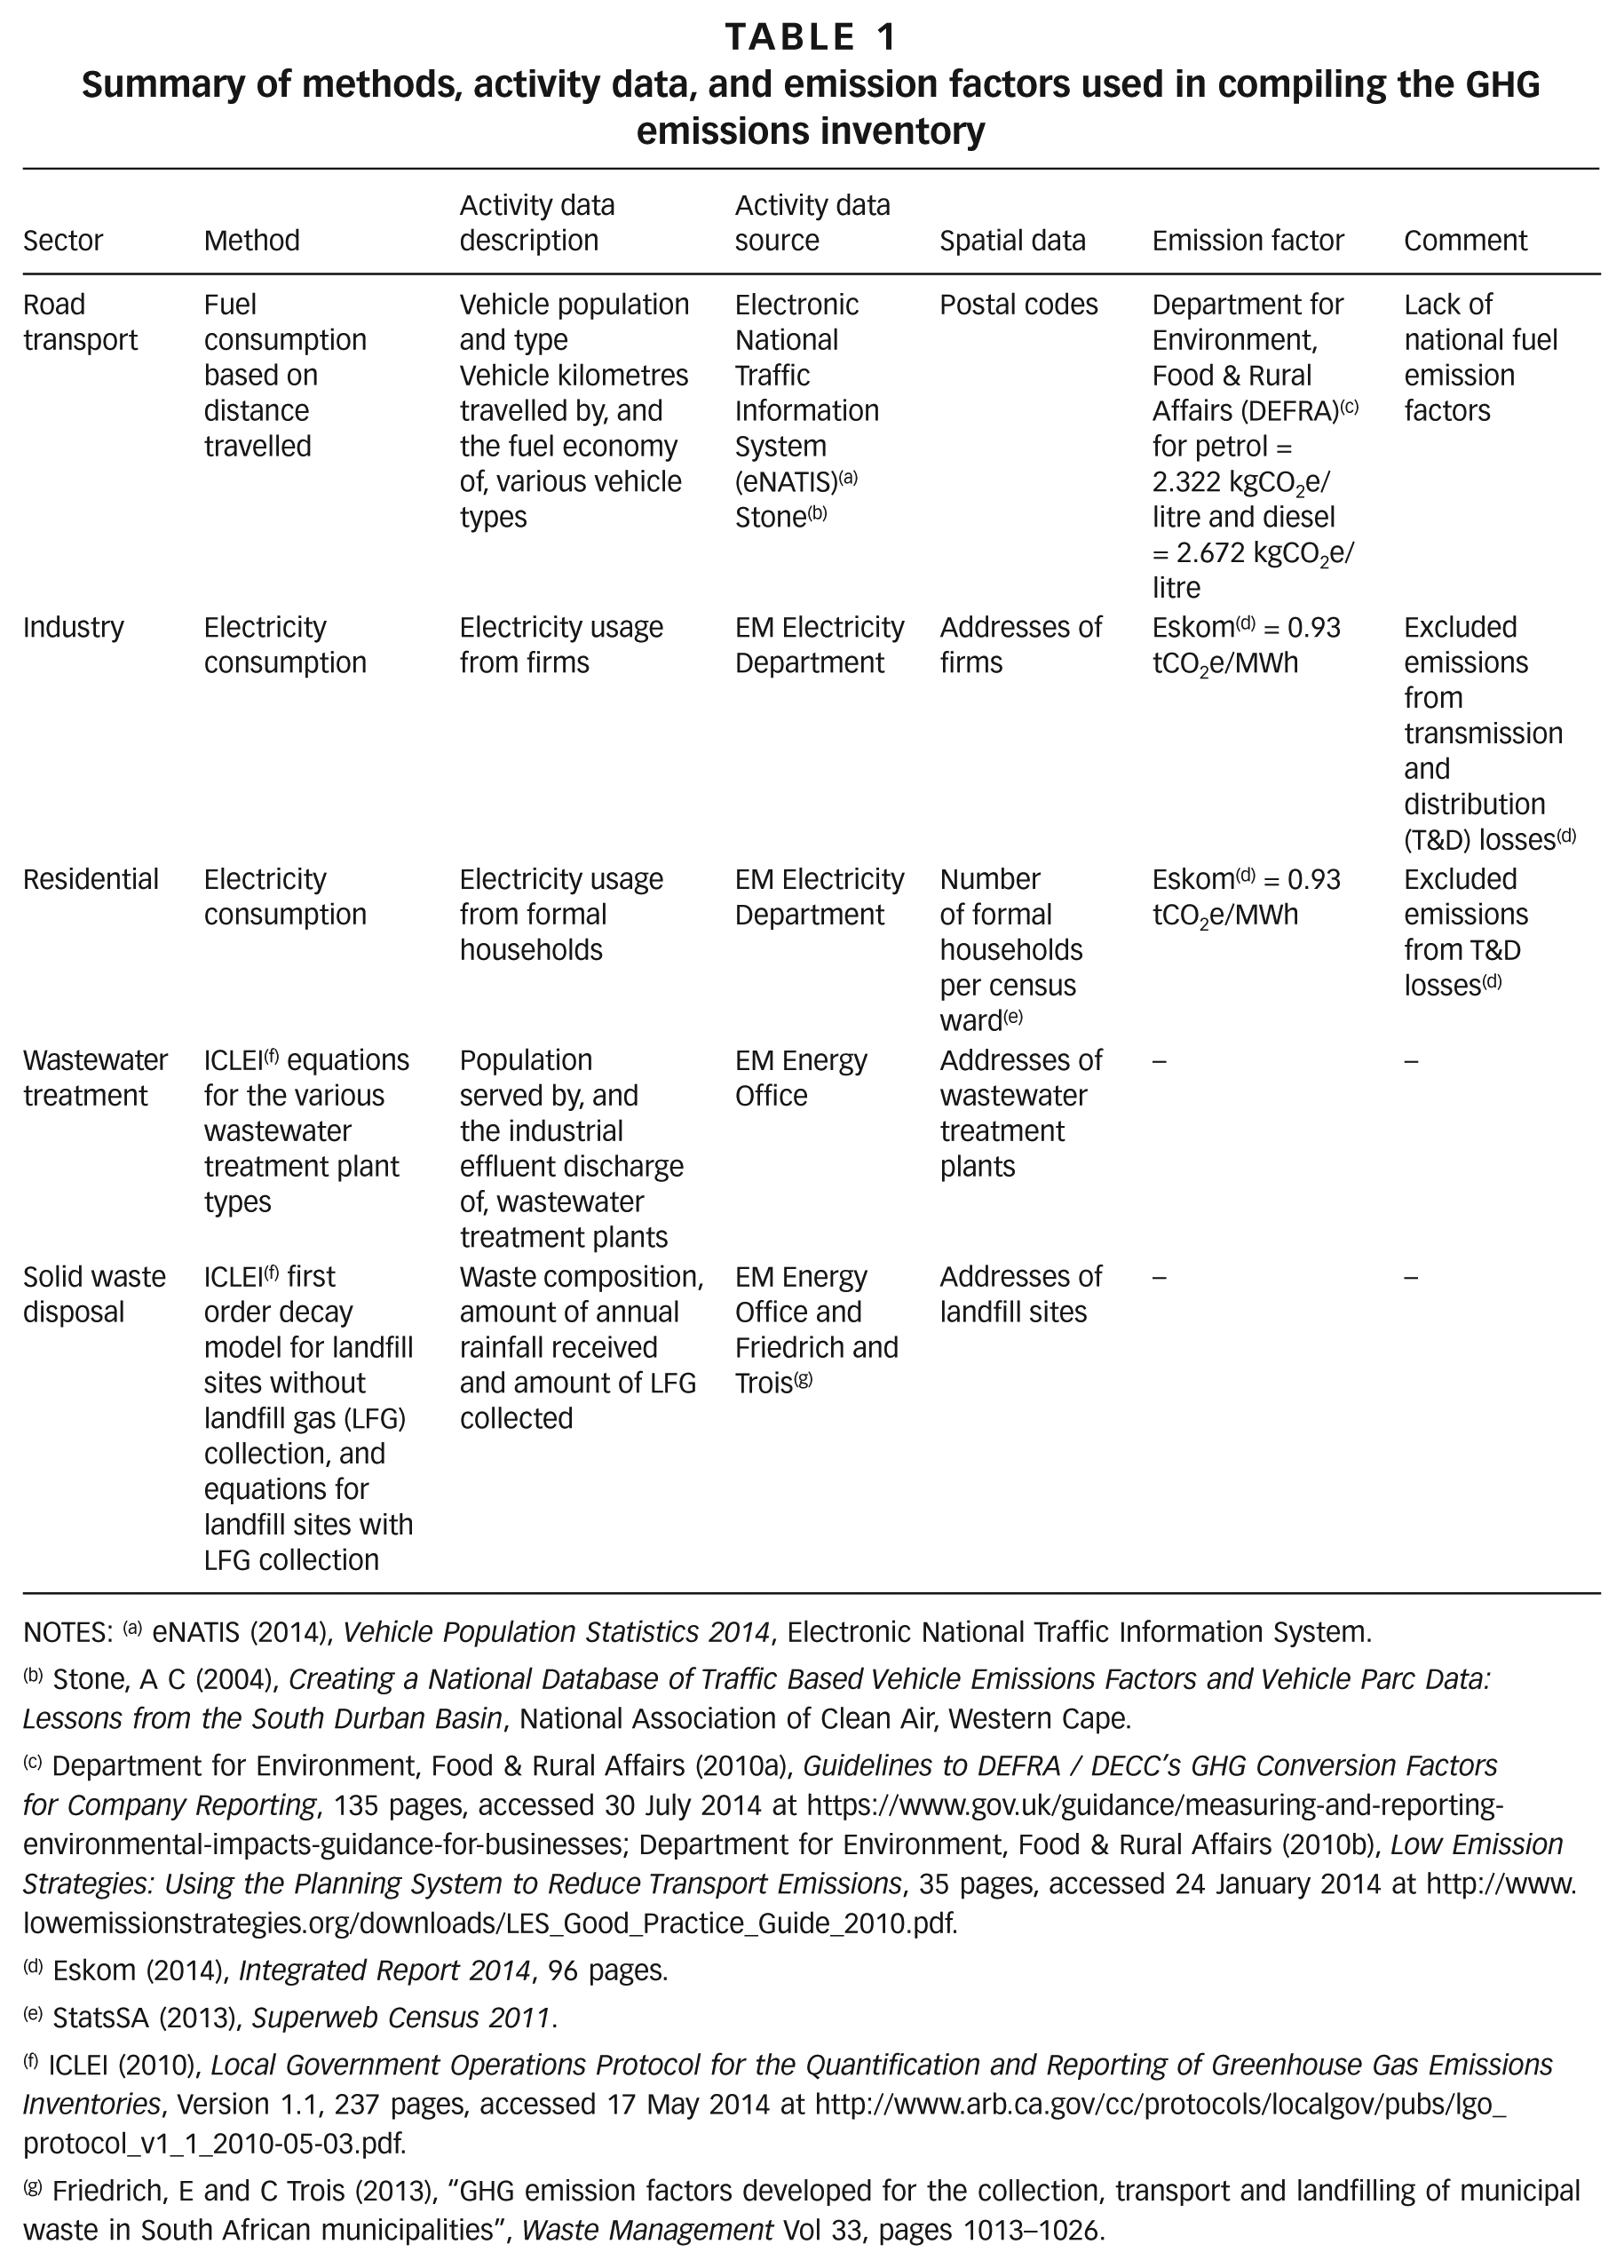
NOTES: (a) eNATIS (2014), Vehicle Population Statistics 2014, Electronic National Traffic Information System.
Stone, A C (2004), Creating a National Database of Traffic Based Vehicle Emissions Factors and Vehicle Parc Data: Lessons from the South Durban Basin, National Association of Clean Air, Western Cape.
Department for Environment, Food & Rural Affairs (2010a), Guidelines to DEFRA / DECC’s GHG Conversion Factors for Company Reporting, 135 pages, accessed 30 July 2014 at https://www.gov.uk/guidance/measuring-and-reporting-environmental-impacts-guidance-for-businesses; Department for Environment, Food & Rural Affairs (2010b), Low Emission Strategies: Using the Planning System to Reduce Transport Emissions, 35 pages, accessed 24 January 2014 at http://www.lowemissionstrategies.org/downloads/LES_Good_Practice_Guide_2010.pdf.
Eskom (2014), Integrated Report 2014, 96 pages.
StatsSA (2013), Superweb Census 2011.
ICLEI (2010), Local Government Operations Protocol for the Quantification and Reporting of Greenhouse Gas Emissions Inventories, Version 1.1, 237 pages, accessed 17 May 2014 at http://www.arb.ca.gov/cc/protocols/localgov/pubs/lgo_protocol_v1_1_2010-05-03.pdf.
Friedrich, E and C Trois (2013), “GHG emission factors developed for the collection, transport and landfilling of municipal waste in South African municipalities”, Waste Management Vol 33, pages 1013–1026.
The emissions inventory is limited by the lack of coverage of industrial processes related to processes and on-site fuel combustion. This is significant as Durban is home to two petroleum refineries (which produce 60 per cent of SA’s petrol),(32) a paper mill, a vehicle manufacturer (the largest in southern Africa), and a large number of chemical industries. Industrial process emissions are not accounted for, due to the lack of available data on direct measurements.(33) Industrial energy use data are lacking as they are difficult to disaggregate to the local scale, economic sub-sectors, and individual facility level. Emissions from residential on-site burning of biofuel and other energy sources are also not included due to the paucity of studies on combustion amounts.(34) There is a backlog in electricity service provision of 323,000 houses to be addressed, as well as a number of informal settlements.(35) Relative to industrial emissions, these emissions are not deemed significant, although the contribution toward localized pollution and significant health and safety impacts is acknowledged. Durban has the busiest port in Africa and a major airport, so energy use from these sectors is therefore expected to be significant. Energy consumption from the marine and aviation transport sectors was not included due to uncertainties on how to attribute responsibility and spatially disaggregate emissions.(36) Despite these gaps, the emissions inventory developed provides a platform to begin the discussion on the spatial distribution of emissions, and also provides a foundation to build on, with data for the other key sources, for future work.
Local development plans
South African municipal planning is informed by key strategic documents, which include the Long Term Development Framework (LTDF), Integrated Development Plan (IDP), Spatial Development Framework (SDF) and Spatial Development Plan (SDP). The LTDF provides the future direction of economic, social and environmental development for the municipality. This is implemented through the IDP, which is produced every five years with progress tracked annually, to address service delivery backlogs and ensure economic growth.(37) The IDP includes planning guidance in the form of the SDF, which translates development intentions into land use plans, as well as transport, environmental and infrastructure implications, under the SDP.(38) The EM strategic planning documents were read to find information on two important themes: (i) the existing mitigation efforts in the development plans of the municipality according to economic sector; and (ii) the spatial locations related to economic, social and environmental development priorities, known as key development areas. This information was categorized according to location, economic sectors and sub-sectors, the stakeholders involved, and project-specific details. Then we compared this to the areas of high and low emissions to identify links to emissions reduction and development co-benefits.
IV. Findings
The first part of this section, IVa, presents a summary of the developmental context and priorities of the EM, followed by a discussion in Section IVb of the spatial attribution and analysis of emissions. The areas of high emissions are looked at in depth in relation to climate justice to determine the responsibilities for emissions reduction. The specific socio-spatial planning and development practices that have resulted in those emissions are discussed in Section IVc.
a. Current key development priorities
The EM has developed a deprivation index, which is a composite measure that includes engineering and social infrastructure backlogs, unemployment and income. The most deprived neighbourhoods are the peri-urban and former township communities. These areas currently experience low levels of access to basic services, and high levels of unemployment and poverty;(39) they are thus most in need of development. The least deprived neighbourhoods are the urban core – which is well developed, such as the Central Business District (CBD) – and Pinetown and Umhlanga. The EM planning documents reviewed indicate spatial planning measures for mitigation. These include the curbing of urban sprawl, compact city development, densification, public transport systems, and brownfield development of former developed land that is no longer in use.(40)
However, there are inconsistencies: urban sprawl needs to be limited and densification intensified, yet commercial and private residential developments are prioritized at the edges of Durban. The focus on edge areas for greenfield developments, such as the area north of Umhlanga for upmarket residential and commercial buildings and Cato Ridge for industry, will increase urban sprawl and is in direct conflict with the plans for urban regeneration of the inner-city CBD. These two opposing strategies are found within the same document.
While there are such conflicts, there are also actions with synergies for development and mitigation. The construction of the Integrated Rapid Public Transport Network (IRPTN), with densification along the network to limit urban sprawl, is an example. However, although the municipality has undertaken the construction of public transport infrastructure, it is expected that the amount of road freight transport will increase due to the expansion of the current port and development of the new port. Additionally, the recommendations of the Academy of Science of South Africa (ASSAf) Low Carbon Report for Durban,(41) including focusing on reducing emissions from heavy trucks, were not considered by the municipality. Furthermore, the results of the EM emissions inventory do not inform city plans and policies, nor are they even mentioned in the IDP. Thus, the emissions inventory has not been used to set targets or identify interventions for emissions reductions and low-carbon development. Moreover, the municipality lacks any spatial representation of climate change impacts, information on areas of high emissions, or potential areas for low-carbon pilot programmes. A limitation is that the key development areas identified are based on strategic development plans that are not necessarily approved or implemented.(42) However, the plans provide an indication of how the city defines itself and the future of its environmental and socioeconomic development.
b. Emissions inventory and spatial analysis
The total emissions calculated by this study for Durban for the year 2013 amounted to 12.22 metric tonnes of carbon dioxide equivalent (MtCO2e), which is less than the EM calculations(43) for the previous years of 27.06 MtCO2e (2010), 27.65 MtCO2e (2011), and 29.36 MtCO2e (2012). This discrepancy is due to the different approach of this study.
The sectoral emissions, however, are similar to those of the municipal inventory and other studies, as road transport fuel use contributed the most to emissions (43 per cent), followed by industry and residential electricity use (Figure 2). There are 790,628 vehicles registered in Durban, with heavy load vehicles making up 5 per cent of the vehicle fleet, yet contributing 43 per cent to total road transport emissions, indicating the influence of logistics and port activities. Light passenger vehicles make up 67 per cent (526,887 vehicles) of the total vehicle fleet, higher than the national level of 55 per cent.(44) This is due to rising affluence and the status associated with private vehicle ownership, as well as the inadequate and unreliable public transport infrastructure, as heavy passenger vehicles contribute only 4 per cent to the total vehicle fleet. Approximately 25,500 heavy passenger vehicles are classified as minibus taxis, which is the most popular mode of public transport available. Electricity consumption from industry and residential use contributed more than half of emissions (55 per cent) in 2013. CO2 is the dominant GHG, represented by approx. 98 per cent of the total emissions. CH4 contributed approx. 2 per cent and N2O contributed 0.11 per cent to total emissions, in keeping with the global, South African and local contributions to total emissions, when compared to CO2.(45)
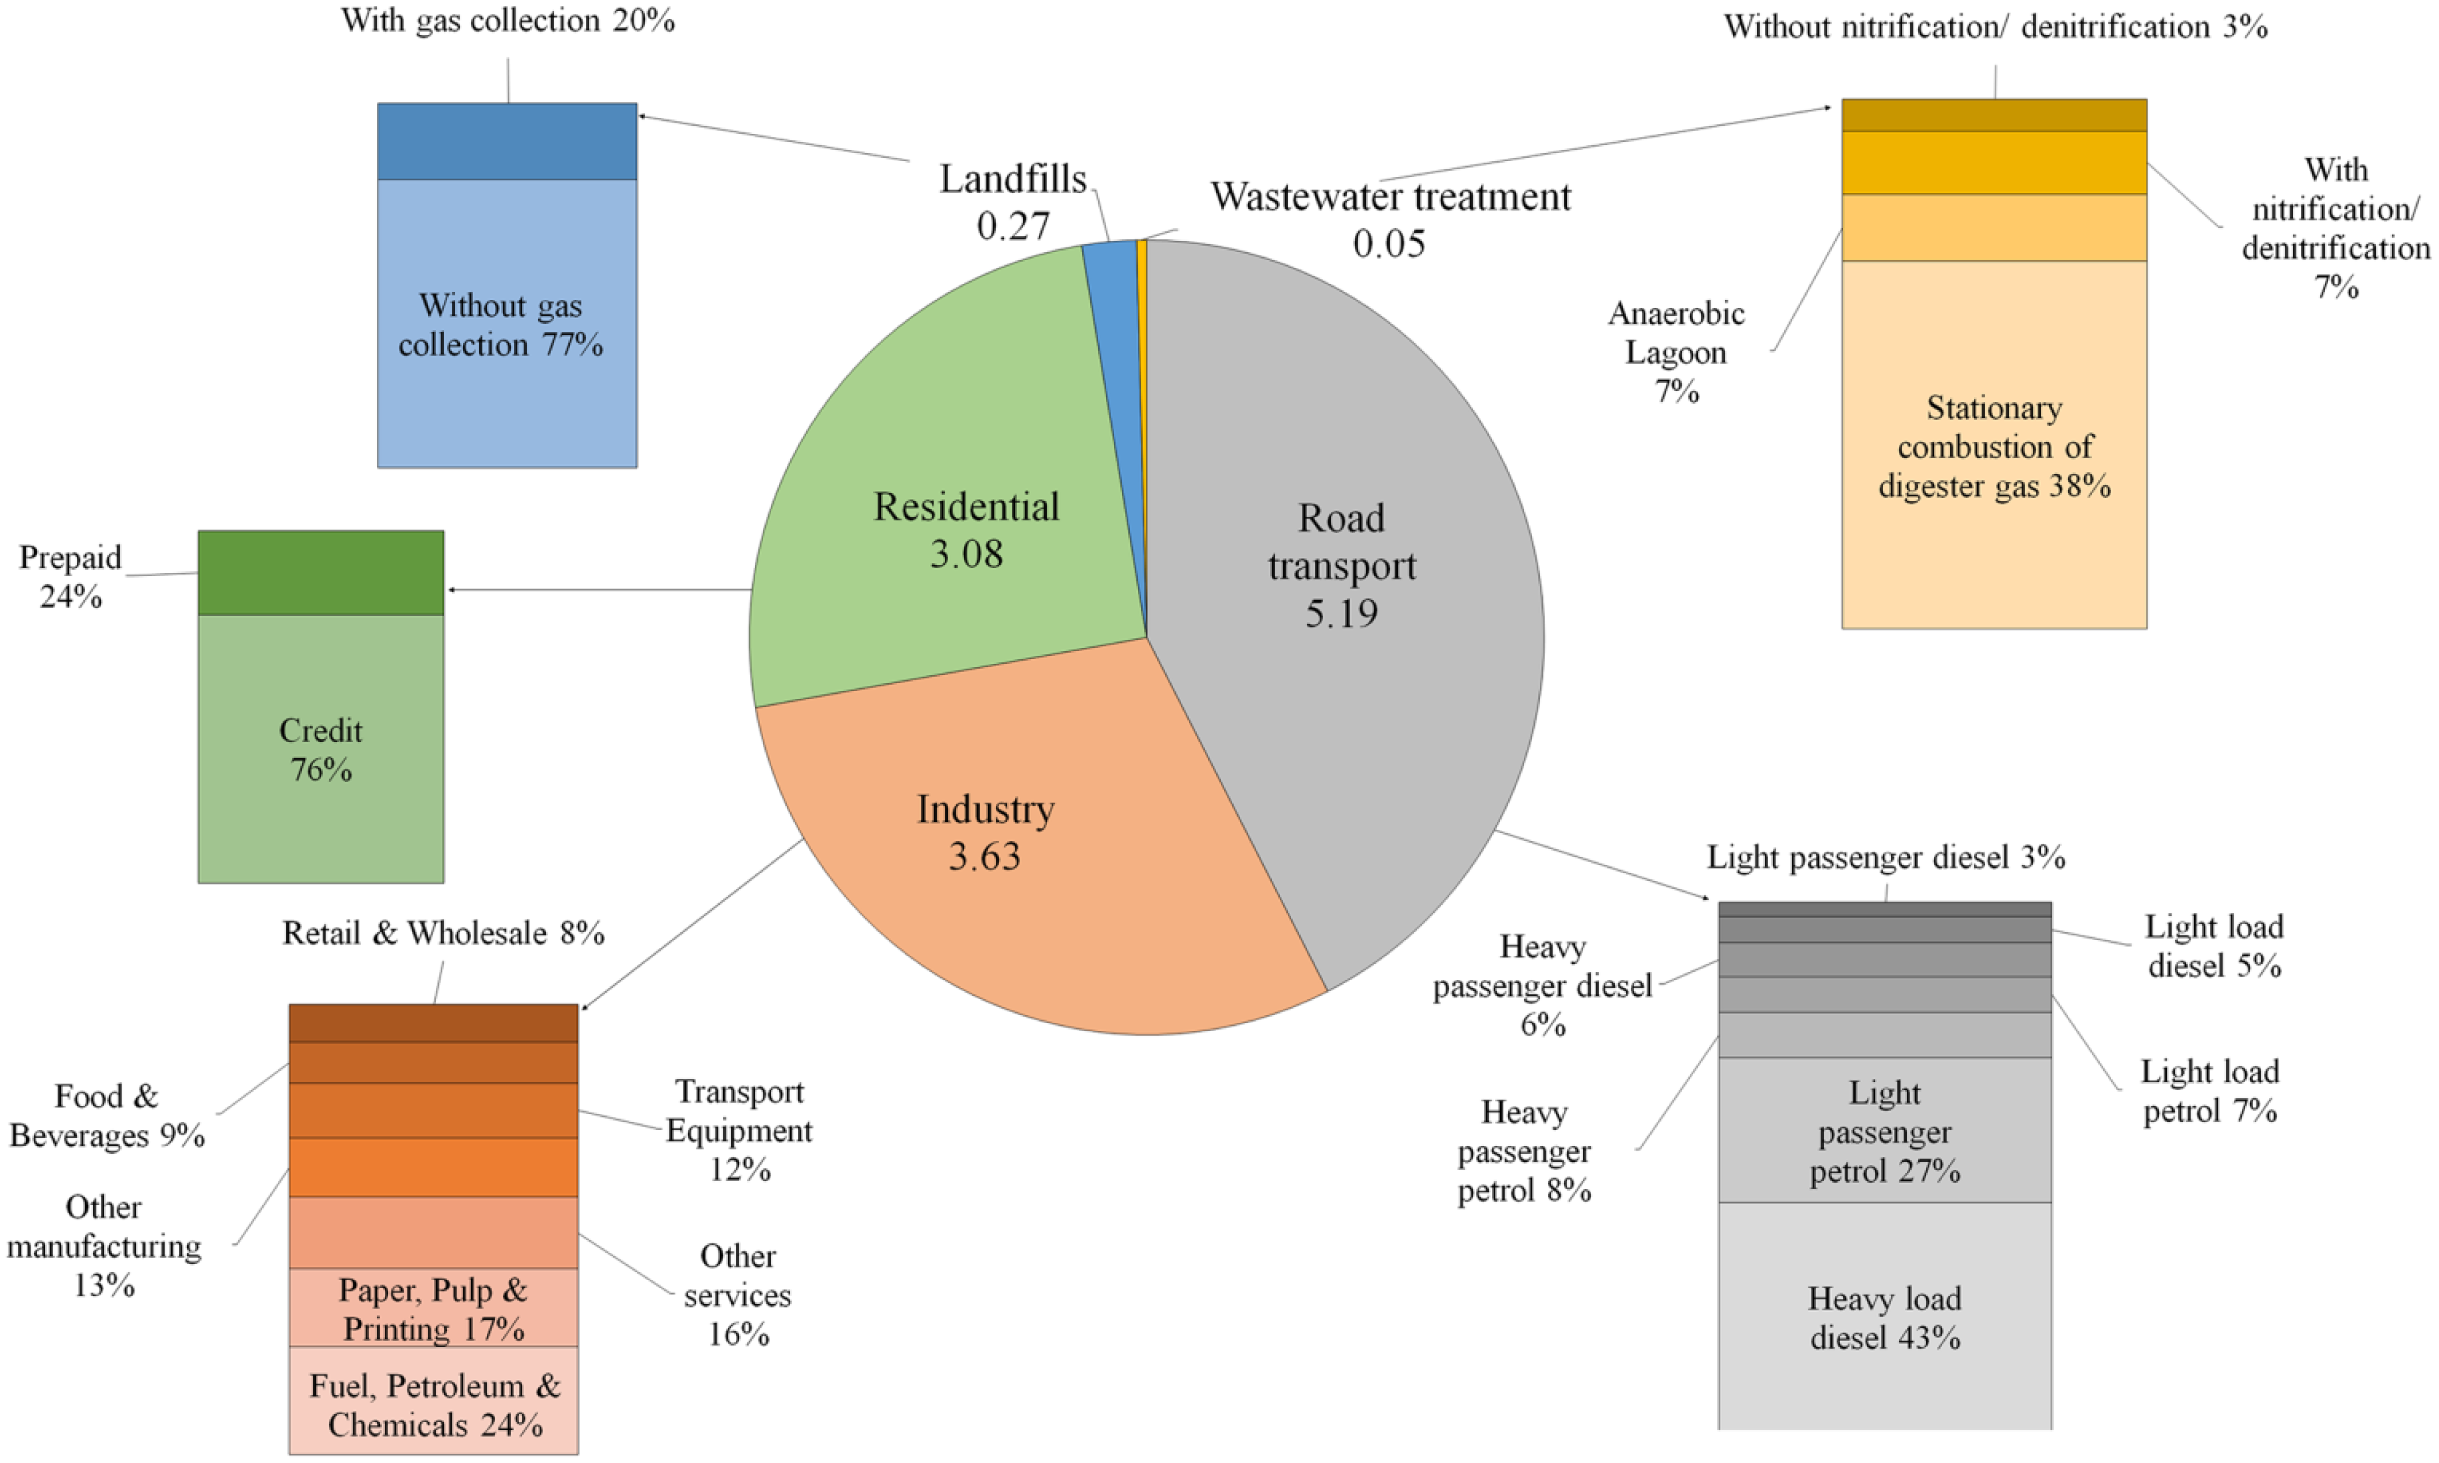
Disaggregation of GHG emissions for the sectors (in MtCO2e) and sub-sectors (in per cent) in eThekwini Municipality for 2013
Durban’s GHG emissions represent approx. 3 per cent of SA’s total GHG emissions (443.41 MtCO2e).(46) International comparisons show that Durban’s total emissions are similar to those of cities in other upper-middle income countries, such as Bogotá (13.22 MtCO2e), and cities in high-income countries, such as Warsaw (12.71 MtCO2e) and Madrid (11.98 MtCO2e).(47) This study’s GHG emissions intensity is 3.43 tCO2e per capita, lower than the national GHG emissions intensity of 9.90 tCO2e per capita.(48) Durban’s GHG emissions intensity is comparable to those of cities in other upper-middle income countries, such as Buenos Aires (3.83 tCO2e per capita) and Amman (3.3 tCO2e per capita), and lower-middle income countries, such as Kolkata (3.29 tCO2e per capita).(49)
The results from this study were compared to sectoral emissions from the official EM community emissions inventories(50) and other studies undertaken for Durban(51) to determine the suitability of the emissions inventory for further analysis. The sectoral emissions calculated for this study matched the findings of similar studies (Figure 3). For the road transport sector, both the EM(52) and Thambiran and Diab(53) recorded higher emissions. These studies used the fuel balance method, which is more suited for the national scale(54) and lacked consideration of the temporal and spatial offsets of fuel sales.(55) This study recorded lower industrial and residential electricity consumption emissions than the EM emissions inventory due to the exclusion of transmission and distribution losses in the emission factor. Similar to this study, Thambiran and Diab(56) accounted for CO2 emissions from industrial electricity use. Friedrich and Trois(57) recorded higher emissions from landfills due to the life cycle approach and methane commitment method, which always results in higher emissions than the first order decay model.(58)
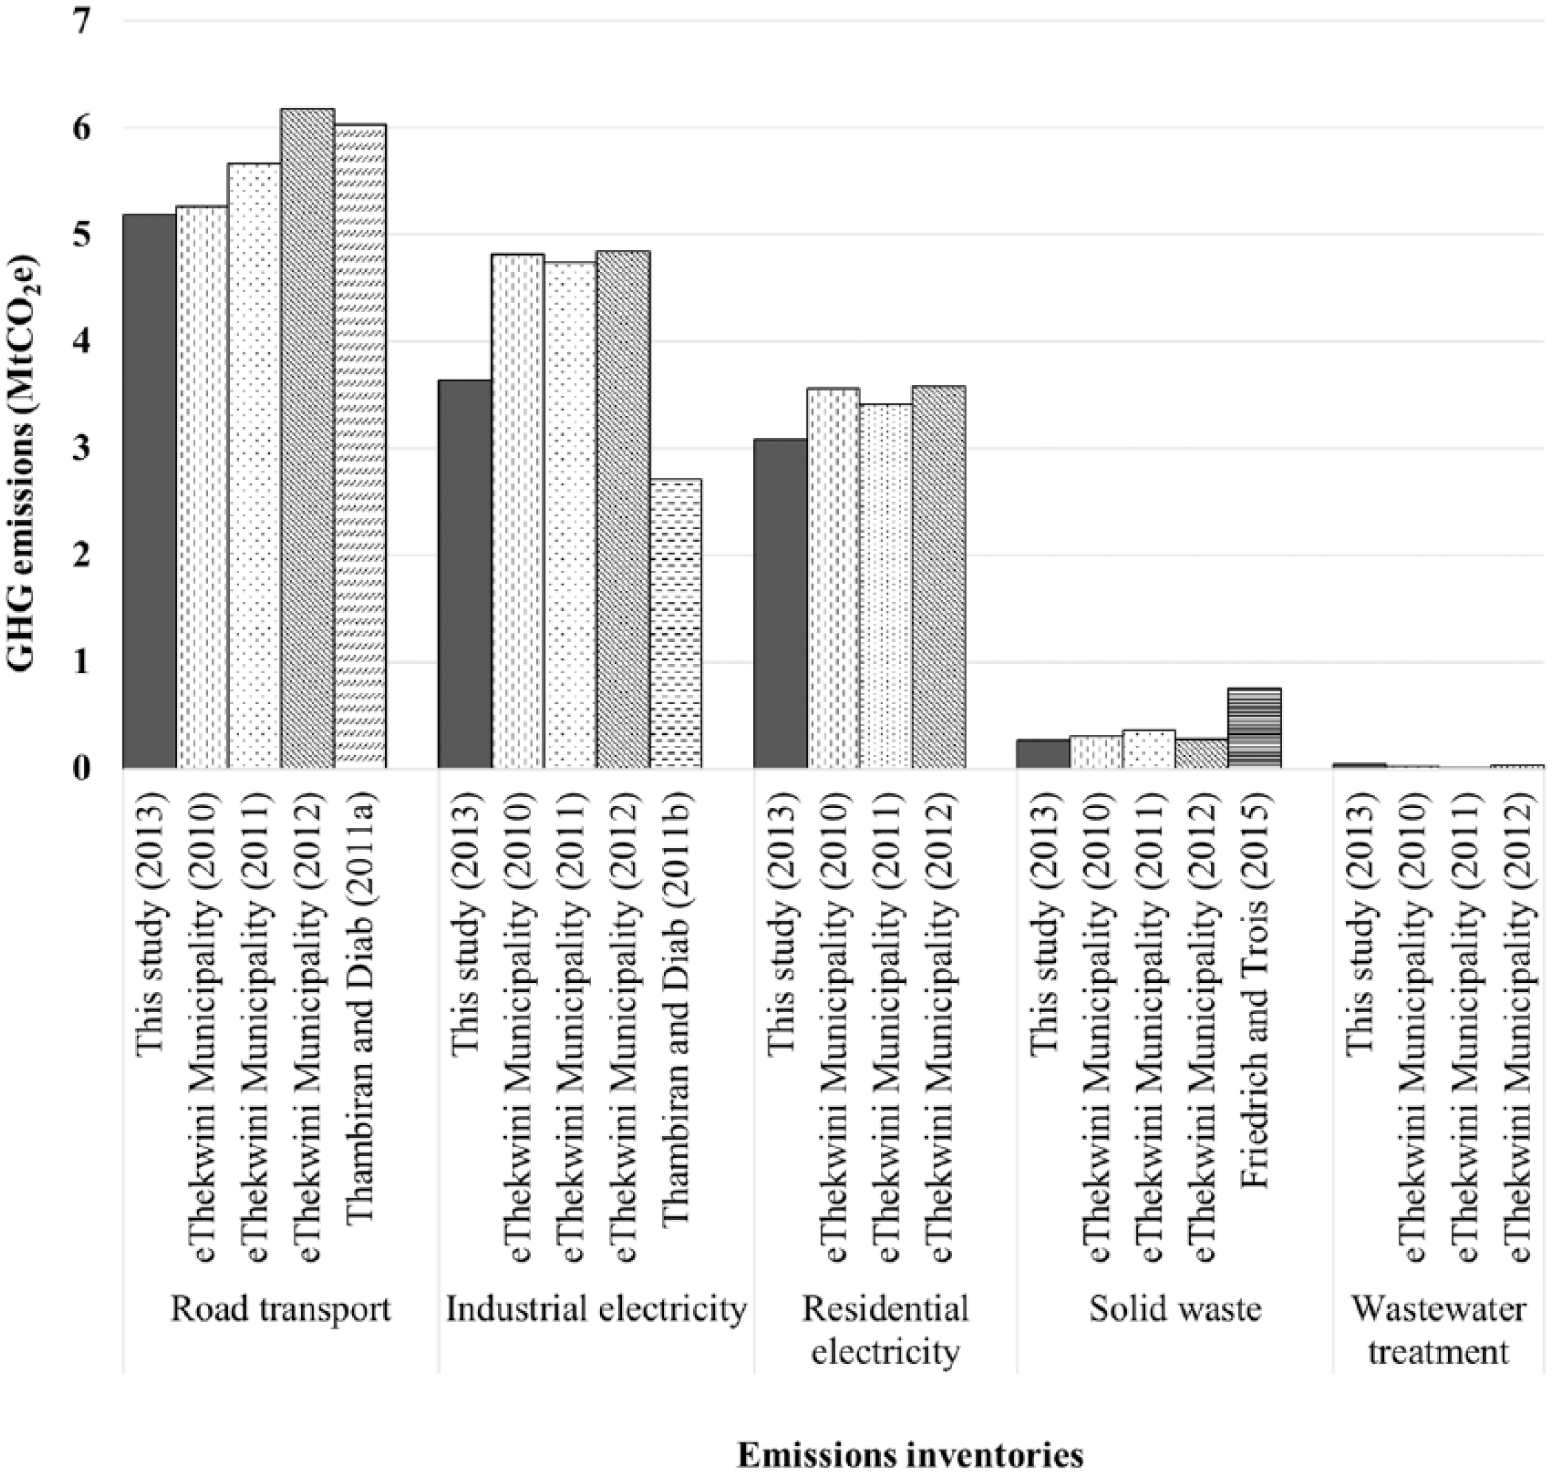
Comparison of this study’s emissions inventory with those of other studies, expressed in MtCO2e
The spatial analysis of emissions reveals significant emissions along the coast, and low emissions from the adjacent hinterlands (Figure 4A). The highest emissions are from the South Durban Industrial Basin (SDIB), specifically from the neighbourhood of Prospecton (767,172 tCO2e), which is approx. 6.5 times more than the Durban ward average (118,632 tCO2e). A spatial trend of high emissions in a zone running parallel along the coast is identified from Umbogintwini in the south through the CBD and the north to Umhlanga. Another spatial trend of lower emissions is identified from east to west, from central Durban to the western edge. The least emissions are from rural areas and the former township areas, with the lowest emissions found in Shangase Ta (9,985 tCO2e), which is 11.9 times less than the Durban average, indicating the spatial disparity in emissions contribution. To further highlight the emissions inequality, out of 103 neighbourhoods, the 10 highest-emitting neighbourhoods (between 287,000 and 767,000 tCO2e) were responsible for 35 per cent of total emissions in 2013, of which 15 per cent was attributed to Prospecton, Merebank and Bluff.
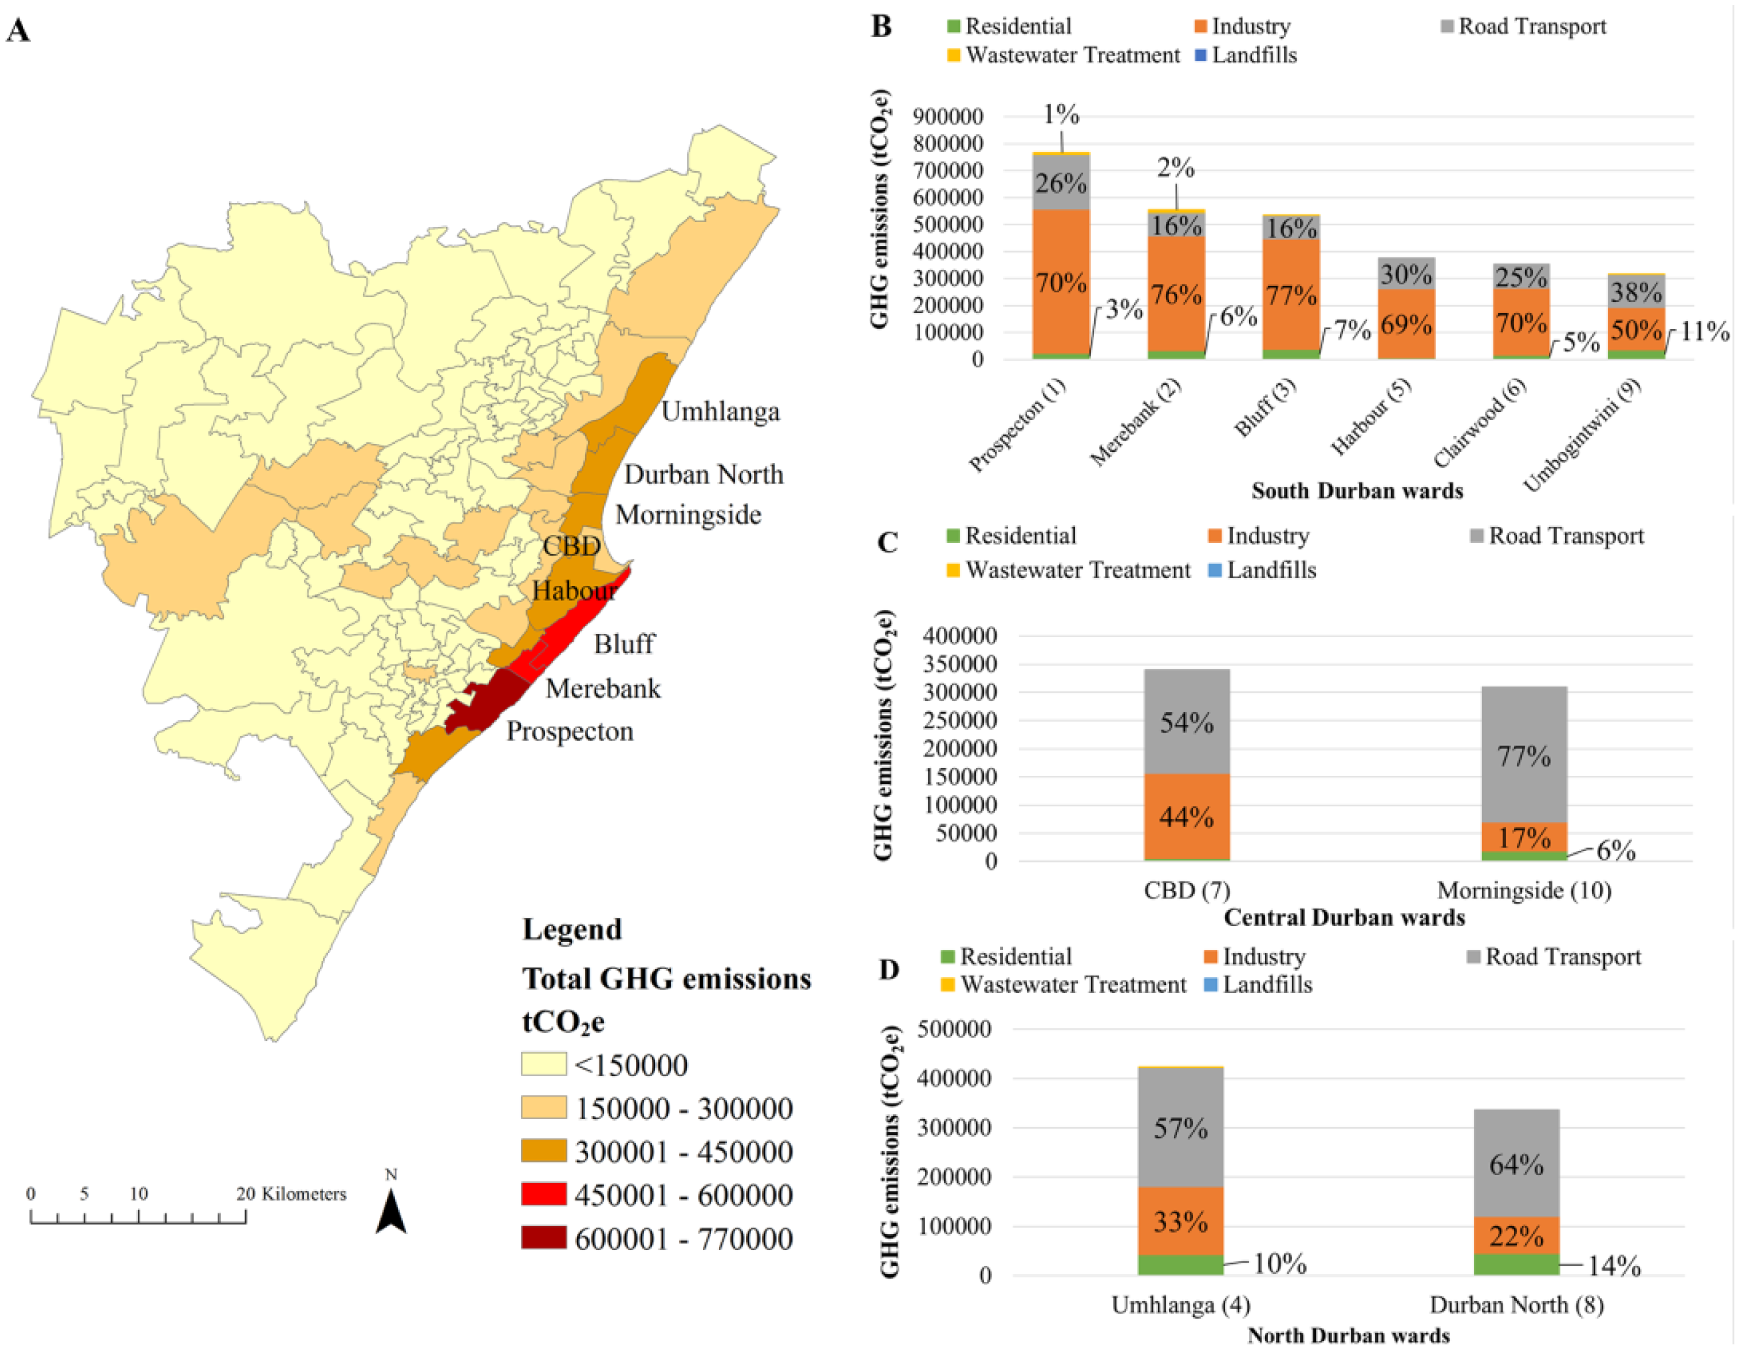
(A) Total GHG emissions in tonnes per CO2 equivalent (tCO2e) in eThekwini Municipality for 2013, and the GHG emissions profiles (in tCO2e) of (B) south Durban, (C) central Durban and (D) north Durban wards for 2013
Emissions indicators measure the GHG intensity of an area, most commonly based on economic performance or population, thus enabling comparison between places.(59) One of the most popular emissions indicators is based on population and expresses GHG emissions per person (capita).(60) Despite the concerns with population indicators,(61) it still remains useful to connect individual behaviour, activities and responsibilities to global greenhouse gas emissions. The intra-neighbourhood comparison of the population’s GHG intensity (tCO2e per capita) is in line with total emissions; thus, the neighbourhoods with the highest emissions are also the highest per capita emitters, and the neighbourhoods with the lowest per capita emissions are the lowest emitters (Table 2).
The 10 Durban neighbourhoods with the highest and lowest GHG emissions per capita
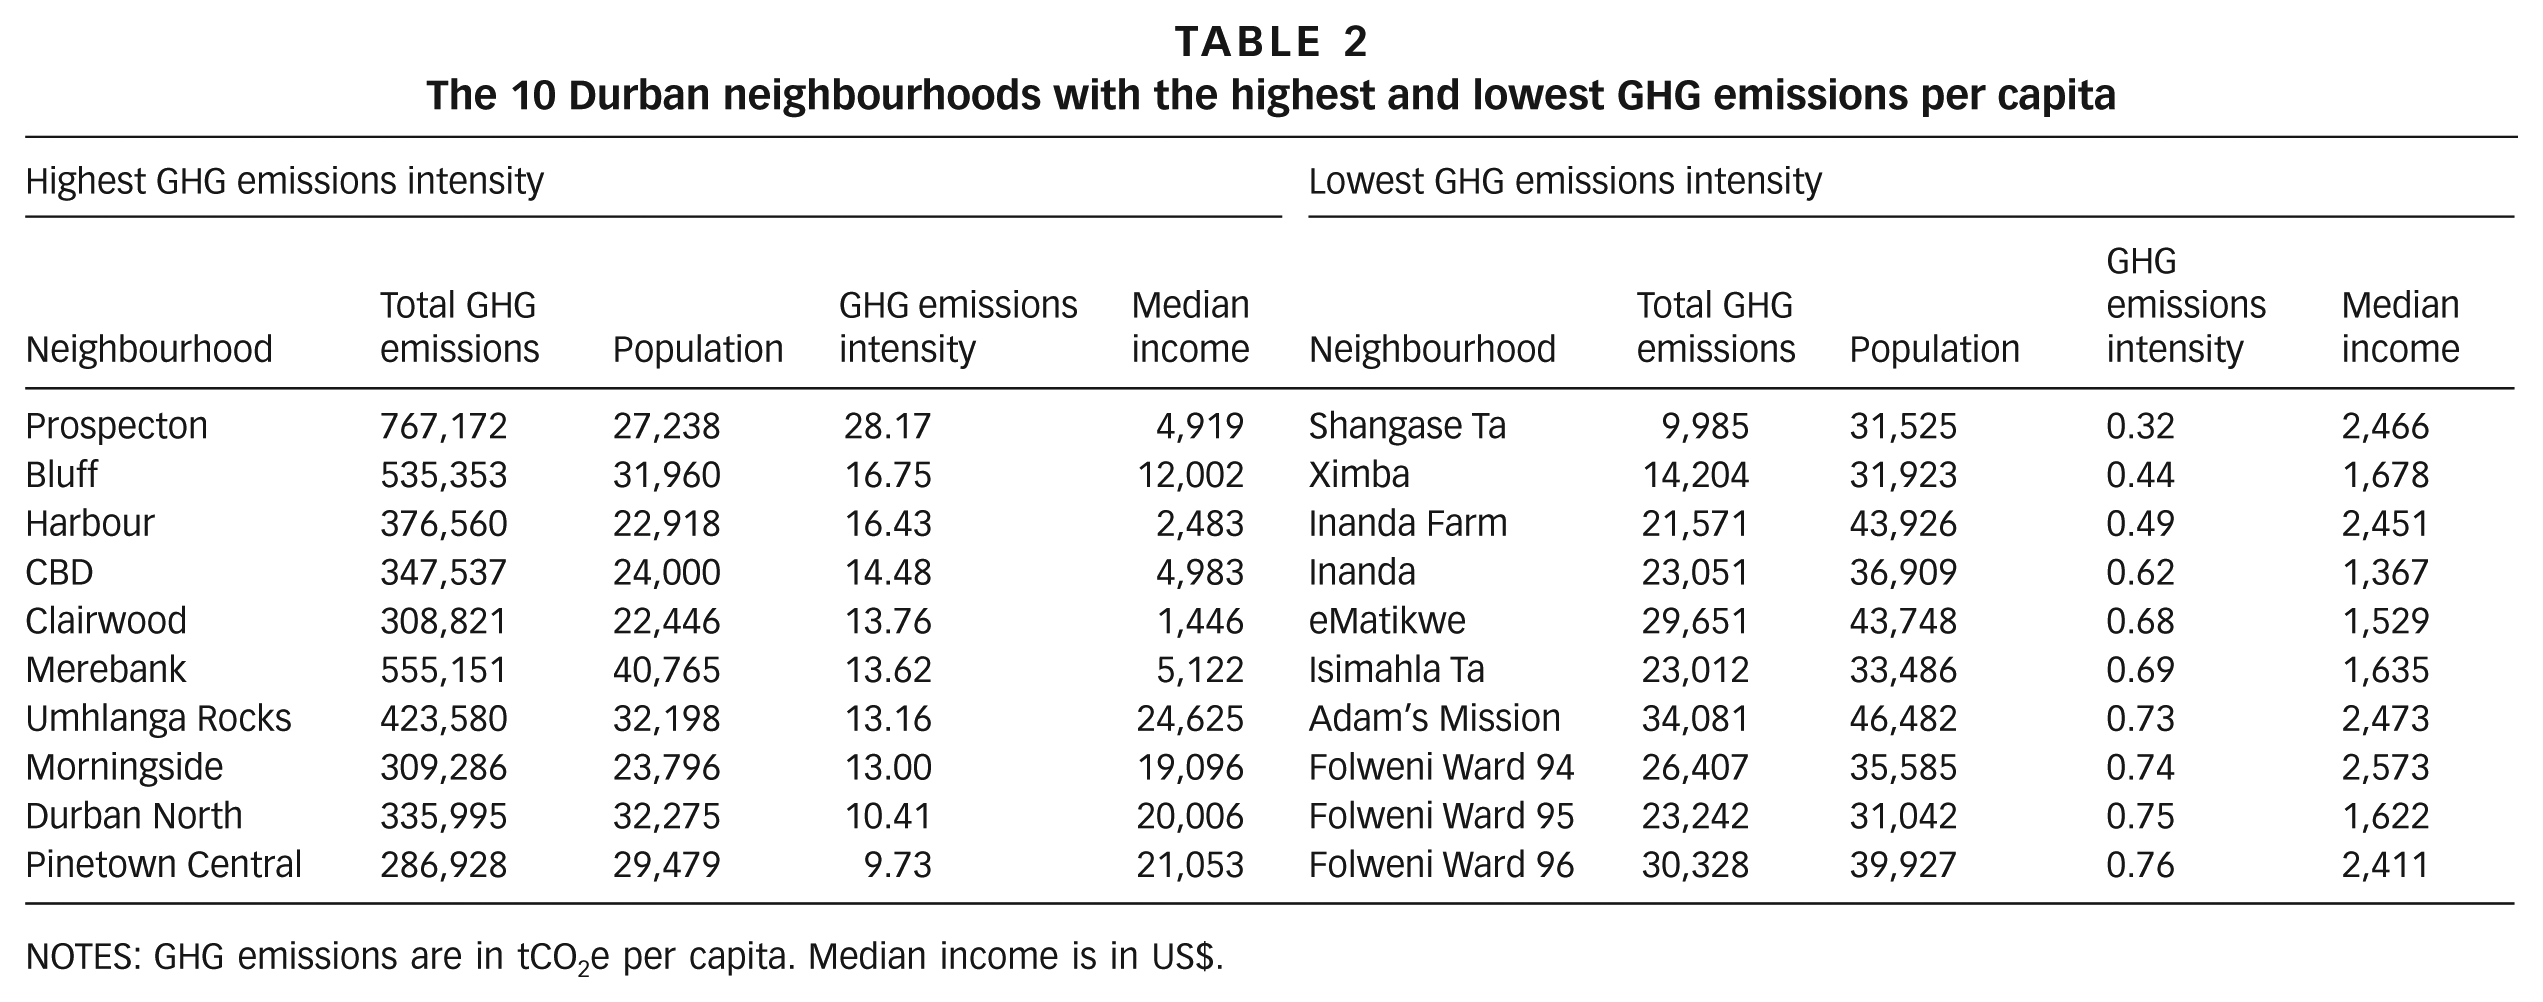
NOTES: GHG emissions are in tCO2e per capita. Median income is in US$.
The results from the spatial analysis and per capita results revealed where the focus of emissions reductions should be aimed. Three high emission zones are discussed: (i) south Durban – from the harbour south along the coast to Umbogintwini, (ii) central Durban, and (iii) north Durban – north of the CBD along the coast to Umhlanga. The GHG emissions profiles of south Durban neighbourhoods show the high contribution of industry emissions from electricity consumption, ranging between 50 and 77 per cent, followed by road transport (Figure 4B). The emissions profile for south Durban is comparable to that of the Singapore metropolitan area, which has similar economic activities such as petroleum and oil refineries, and a shipping industry. In the Singapore metropolitan area, energy emissions (dominated by electricity consumption) from industry, commercial and residential buildings contribute 83 per cent to total emissions, followed by road transport emissions (17 per cent).(62) Central Durban neighbourhoods are characterized by the high contribution of road transport to emissions (Figure 4C). The emissions profile of Morningside shows the high contribution of road transport (77 per cent) to the total ward emissions, due to the large number of petrol and diesel private passenger car owners.(63) The high contribution of road transport emissions to the emissions profile of central Durban is comparable to that of Delhi and São Paulo, where road transport contributes 66 per cent and 51 per cent respectively to total emissions due to cars.(64) The key contributor to emissions for North Durban is road transport in Umhlanga (57 per cent) and Durban North (64 per cent) (Figure 4D). The emissions profiles of Durban North and Umhlanga are comparable to Morningside’s, and internationally to Delhi’s and São Paulo’s due to the dominance of road transport emissions in those cities.(65)
The linking of household annual income and emissions in the highest- and lowest-emitting neighbourhoods (Table 2) reveals a link between low-emitting and low-income wards. These neighbourhoods would be considered “low-carbon”, as their GHG emissions intensities range from 0.32 to 0.76 tCO2e, when compared to the benchmark for low-carbon emissions: Oslo (Norway), with per capita emissions of 2.19 tCO2e.(66) These neighbourhoods, however, are the most deprived in the metropolitan area. For the highest-emitting neighbourhoods, the link between high emissions and high income is confirmed.
However, for the industrialized neighbourhoods, this relationship is complicated. The south Durban neighbourhoods are characterized by low annual household income, but dominate both total and per capita emissions. This is due to the overwhelming contribution of industry emissions, drawing attention to the limitations of emissions intensity indicators, as they do not capture underlying factors. At face value, these emissions are comparable to those of cities in high-income countries, such as the city of Denver (20.12 tCO2e per capita), but these are related to lifestyle emissions.(67) However, south Durban communities are not affluent, do not directly benefit from the electricity consumption of industries, and are exposed to various environmental and health risks due to the proximity to industry.(68) This underlines the impact of structural influence on emissions intensity in SDIB, which should not be attributed to the citizens in those neighbourhoods, due to the concentration of industries. When the emissions from industrial electricity consumption are excluded from the emissions intensity calculation, the new GHG emissions intensity of Prospecton is 8.49 tCO2e per capita, due to fuel consumption emissions from freight vehicles. The emissions intensity of other south Durban neighbourhoods also decreases, to 3.90 tCO2e per capita for Bluff and 3.21 tCO2e per capita for Merebank, closer to the study’s average. Morningside then becomes the most emissions-intense ward, with 10.83 tCO2e per capita, followed by Umhlanga (8.88 tCO2e per capita) and Durban North (8.07 tCO2e per capita), which are still comparable to cities in the USA and Canada, such as New York (7.96 tCO2e per capita), Seattle (11.47 tCO2e per capita) and Toronto (8.81 tCO2e per capita).(69)
c. Discussion – emissions and development inequalities
The areas of high neighbourhood and per capita emissions are attributed to historical city growth trends from the port and the infrastructural developments along the two national roads.(70) The three high emission zones, however, present widely varying contexts that need to be recognized. The historical development of the high emission areas is summarized below to understand the context and possible drivers of the emissions and to identify the patterns of structural advantages and disadvantages. This is to explore the level at which emissions reductions can support addressing social inequalities inherited as a function of planning practices during the apartheid era and likely to be exacerbated by future planned developments.(71)
The SDIB is the second largest industrial hub in SA, and was previously prioritized for heavy industrial development of national significance due to its proximity to the port and the availability of cheap labour from the surrounding marginalized communities.(72) Presently, there are stricter air pollution laws and management to improve air quality, yet the SDIB remains an air pollution hotspot, and as such its pollution reduction is still strongly championed by active civil society groups in the area.(73) A major future development in South Durban is the Durban Dig-Out Port, which is a National Development Plan (NDP) Strategic Infrastructure Project (SIP) to increase port capacity eight-fold and expand the petrochemical and transport manufacturing sectors,(74) which already consume more energy than any other economic sector in Durban. The shared location of residences and industries is a result of the past socio-spatial planning inequalities, and the current development plans for industrial expansion further burdens communities in south Durban. With economic development as the sole focus, the structural inequalities may persist even as the economic benefits accrue to the surrounding communities, and elsewhere in the city and country. However, the burdens of localized air pollution and health impacts will be experienced by these communities.
Central Durban experienced urban degradation imposed by the apartheid local government. The low contribution of residential energy consumption to the central Durban emissions profile is consistent with international studies.(75) The large contribution of road transport (54 per cent) is due to urban sprawl. The CBD hosts Warwick Junction, which is a major transport node and the main gateway into the city for commuters.(76) The road transport emissions are a legacy of socio-spatial planning inequalities that resulted in people living far from places of work. A consequence of these structural inequalities is that people cannot cycle or walk to work, and have to resort to using cars or minibus taxis. However, a major project of the municipality and an NDP SIP is the urban regeneration of the inner city, and transport network upgrades specific to Warwick Junction. This is a window of opportunity for integrating mitigation and development to reduce emissions from road transport and redress the inefficient socio-spatial planning of the past.
The north Durban neighbourhoods are structurally advantaged, as Umhlanga and Durban North have always been high-income, low-density residential suburbs, associated with tourism.(77) The industry emissions are related to the tertiary sectors of retail and commercial office parks and corporate headquarters. This area has the highest residential electricity emissions of the three zones. The high private car ownership rates and residential electricity consumption emissions are due to the affluent lifestyles of the inhabitants. This finding is key, as the current discourse on climate change distributive justice lacks a consideration of the GHG emissions from the affluent in the global South,(78) especially when the strict discrepancies between high-income and low-income countries are disappearing and the focus is increasingly on addressing climate change according to individual responsibilities, capabilities and resources. The development and expansion of Umhlanga is the direct consequence of the urban decay of the CBD, due to poor socio-spatial planning in the past, and the current conflict between municipal plans to regenerate the CBD and the private developers that dominate land ownership.
Climate justice not only entails responsibilities for emissions, or burden sharing, but also includes the right to benefit and the sharing of benefits. In central Durban, opportunities for mitigation and development are clear, with transport identified as the key contributor to emissions. The municipal and national plans are both in sync with redressing the past planning inequalities and focusing on road transport in this neighbourhood. The benefits of a renewed CBD and a sustainable transport network may be enjoyed citywide in the form of reduced emissions and a safe and inclusive city.
In south Durban, the industries that are responsible for the highest emissions are expected to expand. National and local government plans are aligned for economic development, but at the expense of residents in that area. While this may create employment and entrepreneurship opportunities for residents, greater economic benefits will be experienced in other parts of the city and the country in the form of more fuel and freight movement. The expected expansion of industry and increases in the number of heavy load trucks will decrease air quality, if the current context of an inefficient air pollution monitoring network and weak implementation of air pollution regulations and standards remains. This will further entrench the structural inequalities in these neighbourhoods. In Umhlanga, the conflict between the municipality and private developers is expected to embed the structural advantage of local residents, as many current and future developments are upmarket gated residential housing estates, commercial and retail, and tourist facilities, which are expected to increase affluence and emissions.
V. Recommendations
The EM policies advocate climate change mitigation strategies, yet the majority of developmental decisions planned are solely for economic development, mandated by national government and undertaken by private developers, in conflict with municipal plans. The mitigation strategies that are currently implemented are small scale, and focused on reducing emissions from the small contributors, such as landfill sites,(79) thus making minimal progress. Community projects, such as reforestation initiatives, are implemented by the municipality. However, these projects are for poor, rural township communities to decouple their emissions growth from development. Although these projects are useful for income generation, such as the Buffelsdraai Community Reforestation Project,(80) and are part of the green economy targets, there are no similar initiatives or responsibilities for industries and affluent communities to reduce their emissions, despite the fact that they are the major contributors to emissions. This is possibly due to the lack of a legal mandate in the city to enable climate change action; thus mitigation initiatives are voluntary. This situation is similar to that found by other studies, which indicate that the local-scale emissions reductions are limited by macro-economic and structural factors, as local government often does not have control over key infrastructure.(81) Therefore, strong strategic planning and multi-level governance in developmental decisions and consideration of mitigation implications are required.
a. Low emission zones (LEZs)
To achieve significant emissions reductions, the most emitting activities need to be reduced. The lack of resources to focus on reducing emissions from all activities adds motivation for identifying the most emitting activities. The results from the emissions profiles of the most emitting neighbourhoods revealed various sectoral contributions, meaning that the mitigation strategies should also vary. The UK Department for Environment, Food & Rural Affairs (DEFRA) emphasized identifying the spatial location of emissions to determine low emission zones (LEZs). LEZs are the geographic area where the low emission strategy – which is a broad package of measures to mitigate the impacts of development and complement other mitigation options, such as planning and infrastructure – is applied.(82) The concept of LEZs has typically been used in identifying areas that require interventions to reduce air pollution. In this study this concept has been applied to reflect the spatial allocation of GHG emissions to inform planning. Even within this corridor, we need to look at context – site-specific mitigation related to the different emissions profiles.
South Durban neighbourhoods are characterized by industries that are the high electricity consumers. Therefore, the mitigation strategies recommended focus on upgrading the manufacturing structure and employing improved and cleaner production. Other industries in the same neighbourhood, such as the concentration of chemical and petrochemical manufacturing, must adopt on-site renewable energy generation,(83) and other technological options for energy efficiency and decarbonization, as reviewed by Napp and others.(84) However, what is vital to the uptake of such technologies and strategies is municipal planning and policies that encourage the development of low-carbon industries. The compulsory monitoring and reporting of industry GHG emissions, and restriction of energy-intensive industries and those industries that do not have mitigation strategies, are also key. This is particularly relevant, as reducing electricity consumption is an integral component of the national mitigation strategy.(85) Another mitigation action investigated by national government is carbon offsets, or external projects undertaken by a firm to avoid, reduce or sequester CO2. These measures may be more cost effective than an investment in the firm’s own operations, with developmental co-benefits that are recommended by the National Treasury.(86) It is recommended that manufacturing industries in South Durban undertake carbon offset projects in renewable energy generation, ecosystem rehabilitation, and food security in the rural periphery, which are also the least emitting areas in the city, thereby ensuring that the development of those areas is not associated with increasing emissions.
In contrast to south Durban, in central and north Durban the road transport sector is the highest contributor to emissions that should be prioritized for mitigation. The specific focus should be on minibus taxis and private passenger cars in central Durban and private passenger cars in north Durban. Studies on road transport emissions in SA(87) recommend a modal shift from private to public transport and the reduction of both vehicle mileage and population, applicable to both minibus taxis (due to high mileage) and private passenger cars (due to the large vehicle population). Furthermore, the EM should implement vehicle restrictions and limits on specific major roads to create low emission zones – for example, the restriction of cars on major roads to encourage the uptake of public transport, walking or cycling. This strategy aligns with the national mitigation potential analysis, which indicates that the successful implementation and effectiveness of mitigation actions from the road transport sector are site-specific.(88) Therefore the role of local government is vital to ensure uptake of public transport, such as the IRPTN, as central and north Durban neighbourhoods are strategic corridors in the network. The successful uptake of mass transit is vital for emissions mitigation, sustainability and social cohesiveness, especially in developing cities, due to increasing populations and limited space for transport infrastructure.(89) These socioeconomic and physical factors are particularly relevant in the EM, as the inequalities in emitting activities are evident and spatial planning is limited by bisected topography and green spaces.
Another pertinent issue is reducing electricity consumption from households in Umhlanga and Durban North. The EM also needs to encourage residents in these areas to install photovoltaic installations on roofs, especially as these residents can afford this technology. Furthermore, socioeconomic transformation is required to move away from a luxurious to a sustainable lifestyle, to reduce energy and waste emissions. This is especially applicable to affluent neighbourhoods, as the evidence provided supports the argument that the rights and responsibilities of the affluent in the global South should differ from those of the rest in their locations.(90) The EM needs to place more emphasis, with encouragement and incentives, on low-carbon lifestyles.
There are two major concerns regarding the mitigation strategies proposed. First, emissions reduction strategies require large amounts of capital investment, which is difficult to obtain from either local government or external funding. Secondly, the loss of economic activity and the combination of various stakeholder interests are often presented as barriers to the consideration or implementation of mitigation strategies due to short-term and competing priorities.(91) However, Napp and colleagues(92) suggested that the barriers to adopting improvements for energy efficiency are often organizational, or knowledge-related, rather than financial, given that improvements are inexpensive or cost-saving in the long term. Thambiran and Diab(93) showed the financial and air quality benefits of reducing electricity consumption in SDIB industries and also suggested that industries undertaking GHG mitigation interventions be credited for being industry leaders. Furthermore, the municipality is already planning for and investing in large-scale infrastructural and planning projects. Thus, future emissions need to be accounted for, and this study can serve as a useful starting point. The IDP is a vital document that should be integral to mainstreaming climate change issues in the municipal function and policies,(94) as it integrates developmental issues from national, provincial and local governments, and includes neighbourhood participation. Thus, identifying high-emitting areas and emissions profiles of neighbourhoods can be integrated into the annual IDP review to track progress towards simultaneously addressing emissions reductions and development goals for low-carbon spatial planning.
b. Multi-level governance for mitigation
Local emissions reductions may be limited due to structural actions that are not controlled by local government, thus suggesting the misalignment of international, national, provincial and local policies. However, the Paris Agreement has opened the way for the redirection of investments to low-carbon and climate-resilient development and the increased recognition of cities in the international climate change discourse.(95) The emissions profiles at the neighbourhood scale reveal the main contributors to emissions, and therefore what can be implemented at what scale.It is thus recommended that a multi-level governance approach be undertaken. First, there needs to be direction from national government on emissions reduction targets and activities. It is hoped that the soon-to-be-implemented carbon tax will encourage deep emissions cuts. This regulatory approach from national government is needed specifically for industries, and this is key for energy efficiency and emissions reductions. This mechanism, and the associated monitoring and evaluation, would be key in the south Durban emission zone.
Second, although cities do not have control over key infrastructure, there is one type of infrastructure that cities can control: their transport network, such as the IRPTN that Durban is currently constructing to make public transport more integrated and accessible. The emissions profiles of the neighbourhoods along the public transport corridors can be used as a baseline to evaluate the use and emissions reductions of the IRPTN.Third, the emissions profile at a neighbourhood scale can enable communication on emissions reduction strategies between the communities and the municipality, which is vital as the current justice discourse on mitigation initiatives at the city scale is targeted at communities and individuals within the city.(96) For example, in the case of solar panels on rooftops, this technology has the potential to be taken up more by affluent households than by the urban poor.(97) The framing of mitigation strategies needs to be targeted at affluent homeowners; the strategy can be individual. For the urban poor, by contrast, in the absence of secure home ownership and in the context of municipal housing backlogs, the provision of clean and sustainable energy needs to be collective. Representatives of specific economic activities, such as management and business leaders, need to be responsible for the emissions from their organizations’ operations, and to engage local universities and research institutions to investigate emissions reductions.
There is a need for caution around over-emphasizing the role of communities, so that responsibilities that should be met by government do not burden communities. The local framing of GHG emissions and their sources can increase community awareness and engagement towards a goal,(98) in this case both emissions reductions and the relevant development issues, which can be supported by such stakeholders as business leaders, non-governmental organizations or local universities. This study is the first step in identifying the neighbourhoods that can be the focus of communication among the municipality, communities, industries, researchers and other relevant stakeholders to run pilot programmes on emissions reductions with developmental benefits.
VI. Conclusions and way Forward
The aim of this study was to explore the spatial distribution of anthropogenic GHGs at the neighbourhood scale, such that efforts to reduce emissions can also address development gaps for low-carbon spatial planning. The emissions profiles generated at this scale were used as the foundation for exploring the integration of mitigation into municipal developmental planning. The emissions profiles from Durban highlighted the developmental and emissions disparities in the city. Particular groups and economic activities are especially responsible for emissions, and socio-spatial development and emissions inequalities are found both within the city (high emission zone vs. rural periphery) and within the high emission zone (structurally advantaged vs. structurally disadvantaged). The urgent need for industries and the affluent residents to make emissions cuts is further emphasized by these findings. The high contribution of road transport emissions makes the current construction of the public transport network, and its success, a key emissions reduction action for the city, as it can also redress past socio-spatial inequalities.
Although not extensive and comprehensive, this research was the first attempt to identify the main local contributors to global emissions, so that place-based mitigation strategies can be implemented to achieve significant emissions reductions. Future sectoral studies and improved data availability and access can improve determination of emissions. The main challenges and limitations are related to activity data collection and emission factors. The activity databases lacked meta-data as they were collected from existing sources and governmental agencies. The following additional research is recommended to improve emissions inventories and their wide-scale use: detailed sector-specific studies, in-depth and bottom-up studies within neighbourhoods to capture variations, and studies on the lifestyles of affluent communities and their contribution to emissions. By accounting for emissions from the consumption perspective, focusing on spatial attribution within the city, and considering past injustices, mitigation action from a development planning perspective can be advanced, taking cognizance of socioeconomic and spatial inequalities.
Footnotes
Acknowledgements
The authors would like to thank the two anonymous reviewers for constructive feedback, and to thank Michael Gebreslasie for comments. We also acknowledge the funding from the National Research Foundation through the Innovation MSc Bursary awarded to Meryl Jagarnath.
5.
7.
IPCC (2014).
10.
12.
13.
Bulkeley et al. (2014); IPCC (2014) Anguelovski et al. (2016); Chu (2016); ![]() .
.
15.
17.
20.
Bastianoni (2004); Peters and Hertwich (2008); Dhakal (2010); Paloheimo and Salmi; ![]() .
.
22.
31.
45.
49.
68.
73.
77.
Ahmed (2008); ![]() .
.
81.
82.
DEFRA (2010b).
94.
Nel (2011); ![]() .
.