
Abstract
This paper explores the daily risks of households with respect to dimensions of inadequate water access and supply (quality, quantity, continuity and affordability). We describe how perceptions of risk are shaped and how households seek to reduce possible health impacts and potential economic losses through aversion behaviours. To this end, households’ activities relating to water storage, treatment and usage, together with water source preference, were analysed using a qualitative approach. We developed a framework that describes actual risk, risk perceptions and aversion behaviours. Risk perceptions and the adoption of aversion behaviours of varying frequency and intensity are based on a complex interaction between personal and shared experiences that relate to water supply dimensions, socioeconomic characteristics, and social networking. Moreover, we discuss household risk management strategies and provide some recommendations aimed at improving future approaches to the study of aversion behaviours.
Keywords
I. Introduction
How do risk beliefs and perceptions relating to the possibility of loss and damage(1) emerge? How do people operationalize these on a daily basis? This paper attempts to answer these questions by examining how households seek to cope with poor water supply. Inadequate water supply remains one of the foremost problems in many low- and lower-middle income countries. Measures of water supply adequacy are comprised of the different aspects of water provision: physical access, quality, quantity, continuity and affordability.(2) These are called “the dimensions of access”.(3) The lack of access to an adequate water supply for basic needs, along any of these dimensions, exposes households to risks of preventable illness and impoverishment.(4)
Drinking water supply in low- and lower-middle income countries frequently does not meet the requirements of physical access, quality, quantity, continuity and affordability.(5) The lack (or absence) of an adequate centralized water supply inevitably shifts the responsibility for obtaining a safe and reliable supply to households.(6) Inadequacies relating to the dimensions of access may lead to a variety of strategies employed by households.(7) Boiling, filtration, chlorine application, and ultraviolet (UV) disinfection are considered appropriate treatment methods for improving water quality.(8) The storage of water within households is also a common practice when water is not directly delivered or if water flow is not guaranteed.(9) The unreliable provision of piped water can also force households to construct capital-intensive storage tanks that provide reserves of tap water or rainwater.(10) When no other option is available, buying water from small-scale enterprises becomes a last resort for those desperately in need of a clean water supply.(11) This is evident in data from low- to middle-income countries. For example, in Indonesia, 40 per cent of urban dwellers buy water.(12)
The relationships between inadequacy relating to the dimensions of access and household strategies are often presented in the literature as “aversion behaviours”.(13) Although research has established a clear relationship between aversion behaviours and perceived health risk, how households decide among different aversion behaviours is understudied. Studies that link aversion behaviours with other dimensions of access (physical access, quantity, continuity, and affordability) are also limited.(14) Um and colleagues have described how aversion to unsafe drinking water emerges at the end of a generic process that is comprised of three steps:(15)
Households are exposed to a water supply that is perceived to contain a high level of contaminants that may endanger health;
Household perceptions lead to non-action or to a selection of actions that may reduce the perceived risks;
Households decide on the level of action required to obtain an acceptable level of risk.
One study examining the risk of arsenic exposure concluded that risk beliefs are socially constructed, as a result of everyday interactions, personal experience, local knowledge, and social networking.(16) However, similar studies on a broader scope of dimensions of access are scarce. It remains unclear exactly how perceptions emerge, and how (and why) these perceptions result in decisions that lead to particular behaviours to avert risk and loss.
This study aims to define how households perceive and seek to reduce risks through aversion behaviours in response to poor water supply in a peri-urban area of Bandung City, Indonesia. We employed a qualitative analysis approach by examining in depth how households choose between different aversion behaviours in response to poor dimensions of access to water.
In Section II, we provide background information on the study area, Ujungberung District. Section III explains the methods used in the study, Section IV describes the households interviewed, and Section V covers the water sources available to those households. Section VI then presents the results of our analysis of aversion behaviours, followed in Section VII by a framework describing the relationship among dimensions of access, actual and perceived risks, and aversion behaviours. Finally, in Section VIII we conclude that risk perceptions and decisions relating to the adoption of certain aversion behaviours result from a complex interaction of the different dimensions of access to water, personal and shared experiences, socioeconomic attributes, and social networking. We also provide recommendations aimed at improving future approaches to the study of aversion behaviours and household risk management.
II. Ujungberung District
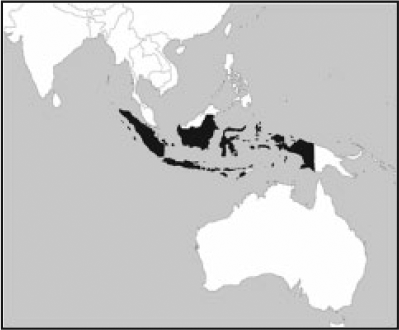
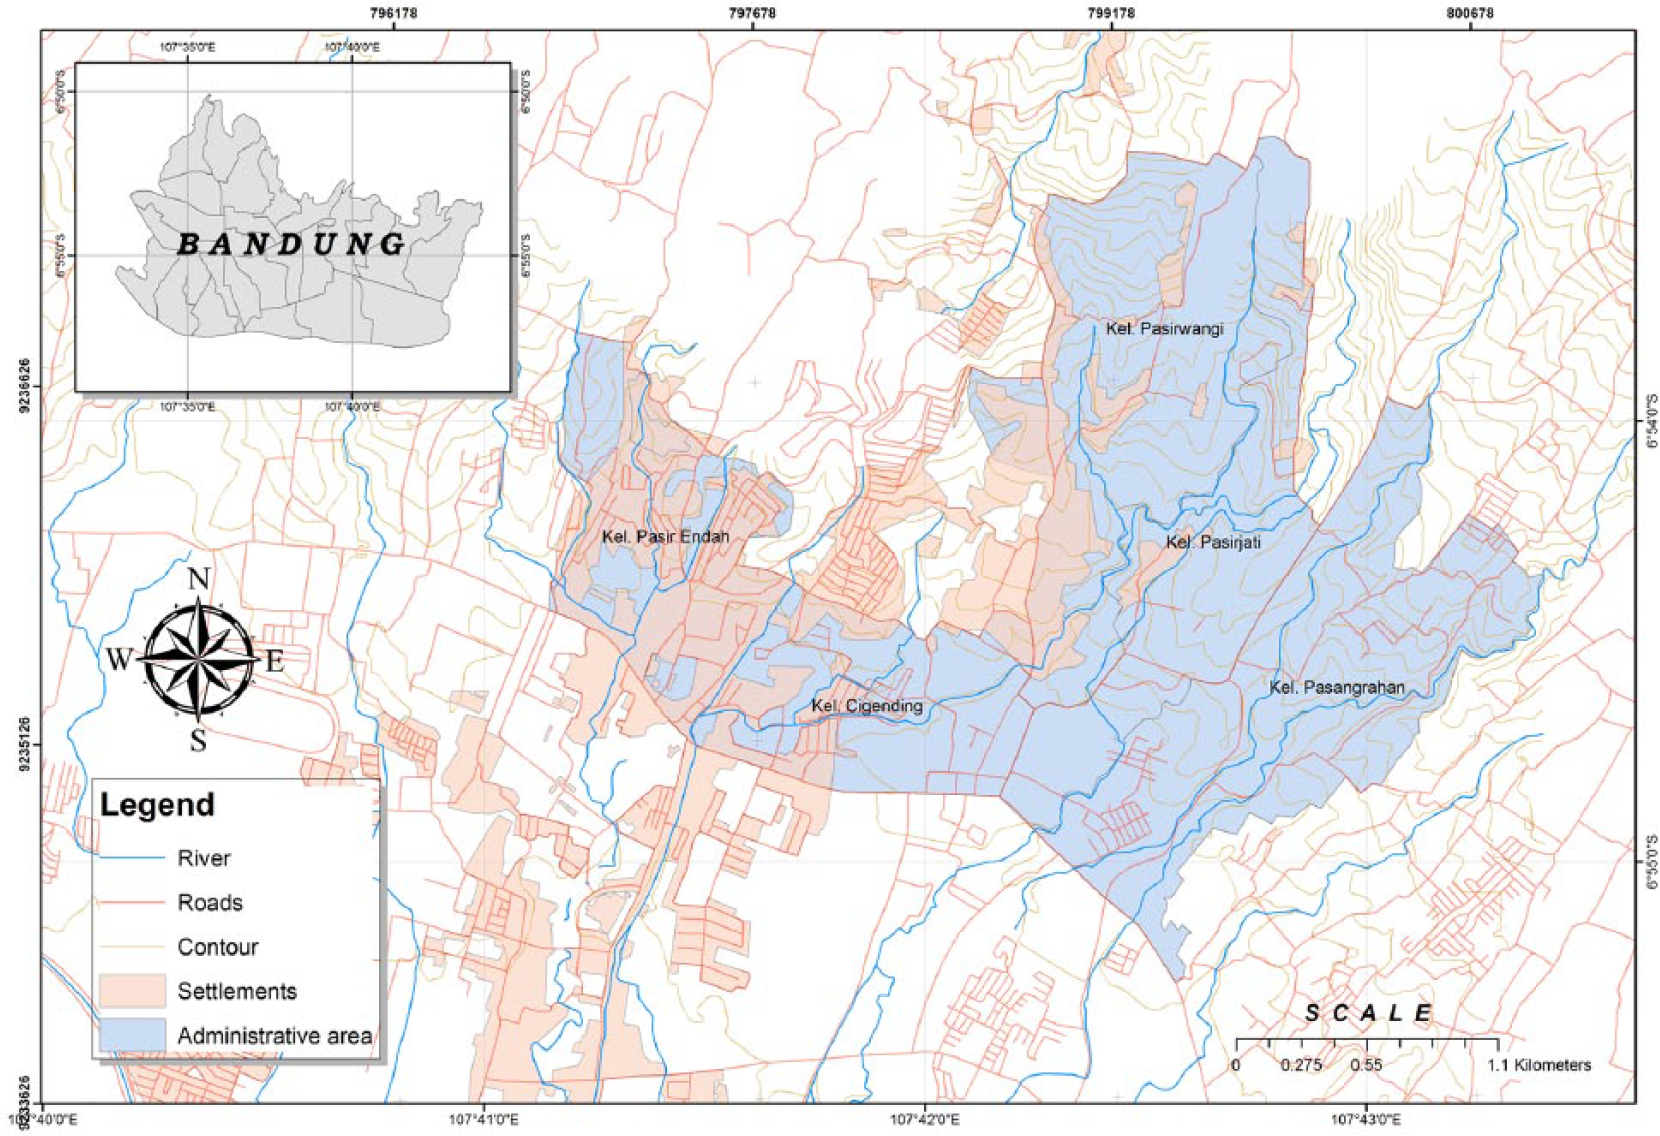
Our study focuses on households in Ujungberung District, part of Bandung City, Indonesia (Map 1). This district,(17) established as a result of a 1987 reclassification of the city borders of Bandung City,(18) is inhabited by 18,467 households and has a population density of 11,742 people per km2.(19) The National Statistical Office classifies the entire district as “urban”.(20) However, Ujungberung District is situated at the outer north-east limit of the city, adjacent to a district that has a more rural character.
Ujungberung District
Ujungberung District was selected for the study owing to the wide variety of water sources available to it: metered piped water, deep groundwater, shallow groundwater, spring water, river water, and various forms of commercial water (e.g. bottled water, water from vendors). Piped water comes from a mini-plant, MP Cipanjalu,(21) operated by the Municipal Water Company (MWC). MP Cipanjalu only serves 1,231 households,(22) or 6.7 per cent of the total district population. It employs a conventional treatment process and distributes water via in-house connections. Ujungberung District features several river tributaries, but these are rarely used as a source of water for direct human consumption. One of the main rivers in the district, Cipanjalu, provides raw water for MP Cipanjalu. Importantly, Ujungberung District is not connected to the municipal sewerage system and centralized wastewater treatment facilities. Faecal sludge is directed to the river or to individual or shared septic tanks that function as storage and containment facilities. These septic tanks often do without appropriate infiltration areas and regular maintenance. Meanwhile, greywater is directed to the main stormwater channels in the district and flows to receiving rivers without treatment. Poor sanitation causes water contamination risks in the district.
Bandung City features a highly productive aquifer, but has suffered from a continuously decreasing groundwater level since 1995.(23) Seventy-seven per cent of the Ujungberung District population use groundwater daily by accessing shallow wells and deep boreholes equipped with electrical pumps.(24) Meanwhile, the geographical position of Ujungberung District at the foot of Mount Manglayang creates ideal conditions for natural springs that supply inhabitants with an abundance of spring water. The commercialization of spring water in the early 2000s increased the accessibility of clean water, which is supplied through individual, shared or communal provision, and vending. Thus, spring water in the local area has a high market penetration.
III. Methods
We carried out a survey of 70 households in Ujungberung District, Bandung City, with participants selected through a convenience sampling approach.(25) Despite the known limitations of this approach, we confirmed that the sample represented the use of all identified water sources in the area. We used a questionnaire that was comprised of closed- and open-ended questions. The closed-ended questions were designed to obtain data on the characteristics of respondents, their access to water, water use, and sanitation. IBM® SPSS version 21 was applied in a descriptive analysis of this data. The open-ended questions explored key themes relating to how participants perceived risks and chose between different water sources and different water-related strategies (see the Appendix). We focused on the application of three water-related strategies that were widely adopted among households: household storage, household treatment, and the use of multiple water sources.(26) Additionally, we examined households’ rejection or acceptance of public piped water supply.
Respondents’ answers were taped and transcribed. The transcribed information was then coded electronically using ATLAS.ti7©, and reduced to a series of keywords that captured the dominant themes. The coding process was designed to address the following questions: How is a household’s perception of risk relating to different water sources shaped? How and to what extent do households choose between different aversion behaviours? Why do households reject or accept the public piped water service? We applied an eclectic coding approach, drawing on a mixture of attribute, structural, magnitude, and in vivo coding.(27) Such a mixed and detailed coding technique was utilized to avoid early generalizations that might have neglected the complexity of household behaviours. We employed a “split” coding method, in which the data are divided into several “codable moments”.(28) We believe that this coding approach best serves the study’s aims, allows for a nuanced analysis, and is an appropriate method for bringing together “richly diverse but disparate text”.(29) Additionally, we used quotes from interviews to further elucidate the links between risk perceptions and household behaviours.
IV. Participant Characteristics
Table 1 shows the characteristics of participants who contributed to the questionnaire. Fifty-six per cent of participants were homemakers, 26 per cent self-employed, 11.4 per cent permanent employees, and the rest were engaged in various informal activities and non-permanent jobs. The average duration of education was 9.6 years, slightly lower than for Bandung City’s general population (10.5 years).(30) Average monthly household income was 3,061,000 Indonesian Rupiah or IDR (US$ 245),(31) and 33 per cent of households had income lower than the Regional Minimum Income for Bandung City in 2014 (IDR 2,000,000 or US$ 160). The average participant’s household consisted of five persons (the average household in Bandung City contained four persons).(32) This inconsistency may be due to seasonal workers staying with their relatives, who can only afford housing on the outskirts of the city. This type of social mobility often remains undetected.
Characteristics of participants of the semi-structured interviews in Ujungberung District, Bandung
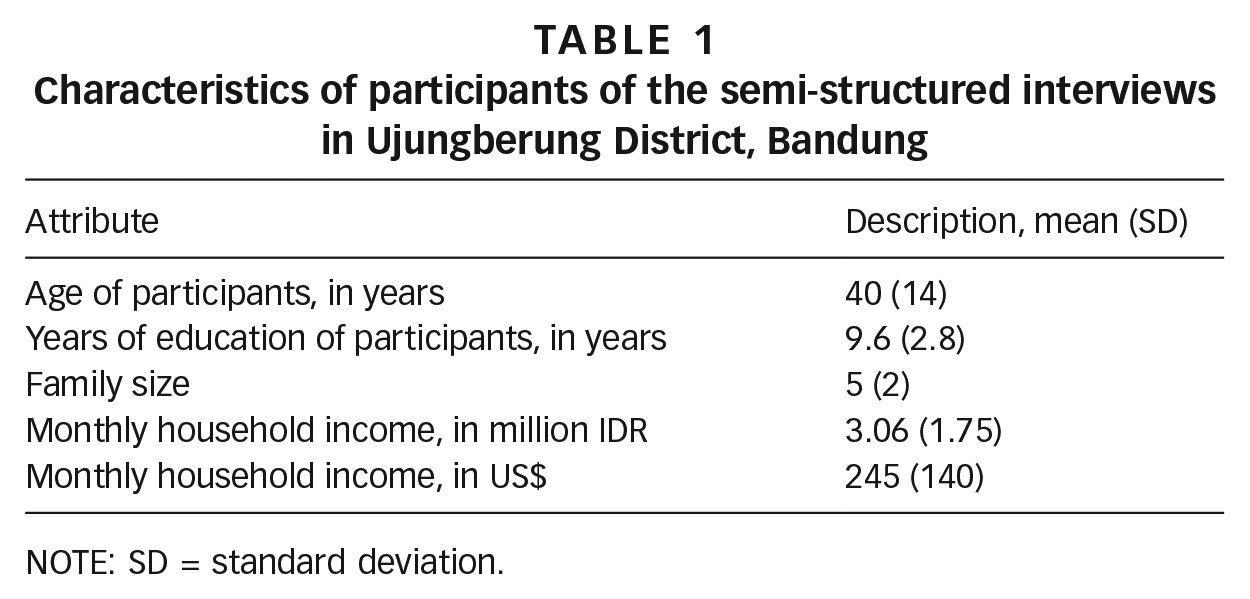
NOTE: SD = standard deviation.
V. Water Sources: Description, Quality Assurance and Cost
We identified seven types of water sources (Figure 1) and made a cost estimate for each source (Table 2). Groundwater extracted through boreholes or dug wells is the most widely used source of water among participants; 48 out of 70 (69 per cent) of households in Ujungberung have access to groundwater (shallow wells or boreholes). The seven sources are listed below:
Metered piped connection. MP Cipanjalu distributes water by gravity and there is insufficient pressure to deliver water to the higher, northern parts of Ujungberung District. Only 11 per cent of households participating in the survey had access to piped water. A water meter installed in the consumer’s residence records the volume of water used.
Individual or shared boreholes to a depth of 15 to 45 metres. Water is extracted from these with the use of electrical pumps. Boreholes are commonly equipped with a pipe casing assembly to protect water from contamination, a storage facility, and sometimes a household filtering device. Labour and material costs for siting a borehole and installing storage and filtering devices run between IDR 2,500,000 (US$ 200) and IDR 11,500,000 (US$ 921). The operation and maintenance costs depend on the pump capacity, duration of pump operation, and pump durability.
Individual or shared dug wells to a depth of 5 to 15 metres. Water is drawn using a simple bucket pulley system. We observed that dug wells are not equipped with proper protective structures and lids. The construction costs for a dug well vary from IDR 500,000 (US$ 120) to IDR 2,500,000 (US$ 200), and there is almost no regular operation and maintenance cost incurred for extracting water from this source.
Spring water (individual or communal access). In the case of an individual “connection”, water from the reservoir owned by spring water entrepreneurs is delivered directly to individual dwellings. Water may also be delivered to a communal tank and further distributed to individual dwellings. Spring water does not undergo treatment and there is no water meter present. Water may be contaminated within the distribution pipes that are made from standard plastic hosing. The hoses lie at the street edge at several distribution points, and are regularly passed by motor vehicles. Damage often occurs to the distribution hoses. Households pay IDR 15,000 (US$ 1.2) every month for this type of access, along with incidental repair fees that are split between fellow users. Households can also take spring water from communal tanks for a small fee, of only IDR 100 (US$ 0.01) per 3.3 litres.
Branded bottled water, or mineralized and demineralized drinking water produced by beverage companies, mainly sold through distribution agents. Water is sold in 600-milliletre, 1-litre and 19-litre bottles. The largest size is most commonly used in the household setting. Bottled water is priced from IDR 13,000 (US$ 1.1) to IDR 15,000 (US$ 1.2) for 19 litres of water. The bottled water industry is tightly regulated by the Ministry of Health and Consumer Protection Agency and adheres to a quality assurance standard to ensure safety.
Refilled bottled water, which is sold by small kiosks that treat raw water sources by using filtration sets and ozone/UV disinfection units. The treated water is supplied in refillable 19-litre plastic bottles and sold directly to households. Regulations require that refill water kiosks register with the local health office and pass water safety and sanitary inspections. Even so, we observed that some kiosks operate without quality certificates. Thus, the safety of their products remains questionable. The cost of this type of drinking water is much lower than for branded bottled water, at only IDR 3,500 (US$ 0.3) to IDR 5,000 (US$ 0.4) for 19 litres of water. Sixty-seven per cent of households use multiple water sources. Borehole/refill water and spring water/refill water are the most popular combinations observed.
Water sold by vendors from pushcarts or pickup trucks. Vendors sell spring water or resell piped water to areas where spring water or piped water supplies are inaccessible. Vendors may have a regular client base or sell water door-to-door in 10-litre containers priced at IDR 2,000 (US$ 0.2).
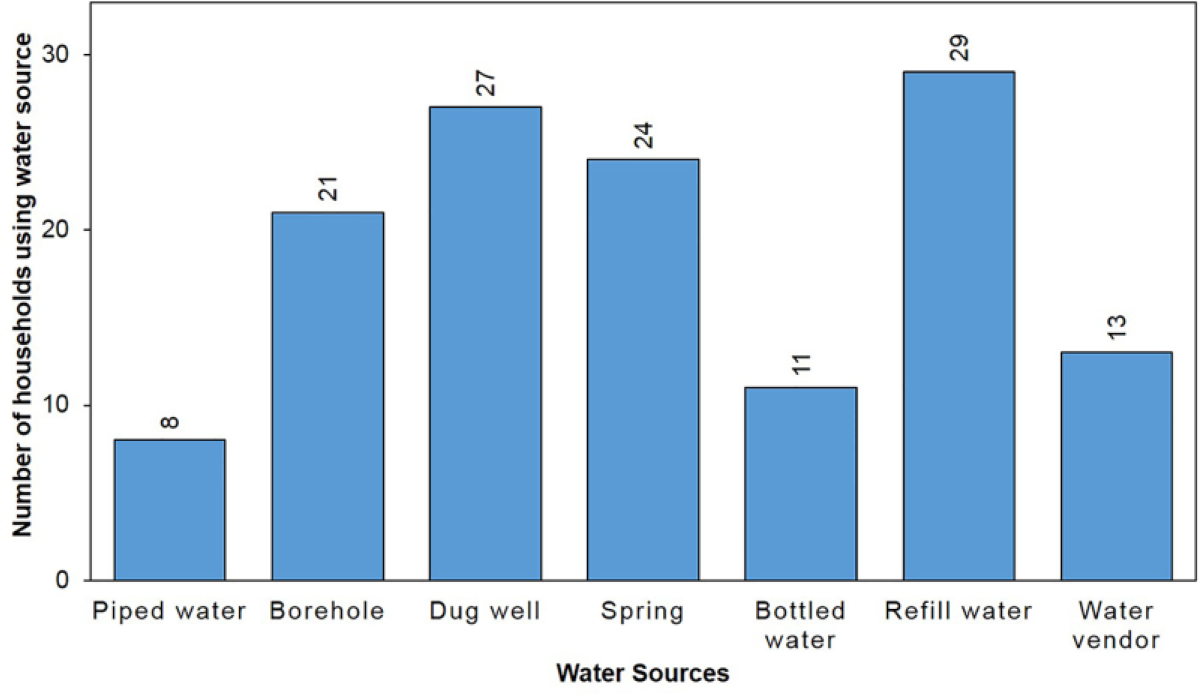
Numbers of participants using piped water, groundwater, spring water and commercial water
Cost estimates for different water sources, in thousand IDR (a)
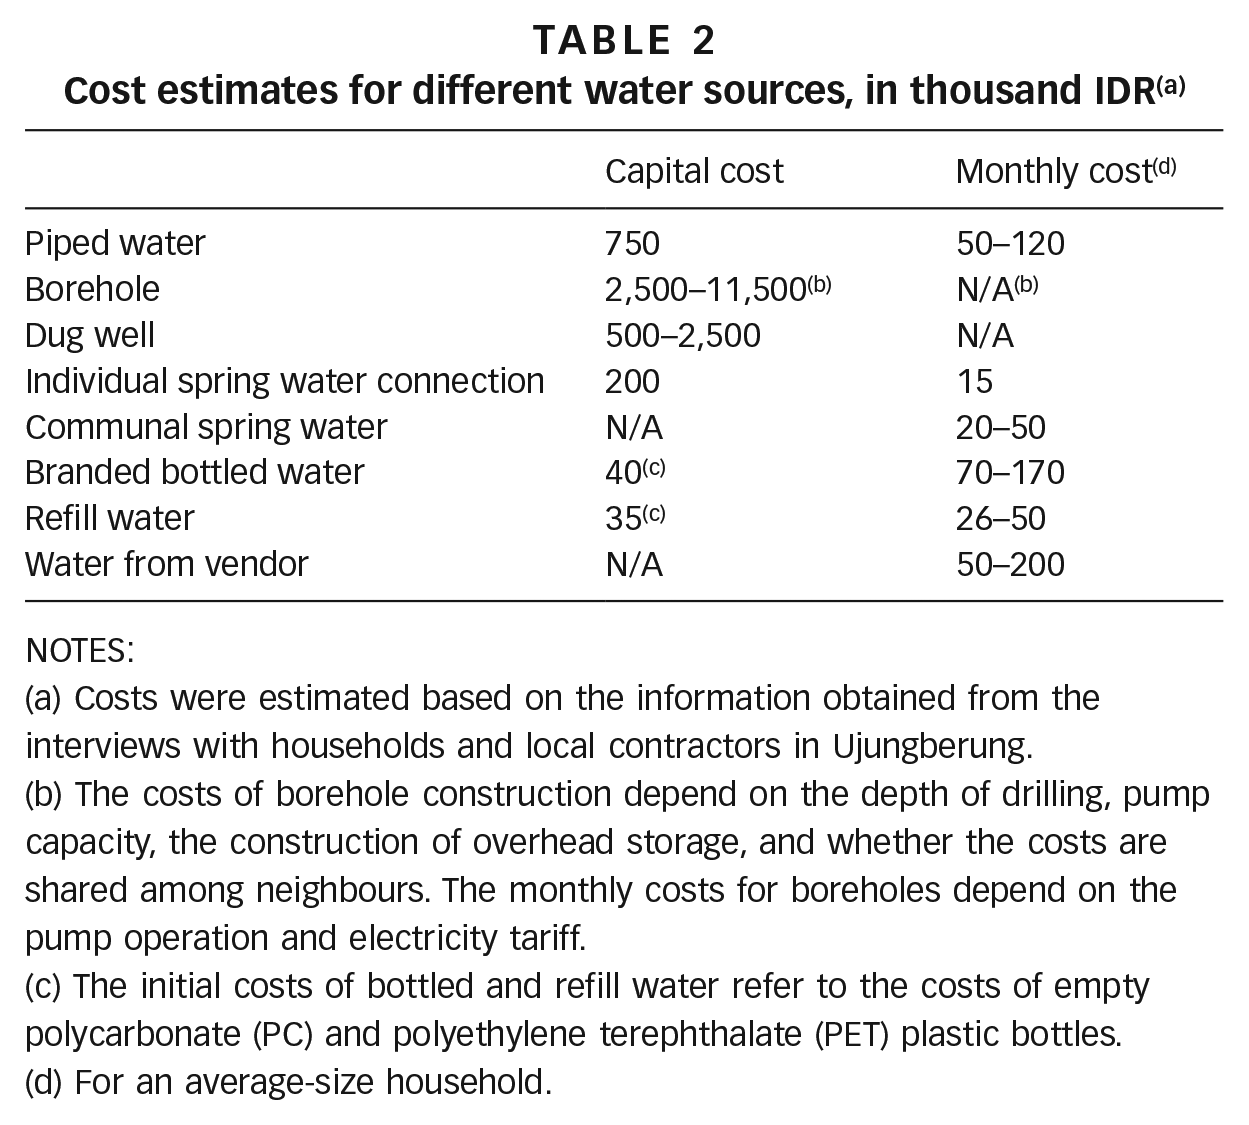
NOTES:
Costs were estimated based on the information obtained from the interviews with households and local contractors in Ujungberung.
The costs of borehole construction depend on the depth of drilling, pump capacity, the construction of overhead storage, and whether the costs are shared among neighbours. The monthly costs for boreholes depend on the pump operation and electricity tariff.
The initial costs of bottled and refill water refer to the costs of empty polycarbonate (PC) and polyethylene terephthalate (PET) plastic bottles.
For an average-size household.
VI. Risk Perceptions and Aversion Behaviours
Ninety-nine per cent of the 70 households interviewed stored water. Households stored water in different kinds of containers depending on use, such as bathing or drinking. Storage facilities varied from simple buckets and jerry cans to overhead storage tanks. Boiling is the dominant method of home water treatment, performed by 64 per cent of participants. Four per cent of households also use filtering. Eighty per cent of participants use multiple water sources and 64 per cent buy commercial water, i.e. water from vendors, bottled water or refill water.
The following subsections relate the strategies of storing, treating and mixing water sources to the dimensions of access. Subsequently, we discuss the acceptance or rejection of piped water in the context of aversion behaviours.
a. Water storage, boiling and filtration
The fact that water quality improves through the settling of suspended solids is one of the main reasons that households store water. As a participant explained, “For drinking, we store it first, letting the dirt settle for two or three days.” Water storage often serves as a preliminary step before boiling. Households may also perform an additional simple cloth filtration process prior to boiling. Households worry about health risks resulting from skin contact with contaminants in water when washing. As one representative participant put it, “Storage is needed before filtering, before I use water for bathing and washing. The water is not good, it makes the clothes yellow. I am worried that it will irritate us when it touches our skin, if we don’t filter it.” Households also boil water to improve water quality, reducing the microbial load.(33) There are other treatment methods such as chlorination, but boiling is the preferred, most trusted, and also most widely adopted method to remove contaminants. Households treat water to attain a quality level similar to that of bottled/refill water. Twenty-six per cent of respondents who boil water associated boiling with improved water quality and 49 per cent stated explicitly that drinking non-boiled water can expose them to waterborne diseases. However, the motivation for boiling water does not always relate to the improvement of water quality and reducing risk. Twenty-five per cent of households that boil water state that they do it simply to make hot drinks. The reasons behind boiling behaviour, in other words, are not all risk-related.
The rationale for storing water may depend on how the water is obtained. Commercial water vendors usually sell water regularly, at a certain time of day or day of the week: “From the vendor, water comes twice, once in the morning and once at 2 p.m.” Despite the general certainty of supply, households that buy water from vendors must adopt a storing strategy to ensure that an adequate quantity of water is always available. An interviewee explained, “We get it from a pickup truck. We can buy from this guy whenever we want, but I don’t want to buy water every day, only once every week or two.” Depending on how frequently they purchase water, households may possess different capacities to store water, but they all have some approach.
Households with access to individual spring water connections stored water mainly because of low supply pressure rather than issues of regularity or predictability. A spring water user stated, “our water supply is continuous. If I don’t store, it will go to waste” and “I can’t use water directly from the hose, it comes out slowly, I need to store it first so there will be enough available for when I need to bathe.” Those with access to metered piped water experienced problems of both continuity and low supply pressure, making the storing of water a necessity. Water can be stored using containers or buckets at the tap end, or in sealed containers connected to the water meter. In the latter case, water is distributed throughout the entire home plumbing system after it is collected. We also observed that piped water users sometimes applied “vacuuming” or installed electric pumps to draw water from the water mains. Subsequently, they stored the abstracted water in an underground tank, thus ensuring water availability. This strategy is in fact banned and the MWC has issued a warning highlighting the illegality of such practices. Assisted abstraction disadvantages other users who do not apply pumps or “vacuuming”. Nevertheless, it is still often used as a last resort during times of supply disruption.
For borehole users, water is stored after it is extracted from the borehole. A typical domestic setup consists of an electric pump that abstracts water from the ground and pumps it into an overhead tank. Gravity then delivers water throughout the entire home plumbing system. Because power cuts often shut down the extractor pump, interrupting the water supply, households store water in anticipation of running short. One respondent stated, “We have a lot of blackouts. I have to be prepared. If the electricity goes off, the water won’t come up.” Storing behaviour is also related to expense, in particular to the charges that are added to the electricity bill in relation to electrical pump use. Storing water reduces the frequency with which the pump turns on and off, thus reducing the electricity bill. One participant noted, “By storing, the pump will only need to turn on once every two or three hours, saving me money.” This also reduces wear, as well as the cost of pump maintenance or replacement.
b. The use of multiple water sources
According to the study results, households purchasing bottled or refill water for drinking considered other water sources to be of a poorer quality. Most of the perceptions relating to water quality are derived from the smell, colour and taste. Households also bought commercial water to avoid boiling, thus saving on energy costs and time. “We, women, need to save our time, we have so much to do, it is more practical to just buy bottled water, and put it on a dispenser when we want to drink, rather than boiling and storing it”, a homemaker argued. Bottled water and refill water were both popular alternative drinking water sources households turned to if they wanted to save on cooking fuel costs or when cooking fuel was scarce.
Sixty-six per cent of households preferred commercial water for drinking purposes, whether bottled water, refill water, or water bought from vendors,(34) because they thought the water was “better”. The MWC’s distribution network and well structure are considered unable to provide safe, contaminant-free water, and there are concerns over poor sanitation and leakage from poorly managed septic tanks that can contaminate water sources. This perception is not without basis: 55 per cent of respondents are connected to septic tanks, most of which are poorly maintained, while almost half of the respondents directly dump their wastewater into the river.
For washing and other domestic purposes, however, households considered piped water, groundwater, and individual or shared access to spring water as their primary water sources. In these cases, commercial water from vendors was required only when the primary sources failed with respect to quantity. Households bought water in anticipation of seasonal scarcity. As a respondent who owned a shallow well put it, “In the dry season when there is not enough water, we just buy it, that’s what everyone does.” Households often supplemented water bought from vendors with groundwater to save money or to prevent “buying too much water”. We also observed similar rationales within households that use a combination of piped and non-piped water sources (groundwater or spring water). They recognized such sources as complementary in regard to both affordability and seasonal continuity. Households using piped water and water from vendors occasionally used groundwater for water-intensive domestic activities such as washing and cleaning to reduce the volume used, thus cutting down on their water bill. If wells dry up in the dry season, the gravity-led network service (piped water) may provide an alternative supply.
Figure 2 illustrates the degree to which various dimensions of access drive households to store water, treat water, and use multiple water sources, as previously described.
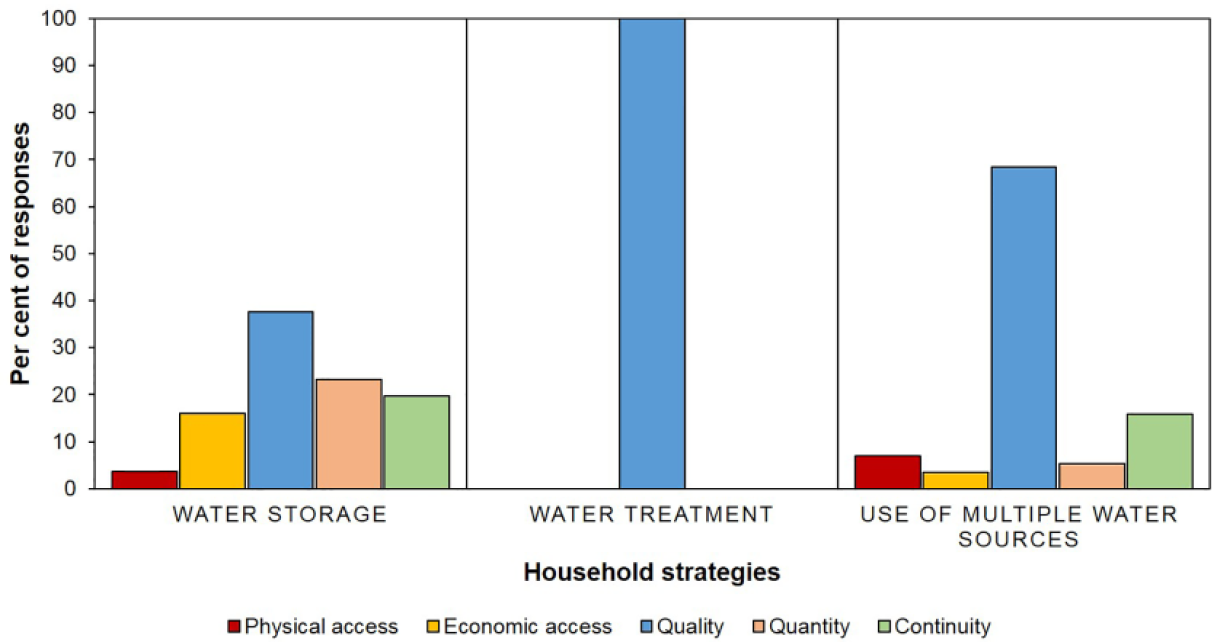
Percentages of responses relating aversion behaviours to the dimensions of access
c. Perceptions and attitudes towards piped water connections
We examined the perceptions of piped water connections held by: a) connected households (currently using the MWC service); b) past connected households (serviced by the MWC in the past); and c) never connected households. Connected and past connected households have had first-hand experience of the service quality of the MWC.
Households currently connected to piped water had a positive perception of the MWC service with regard to pressure level and quantity. However, negative perceptions of the MWC predominate, regardless of households’ experience of the MWC service, and relate mainly to continuity, affordability, and water quality issues. The main concerns of connected households related to the contamination risks stemming from septic tank leakage, the poor taste and smell of piped water, and daily and seasonal continuity. Households also questioned the accuracy of water meters, which they believed led to unreasonably high bills. There were also concerns that demands for service improvements would remain unheard. One respondent elaborated, “The water from the piped network is not available every day, perhaps once every two days, at night. Should we stay awake every night? It’s tiring. I feel that the water that we use does not fit with the numbers on our water meter. But there is nothing that can be done, they say that I still have to pay. So I paid, I don’t want any trouble.” Another householder stated, “I got tired reporting it, but at least I tried. Many others also report the problems, but the officer said that we should just accept it because there was no water there (at the source).”
Some previously connected households decided to cut off their piped water connection because the unpredictable service interrupted their daily schedules, and they had to “stay awake at night waiting for water to come”. They also believed that piped water was a potential source of conflict among neighbours: “We also fought over water with our neighbours. So we use water from the well instead.”
Expense was a further reason for disconnection.(35) Failure to pay bills resulted in network disconnection by the MWC. In these cases, reconnection requires all outstanding bills to be paid, and is charged at 15 per cent of new installation charges. The MWC Tariff Adjustment Plan explicitly states: “As part of its service improvement plan, the MWC had to shut down connections that could not be supplied and/or that did not pay the bills.”(36) According to the United Nations (UN), disconnections as a result of non-payment should not result in an individual being denied access to a minimum amount of safe drinking water if that individual can prove that he or she is unable to pay.(37) MWC appears not to adhere to these UN principles, and access to the minimum amount to meet basic needs is not guaranteed.
We classified households based not only on their piped water connection, but also on their attitude towards this service. Figure 3 shows the attitudes of connected households, ranging from strong rejection to strong acceptance (see the Appendix).
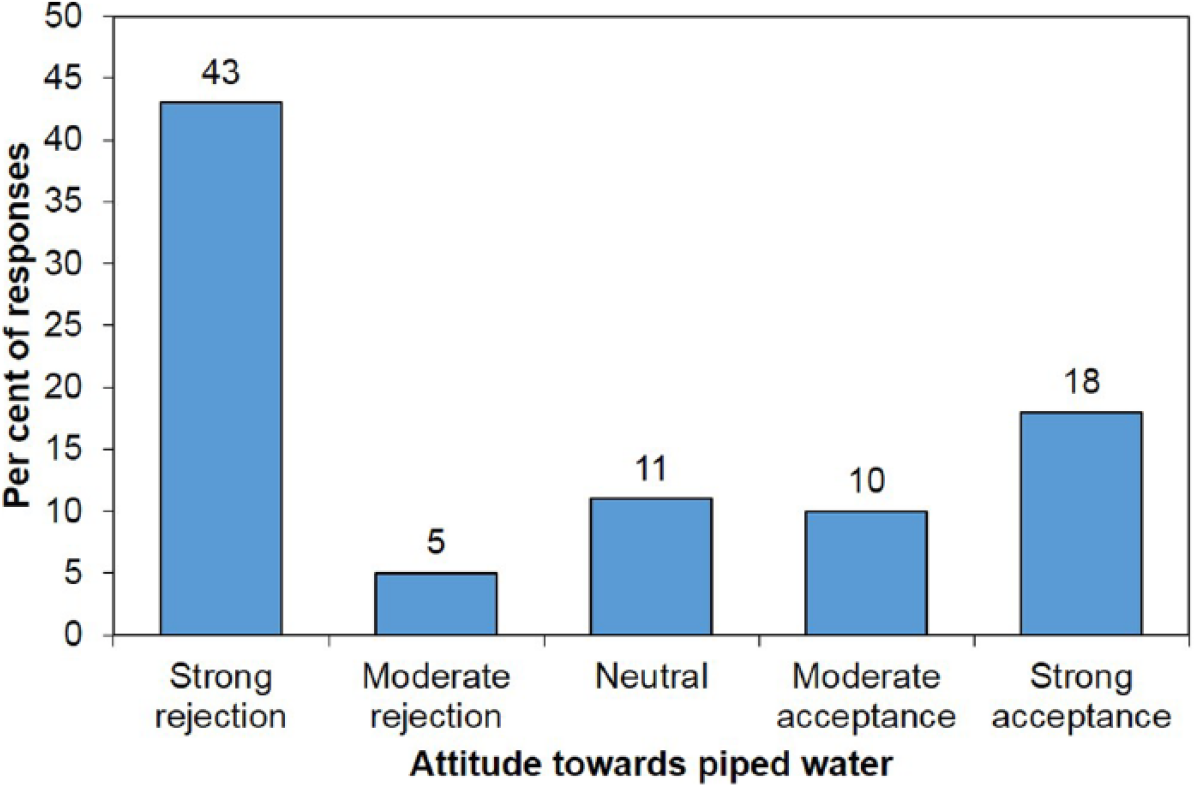
Households’ attitudes towards piped water connections
Almost half of the surveyed households strongly rejected piped water connections. The interviews revealed the issues underlying this rejection. Connection charges are the primary barrier,(38) but this is only one among several issues that keep households from connecting to the piped water supply. Households are unlikely to install a connection if they have access to an adequate supply of non-piped water. Participants also did not believe that the MWC piped water was an improvement over their existing water sources, and believed that switching to piped water might in fact leave them “worse off”. Poor reliability mainly drove this reluctance. The MWC service is characterized by supply interruptions. As one respondent put it, “I see my neighbours, they have piped water and the water often doesn’t arrive.” This perception is supported by statistics suggesting that only 39 per cent of 129 villages in Bandung served by the MWC have a consistent, uninterrupted water supply.(39) Households also choose to avoid monthly subscription fees and the time spent waiting for water during periods of interruption.
VII. Towards a Framework of Risk Assessment and Aversion Behaviours
Based on the results of the study, we developed a framework that explains how households in Ujungberung District assess risks and respond in order to avert risks (Figure 4).
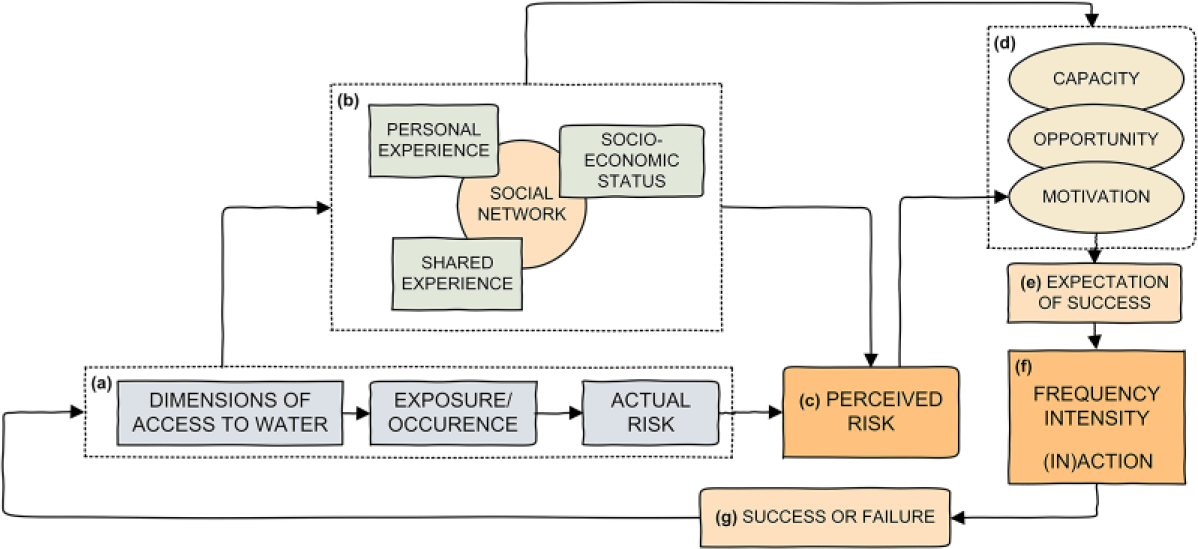
Framework of risk assessment and aversion behaviours among households in Ujungberung District, Bandung City
Section a of Figure 4 relates access to water and risk exposure; for example, poor quality and poor continuity of water will expose households to risks of illness and economic losses. With regard to water quality, there is no conclusive evidence as to health risks, as indicated by two studies conducted in Ujungberung District in 2015. Iqbal et al. measured the total coliform and faecal coliform bacteria in 77 households’ water samples.(40) They found that refill water is not necessarily safer than piped water after boiling, and that piped water users who turn to refill water are exposed to the same level of risk. Putri et al. performed a quantitative microbial risk assessment (QMRA) focused on the consumption of refill water and piped water. Their results demonstrated, by contrast, that piped water carries a higher probability of infection risk than refill water.(41)
Thus, based on these studies, refill water may or may not provide a higher level of protection to public health than piped water samples. This inconsistency may be a function of the variable quality of water. Although MP Cipanjalu is able to fully eliminate the coliform present in water, for instance, recontamination may occur through the distribution line. Thus, in the absence of better water quality information, householders that did not drink piped water rationally avoided health risks stemming from microbial water contaminants. The level of risk would be easier to assess if water quality were monitored regularly by state health offices or water entrepreneurs, ensuring that it consistently complies with human usage standards, and thus providing information for household decisions. In the absence of this information, the study results indicated that actual risks do not directly shape households’ perceptions of risks, nor do they promptly lead to the adoption of aversion behaviours. Section b in Figure 4 shows the interactions of experience and social networks in shaping households’ perceptions of risks.
Perceptions of risk may develop via different pathways: personal experiences, shared experiences, the experiences of others, or combinations thereof. Households based their assessments of risk on their own experiences relating to the dimensions of access to water, e.g. their own exposure to poor-quality water or experiences relating to supply interruption.(42) Personal experience may be mediated by the socioeconomic backgrounds of individual households. We examined exactly how the socioeconomic characteristics of households affected risk beliefs among participants in Ujungberung, but the data do not reveal a clear pattern in this relationship. Beliefs surrounding risk may also be based on a shared experience of challenges in the neighbourhood. For example, a previously connected participant decided to cut off his connection when he and his neighbours experienced similar reliability problems. “It’s not only me, almost the entire neighbourhood experiences this”, he said.
The perceived risks and further adoption of aversion behaviours are not only derived from first-hand (personal and shared) experiences. Social networks also play a role in the dissemination of information about risks, and households’ behaviours were often based on this information. For example, a respondent from a household that drank water obtained from vendors stated, “Everybody says that the water that I buy is fit for drinking.” An aversion to piped water in households never previously connected to the network is based, among other reasons, on allegations from neighbours concerning the unreliability and high cost of the MWC service.
Spring water is highly regarded, partly due to local word of mouth about the results of the water quality testing performed by water entrepreneurs, rather than by individual households purchasing the water.(43) According to one respondent, “People say that the spring owners take their water to the lab every three months. They have a permit. It’s very clean, people here dare to drink it directly.” The fact that some spring water entrepreneurs and refill kiosk owners test their water, and that this information is spread by locals, results in a lasting positive reputation for these sellers. Piped water originating from the MWC also undergoes regular quality testing at the point of distribution. Yet households do not appreciate the quality of piped water in the same way: “Water from the MWC is not fit for drinking, it’s filthy.” Despite the fact that the MWC’s water is tested regularly, people worry about the recontamination risk that results from the vulnerable distribution network.(44) Some households also suggested that unreliable septic tank facilities may jeopardize the safety of piped water at the point of consumption. Water origin clearly affects the perceptions of water safety. While it is taken for granted that spring water is of high quality, river water, used by MWC, is expected to be unsafe, no matter how effectively it is treated. Even an officer of the MWC responsible for quality testing in the MP Cipanjalu revealed in an interview a reluctance to drink piped water. “I saw where it comes from,” he stated. To sum up, water-related risks are embedded in personal and shared experiences, and are disseminated by social networks.
The interaction of personal experience and information on actual risk, circulated through social networks, explains households’ perceptions of risk. However, this does not explain how perceived risks lead to certain behaviours. Our findings are consonant with the classic theory of planned behaviour, in which behavioural achievement depends on both motivation and the availability of requisite opportunities and resources(45) (as illustrated in Section d of Figure 4). Section VI of this article identified health protection and economic loss as motivators that lead to varying degrees of action. Certain strategies are selected based on an inherent expectation that risk relating to poor water supply will be reduced (Section e).
The socioeconomic capacity of households may determine their ability to adopt certain strategies, and to what degree. A recent Nepali study suggests that poverty restrains households from adopting home treatment strategies.(46) This supplements the findings of an older study, suggesting that years of schooling and a higher level of knowledge may lead to the adoption of filtering treatments and bottled water.(47) Contrary to these findings, our survey found that 74 per cent of participants with an income lower than the minimum regional income boil their water, while only half of the participants in the higher-income group choose to do so. Likewise, 76 per cent of households with primary/lower secondary education treat their water, while only half of the respondents with secondary/post-secondary education do so.
However, these numbers should be approached with care, since households with more income or education may be more likely to purchase bottled water, thus eliminating the need to boil. The study findings indicate that this is the case for branded bottled water, which predominates in richer households – participants with household income higher than the minimum regional income are five times more likely to purchase branded bottled water than those whose income is lower than the minimum regional income. However, similar proportions of participants with income both lower and higher than the minimum regional income use refill water. There is a similar pattern around the use of bottled water among participants with different education levels. The rate of branded bottle water purchase among participants with more than 15 years of education is almost four times higher than that among those with a low level of education. But the rate of refill water purchase is similar among participants with different levels of education. This indicates the high popularity of this type of water source among households in all income and education strata. It should be noted that these low- and high-end alternatives may be accompanied by varying levels of service quality and effectiveness (to the extent that certain strategies can reduce risks).
In addition to these choices, we identified a range of different actions, intensities and frequencies applied by participants who decided to adopt storing, treating and filtering techniques, and the use of multiple water sources. Households may decide to perform pre-treatment to reduce health risks associated with poor water quality, such as storage, filtering, or a combination thereof. Filtration methods range from simple cloth filtration to more advanced activated carbon, activated sand, zeolite sand, and manganese filtering. We expect that rich households will opt for the more advanced filtration, but the study was not able to demonstrate this since the overall level of filter use is very low in the sample. Storage facilities vary from simple buckets placed in the bathroom to overhead storage tanks with a 1,200-litre capacity. Households can choose from cheaper cloth filters and bucket-type storage to more advanced, but relatively expensive, filtering devices and overhead storage tanks. If water is required for drinking, householders may then, as discussed above, select boiling. This is an effective method for reducing health risk, and a method that will achieve a quality level similar to that of bottled water.
There is also some evidence to suggest that an individual’s position within a household and the security of tenure may encourage or discourage the adoption of aversion behaviours. The decision to install a piped water connection, for instance, depends on the household hierarchy and where interviewees fit into this hierarchy. Patriarchal family hierarchy and multi-generational occupancy are common characteristics of households in western Java. Husbands or parents tend to be sole decision-makers, leaving little room for the opinions of women and young married couples living with their parents. Based on our observations, female household members with a low socioeconomic status were allowed to choose between simple, low-cost strategies, but had to consult their spouse or other male household members if more costly solutions were required. Security of tenure also affected how households selected water sources. This was especially relevant for seasonal workers who temporarily reside in the area. Their status as tenants limits their ability to make decisions regarding the installation of new connections. Some participants refused to invest in the costly provision of water sources within a house that did not belong to them.
When people are motivated and have the capacity to act, the presence of opportunity may facilitate decision-making. Some spring water users have decided to have an individual spring water connection installed if the distribution network passes through their yards. Households currently connected to piped water also stated that their decision to connect was made when the local leaders arranged for a collective installation application made to the MWC. Households may re-evaluate their decisions if they perceive that a piped water connection does not reduce risks by a reasonable degree. This is reflected in the decisions of some households to disconnect. However, it should be noted that this type of re-evaluation may take place with regard to any decisions relating to any type of water source.
VIII. Conclusions and Recommendations
Aversion behaviour, or actions taken by households to mitigate damage associated with pollution, has been used previously to measure economic losses in response to environmental externalities.(48) People are known to be risk averse, taking measures today to avoid the possibility of a negative impact in the future.(49) The present study focuses on these measures to avoid risk in the context of inadequate water supply services, which expose households to uncertainty, potential economic loss, and negative health impact on a daily basis. The results show a range of sensible measures taken by households in the absence of detailed water quality data.
This study used qualitative inquiry to contribute to a deeper understanding of households’ aversion behaviours, risk perspectives, and risk management strategies. We extended the scope of the definition of aversion behaviours from actions seeking to avoid health risk,(50) to include strategies aimed at uncertainty reduction and avoidance of economic loss.(51) In Ujungberung District, households employed various aversion strategies to avoid negative impacts, including being “without water”, illness resulting from the consumption of contaminated water, excessive time and energy spent acquiring water, and/or paying too much for water. Households maintain storing and treatment behaviours and use different water sources (or combinations thereof) based on their perception of risks that refer to the different dimensions of access to water. Such perceptions and decisions depend on complex interactions among personal experience, shared experience, socioeconomic attributes, and social networks.
This study was conducted in an area that enjoys a plentiful supply of spring water managed by local entrepreneurs in cooperation with community members. This type of arrangement may encourage trust in spring water, which shapes the choices that households make. We also limited the study to four behaviours: water storage, water treatment, the use of multiple water sources, and the decision to accept or reject a piped water connection. Other behaviours, not included in this study, have also been recognized, e.g. adjusting daily schedules in line with the availability of water, and obtaining water from relatives. These are outside the scope of the study but may be an interesting avenue for further research.
We first assumed that water storing is strongly associated with issues of continuity of supply.(52) However, the findings show that households that use groundwater also apply storage strategies, and sometimes combine storage with filtration to reduce health risks. These observations should be considered further in future aversion behaviour studies because the more widely discussed aversion behaviours, at the moment, encompass only the purchase of bottled water and the implementation of household water treatment as responses to the perceived health risks of contaminated water.(53)
The framework developed here may also be a useful starting point for similar research in the environmental risk fields as well as on social marketing measures. However, the framework is based on one case study and more research is needed to examine whether it is relevant in other contexts. It should be noted that application of the same methodology in a different situation might result in different results. We suggest that more detailed studies are needed in a range of situations, in particular to more fully understand the links between socioeconomic attributes, i.e. education and income, and risk perceptions.
Lastly, this research focuses on risk management at the household level. Households may reduce the effect of a poor-quality water supply by acting jointly with others in their neighbourhood. We recommend that future studies examine risk-reducing or risk-sharing mechanisms that occur at the community level.
Footnotes
Appendix
The open-ended survey was comprised of the following questions:
The attitudes of respondents towards piped water were retrieved from the survey. The results are shown in Figure 3. Never connected and previously connected households were asked a hypothetical question about their attitude towards being offered a piped water connection. Connected households were asked about their experience of the piped water service. Responses were classified as follows:
STRONG REJECTION: Participants express a strong rejection of a new piped connection, by simply saying no immediately. Participants may or may not elaborate on why they reject a piped water connection. Participants may have also been disconnected from piped water services.
MODERATE REJECTION: Participants express a moderate rejection of a new piped connection. Participants may say, “Not now, maybe later” or “No, unless…”; participants may elaborate on why they reject a piped water connection, mainly by expressing their distrust of piped water quality.
NEUTRAL: Participants express a neutral attitude towards a new piped connection and also a neutral perception of piped water’s dimensions of access, e.g. “It depends on the price”. In some cases, participants may also feel that they do not have the authority to provide answers, e.g. “I have to ask my husband” or “I’m only a tenant”.
MODERATE ACCEPTANCE: Participants express a moderate acceptance towards a new piped connection, followed by mentioning barriers that prevent them from having a piped water connection. For example, “I am personally interested, but…”
STRONG ACCEPTANCE OR ADOPTION: Participants express a strong acceptance of a new piped connection, by saying yes immediately. Participants may elaborate on why they accept a piped water connection. Participants may also be currently connected to the piped water service.
Acknowledgements
The authors wish to thank Syahbaniati Putri and Muhammad Iqbal for their technical support, Ade Rahmat for his assistance in map preparation, and Gertjan Geerling for managerial support. We also thank Indrawan Prabaharyaka, Luuk Knippenberg and Jon Matthews for their valuable insights. Some results of the household survey were presented at the 5th Environmental Technology and Management Conference, Green Technology towards a Sustainable Environment, Bandung, Indonesia, 23–24 November 2015.
Funding
The research is partly funded by the Water and Health research programme at Deltares (the Netherlands) and the International Office of Radboud University Nijmegen (the Netherlands). This research is also part of the Alliance for Water, Health, and Development, a joint research and education programme of Institut Teknologi Bandung, Universitas Padjajaran, Radboud University, and Deltares. The PhD programme is partly supported by the Directorate General of Higher Education (Indonesia).
1.
“Risk” may have a different meaning among scholars. Risk can be defined as the presence of threat, the possibility of adverse outcomes, and opportunities whose returns are not guaranteed. Risk contains the elements of potential loss, the significance of loss, and the uncertainty of loss. See Yates, J F and E R Stone (1992), “The risk construct”, in J F Yates (editor), Risk-taking Behavior, John Wiley and Sons Ltd., Chichester, pages 1–25.
2.
Drinking water should be provided in close proximity to dwellings, thus preventing excessive collection time. Water must be free from contaminants posing health risk to a person. Water should be adequate and continuous for drinking and maintaining hygiene. Lastly, costs related to water should not prevent a person from accessing safe drinking water and should not restrict him or her from enjoying other basic rights. See United Nations (2007a), A/HRC/6/3 Annual Report of the United Nations High Commissioner for Human Rights and Reports of the Office of the United Nations High Commissioner for Human Rights and the Secretary-General, Human Rights Council, General Assembly of the United Nations, 32 pages, accessed 12 June 2015 at ![]() .
.
3.
Nganyanyuka, K, J Martnez, A Wesselink, J H Lungo and Y Georgiadou (2014), “Accessing water services in Dar es Salaam: Are we counting what counts?”, Habitat International Vol 44, pages 358–366.
4.
The lack of water may also affect the income-earning productivity of households. Rijsberman, F R (2006), “Water scarcity: Fact or fiction?”, Agricultural Water Management Vol 80, Nos 1–3, pages 5–22.
5.
For example, see Bain, R, J Wright, H Yang, S Gundry, S Pedley and J Bartram (2014), “Improved but not necessarily safe: water access and the Millennium Development Goals”, in P W R Quentin Grafton (editor), Global Water: Issues and Insights, Australian National University Press, Canberra, pages 89–95; also Kumpel, E and K L Nelson (2013), “Comparing microbial water quality in an intermittent and continuous piped water supply”, Water Research Vol 47, pages 5176–5188; Banerjee, S, Q Wodon, A Diallo, T Pushak, E Uddin, C Tsimpo and V Foster (2008), “Access, affordability, and alternatives: Modern infrastructure services in Africa”, Background Paper 2 (Phase I), Africa Infrastructure Country Diagnostic, 36 pages; Kayaga, S and R Franceys (2007), “Costs of urban utility water connections: Excessive burden to the poor”, Utilities Policy Vol 15, No 4, pages 270–277; and Vollaard, A M, S Ali, J Smet, H van Asten, S Widjaja, L G Visser, C Surjadi and J T van Dissel (2005), “A Survey of the Supply and Bacteriologic Quality of Drinking Water and Sanitation in Jakarta, Indonesia”, Southeast Asian Journal of Tropical Medicine and Public Health Vol 36, No 6, pages 1552–1561.
6.
Mintz, E, J Bartram, P Lochery and M Wegelin (2001), “Not Just a Drop in the Bucket: Expanding Access to Point-of-Use Water Treatment Systems”, American Journal of Public Health Vol 91, No 10, pages 1565–1570.
7.
Zerah, M-H (2000), “Household strategies for coping with unreliable water supplies: the case of Delhi”, Habitat International Vol 24, pages 295–307; also Pattanayak, S K, J C Yang, D Whittington and K C Bal Kumar (2005), “Coping with unreliable public water supplies: Averting expenditures by households in Kathmandu, Nepal”, Water Resources Research Vol 41, No 2, 11 pages; and Howard, G, J Teuton, P Luyima and R Odongo (2002), “Water usage patterns in low-income urban communities in Uganda: Implications for water supply surveillance”, International Journal of Environmental Health Research Vol 12, pages 63–73.
8.
WHO and UNICEF (2011), Progress on Sanitation and Drinking-water: 2011 Update, WHO/UNICEF Joint Monitoring Programme for Water Supply and Sanitation, 64 pages, accessed 16 August 2015 at ![]() .
.
9.
Bartlett, S (2003), “Water, sanitation and urban children: the need to go beyond “improved” provision”, Environment and Urbanization Vol 15, No 57, pages 57–70.
10.
Adekalu, K O, J A Osunbitan and O E Ojo (2002), “Water sources and demand in South Western Nigeria: implications for water development planners and scientists”, Technovation Vol 22, No 12, pages 799–805.
11.
Njiru, C and M Albu (2004), “Improving access to water through support to small water-providing enterprises”, Small Enterprise Development Vol 15, No 2, pages 277–281.
13.
The concept of “aversion behaviour” here refers to the one being used in behavioural and environmental economics, which is applied to assess people’s behaviour in regard to poor water supply. Aversion behaviours, or actions taken by households to mitigate damage associated with pollution, have been used to measure economic losses as a consequence of environmental externalities. For example, see Abrahams, N A, B J Hubbell and J L Jordan (2000), “Joint Production and Averting Expenditure Measures of Willingness to Pay: Do Water Expenditures Really Measure Avoidance Costs?”, American Journal of Agricultural Economics Vol 82, No 2, pages 427–437; also Jakus, P M, W D Shaw, T N Nguyen and M Walker (2009), “Risk perceptions of arsenic in tap water and consumption of bottled water”, Water Resources Research Vol 45, No 5, 8 pages; Janmaat, J (2007), “A Little Knowledge…: Household Water Quality Investment in the Annapolis Valley”, Canadian Journal of Agricultural Economics Vol 55, No 2, pages 233–253; and Nauges, C and C van den Berg (2009), “Perception of Health Risk and Averting Behavior: An Analysis of Household Water Consumption in Southwest Sri Lanka”, Working Paper Series 09-139, Toulouse School of Economics, 32 pages.
14.
With the exception of Vasquez (2012), which measured the link between the perception of reliability and storing behaviour. See Vasquez, W F (2012), “Reliability perceptions and water storage expenditures: Evidence from Nicaragua”, Water Resources Research Vol 48, No 10, 8 pages.
15.
Um, M J, S J Kwak and T Y Kim (2002), “Estimating Willingness to Pay for Improved Drinking Water Quality Using Averting Behavior Method with Perception Measure”, Environmental and Resource Economics Vol 21, No 3, pages 287–302.
16.
Chappells, H, N Campbell, J Drage, C V Fernandez, L Parker and T J B Dummer (2015), “Understanding the translation of scientific knowledge about arsenic risk exposure among private well users in Nova Scotia”, Science of the Total Environment Vol 505, pages 1259–1273.
17.
The hierarchy of the administrative areas in Indonesia is structured as follows: national government, provincial government, municipal/regency government, district and village. A city has the same administrative level as a regency, only a city has urban characteristics, whilst a regency has more rural characteristics. A city or regency consists of districts.
18.
Ujungberung District was previously part of Bandung Regency. In 1987, Ujungberung District was established as an administrative part of Bandung City based on Regulation of Bandung City No.16 Year 1987. In 2013, this district had 66,300 inhabitants. See ![]() , Ujungberung in Figures, Bandung City, 128 pages.
, Ujungberung in Figures, Bandung City, 128 pages.
19.
Lower than the average density of Bandung City (15,713 person per km2). See Statistical Agency of Bandung City (2015b), Bandung City in Figures, 350 pages, accessed 31 March 2015 at ![]() .
.
20.
The urban/rural classification is based on the population density, the proportion of farmers from the total population, and access to urban utilities. See National Statistical Office (2010), Regulation of the Chief of the National Statistical Office Number 37 year 2010 regarding the Urban-Rural Classification in Indonesia, Volume II Java, accessed 18 April 2016 at ![]() .
.
21.
The MWC does not deliver water via tanker or public standpipe. MP Cipanjalu is separate from the city’s main treatment plant and network in the central-north area of Bandung.
22.
23.
Harnandi, D, N Iskandar and S Arief (1997), “Groundwater Conservation in Greater Bandung”, Bulletin of Environmental Geology Vol 16, No 2, pages 41–57.
25.
The sample was determined based on the convenience sampling approach, using the equation in Isaac and Michael (1995), with a degree of accuracy of 0.1, a 90 per cent confidence level, and a population proportion of 50 per cent. See Isaac, S and W B Michael (1995), Handbook in research and evaluation: A collection of principles, methods, and strategies useful in the planning, design, and evaluation of studies in education and the behavioural sciences, EdITS, San Diego, 252 pages.
26.
These strategies do not represent temporary measures to overcome seasonal water stress, but rather a large part of daily life in (peri-)urban Indonesia. This is similar to the case of ![]() , whose work is focused on identifying coping strategies for climate variability-related water shortages in Nigeria. See Grace, A-O, B Urmilla and M Vadi (2013), “Households’ coping strategies for climate variability related water shortages in Oke-Ogun region, Nigeria”, Environmental Development Vol 5, pages 23–38.
, whose work is focused on identifying coping strategies for climate variability-related water shortages in Nigeria. See Grace, A-O, B Urmilla and M Vadi (2013), “Households’ coping strategies for climate variability related water shortages in Oke-Ogun region, Nigeria”, Environmental Development Vol 5, pages 23–38.
27.
Eclectic coding employs a compatible combination of two or more coding methods. Attribute coding is the notation of essential information from the data and demographic profile of participants. Structural coding is question-based coding that uses a topic of inquiry to categorize a data corpus; this type of code is suitable for in-depth interviews and open-ended question data. Magnitude coding has alphanumeric characteristics to describe frequency and intensity in the data. In vivo coding is drawn from participants’ own words. See Saldaña, J (2013), The Coding Manual for Qualitative Researchers (2nd edition), SAGE Publications Ltd, London, 365 pages.
28.
Bernard, H R (2011), Research method in anthropology: Qualitative and quantitative approaches (5th edition), AltaMira Press, Walnut Creek, 821 pages.
29.
See reference 28.
30.
Statistical Agency of Bandung City (2015c), Strategic Data of Bandung City, Bandung City, 64 pages, accessed 14 March 2015 at ![]() .
.
31.
All conversions of Rupiah (IDR) to US$ are based on the exchange rate of the Bank of Indonesia on 1 January 2015.
32.
See reference 19.
33.
Households expressed a strong distrust of the quality of piped and groundwater as they do not drink piped and groundwater directly without boiling it.
34.
Water from vendors in this area originates from springs.
35.
MWC customers are required to pay a fixed service fee of IDR 10,000 (US$ 0.8) per month, and the monthly water bill depends on the volume of water used.
36.
See USAID (2006), PDAM Kota Bandung Tariff Adjustment Proposal, 47 pages, accessed 2 January 2016 at ![]() .
.
37.
United Nations (2007b), The Right to Water, Fact Sheet No 35 of United Nations Human Rights, UN-HABITAT and World Health Organization, 61 pages, accessed 2 March 2015 at ![]() .
.
38.
See reference 5, Banerjee et al. (2008) and ![]() .
.
40.
Iqbal, M, A Nastiti and B S Muntalif (2015), “Improved is not always safe: a microbial water quality analysis in Bandung peri-urban households”, Paper presented to the 5th Environmental Technology and Management Conference: Green Technology towards Sustainable Environment, Bandung, 23–24 November.
41.
Putri, S, A Nastiti and B S Muntalif (2015), “Applying quantitative microbial risk assessment in household drinking water sources: a case study of Ujungberung District, Bandung”, Paper presented in the 5th Environmental Technology and Management Conference: Green Technology towards Sustainable Environment, Bandung, 23–24 November.
42.
The link between personal experiences and perceptions is also observed in the case of flood risks. Isunju et al. suggested that households with personal experiences of flood exposure were more likely to perceive themselves as vulnerable. See Isunju, J B, C G Orach and J Kemp (2015), “Hazards and vulnerabilities among informal wetland communities in Kampala, Uganda”, Environment and Urbanization Vol 28, No 1, pages 275–293.
43.
This is unlike households in Canada that performed or asked for a water quality test of their private wells to be carried out. See reference 16.
44.
Spring water actually faces similar risks, but respondents did not voice any concerns over spring water and contamination in the distribution network.
45.
Ajzen, I (1991), “The Theory of Planned Behavior”, Organizational Behavior and Human Decision Processes Vol 50, pages 179–211.
46.
Katuwal, H, M K Qassim, J A Pagán, J A Thacher and A K Bohara (2015), “Knowledge, Information, and Water Treatment Behavior of Residents in the Kathmandu Valley, Nepal”, The Development Journal of the South Vol 1, No 1, pages 3–23.
47.
Whitehead, J C, T J Hoban and G Van Houtven (1998), “Willingness to Pay and Drinking Water Quality: An Examination of the Averting Behavior Approach”, Paper presented at the 68th Annual Conference of the Southern Economic Association, Baltimore, 8–10 November.
48.
Smith, V K and W H Desvousges (1986), “Averting behavior: does it exist?”, Economic Letters Vol 20, No 3, pages 291–296.
49.
Goodstein, E S and S Polasky (2014), Economics and the Environment (7th edition), John Wiley & Sons, 546 pages.
50.
Health risks present in water commonly originate from contact of water sources with poorly contained pathogens. See Campos, L C, P Ross, Z A Nasir, H Taylor, and J Parkinson (2015), “Development and application of a methodology to assess sanitary risks in Maputo, Mozambique”, Environment and Urbanization Vol 27, No 2, pages 371–388.
51.
52.
See reference 14.
53.
See reference 13, Abrahams et al. (2000), Jakus et al. (2009), and ![]() .
.